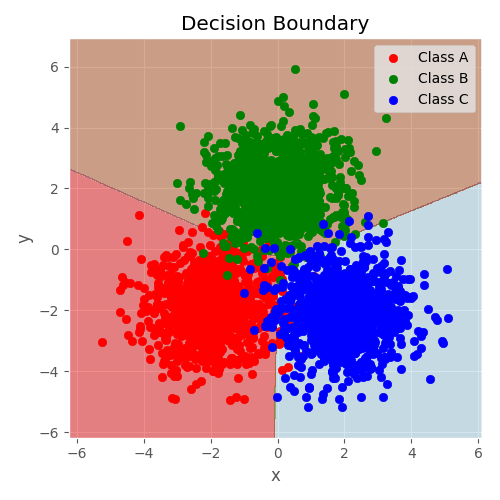
Multiclass Classification with NumPy and TMVA

Python source code: plot_multiclass.py
from array import array
import numpy as np
from numpy.random import RandomState
from root_numpy.tmva import add_classification_events, evaluate_reader
from root_numpy import ROOT_VERSION
import matplotlib.pyplot as plt
from ROOT import TMVA, TFile, TCut

plt.style.use('ggplot')
RNG = RandomState(42)

# Construct an example multiclass dataset
n_events = 1000
class_0 = RNG.multivariate_normal(
    [-2, -2], np.diag([1, 1]), n_events)
class_1 = RNG.multivariate_normal(
    [0, 2], np.diag([1, 1]), n_events)
class_2 = RNG.multivariate_normal(
    [2, -2], np.diag([1, 1]), n_events)
X = np.concatenate([class_0, class_1, class_2])
y = np.ones(X.shape[0])
w = RNG.randint(1, 10, n_events * 3)
y[:class_0.shape[0]] *= 0
y[-class_2.shape[0]:] *= 2
permute = RNG.permutation(y.shape[0])
X = X[permute]
y = y[permute]

# Split into training and test datasets
X_train, y_train, w_train = X[:n_events], y[:n_events], w[:n_events]
X_test, y_test, w_test = X[n_events:], y[n_events:], w[n_events:]

output = TFile('tmva_output.root', 'recreate')
factory = TMVA.Factory('classifier', output,
                       'AnalysisType=Multiclass:'
                       '!V:Silent:!DrawProgressBar')

if ROOT_VERSION >= '6.07/04':
    data = TMVA.DataLoader('.')
else:
    data = factory
for n in range(2):
    data.AddVariable('f{0}'.format(n), 'F')

# Call root_numpy's utility functions to add events from the arrays
add_classification_events(data, X_train, y_train, weights=w_train)
add_classification_events(data, X_test, y_test, weights=w_test, test=True)
# The following line is necessary if events have been added individually:
data.PrepareTrainingAndTestTree(TCut('1'), 'NormMode=EqualNumEvents')

# Train an MLP
if ROOT_VERSION >= '6.07/04':
    BookMethod = factory.BookMethod
else:
    BookMethod = TMVA.Factory.BookMethod
BookMethod(data, 'MLP', 'MLP',
           'NeuronType=tanh:NCycles=200:HiddenLayers=N+2,2:'
           'TestRate=5:EstimatorType=MSE')
factory.TrainAllMethods()

# Classify the test dataset with the BDT
reader = TMVA.Reader()
for n in range(2):
    reader.AddVariable('f{0}'.format(n), array('f', [0.]))
reader.BookMVA('MLP', 'weights/classifier_MLP.weights.xml')
class_proba = evaluate_reader(reader, 'MLP', X_test)

# Plot the decision boundaries
plot_colors = "rgb"
plot_step = 0.02
class_names = "ABC"
cmap = plt.get_cmap('Paired')

fig = plt.figure(figsize=(5, 5))
fig.patch.set_alpha(0)
x_min, x_max = X[:, 0].min() - 1, X[:, 0].max() + 1
y_min, y_max = X[:, 1].min() - 1, X[:, 1].max() + 1
xx, yy = np.meshgrid(np.arange(x_min, x_max, plot_step),
                     np.arange(y_min, y_max, plot_step))

Z = evaluate_reader(reader, 'MLP', np.c_[xx.ravel(), yy.ravel()])
Z = np.argmax(Z, axis=1) - 1
Z = Z.reshape(xx.shape)
plt.contourf(xx, yy, Z, cmap=cmap, alpha=0.5)
plt.axis("tight")

# Plot the training points
for i, n, c in zip(range(3), class_names, plot_colors):
    idx = np.where(y == i)
    plt.scatter(X[idx, 0], X[idx, 1],
                c=c, cmap=cmap,
                label="Class %s" % n)
plt.xlim(x_min, x_max)
plt.ylim(y_min, y_max)
plt.legend(loc='upper right')
plt.xlabel('x')
plt.ylabel('y')
plt.title('Decision Boundary')

plt.tight_layout()
plt.show()
Total running time of the example: 2.61 seconds