hypotests#
This submodule provides tools to do statistical inferences such as discovery test and computations of
upper limits or confidence intervals. hepstats needs a fitting backend to perform computations such as
zfit. Any fitting library can be used if their API is compatible with hepstats
(see api checks).
We give here a simple example of an upper limit calculation of the yield of a Gaussian signal with known mean and sigma over an exponential background. The fitting backend used is the zfit package. If you are unfamiliar with zfit you can have a look at the zfit documentation.
First we import what’s necessary from zfit, such as the ExtendedUnbinnedNLL class as we want to construct an extended unbinned likelihood. Minuit is also imported, it is a zfit wrapper of the the minuit minimizer from iminuit.
>>> import zfit
>>> from zfit.loss import ExtendedUnbinnedNLL
>>> from zfit.minimize import Minuit
>>> import numpy as np
Then we construct the data sample which consists of 300 points that are drawn from an exponential distribution with -2 slope, constituting the background, whereas 10 points drawn from a Gaussian distribution of mean 1.2 and width 0.1, is the signal. The fit range is defined between 0.1 and 3.0 meaning that some points of the background distribution are filtered out. The data, which is a numpy array, is then transformed into a zfit Data object.
>>> bounds = (0.1, 3.0)
>>> obs = zfit.Space('x', limits=bounds)
>>> bkg = np.random.exponential(1/2, 300)
>>> peak = np.random.normal(1.2, 0.1, 10)
>>> data = np.concatenate((bkg, peak))
>>> data = data[(data > bounds[0]) & (data < bounds[1])]
>>> data = zfit.Data.from_numpy(obs=obs, array=data)
Now we build the model. For the background an exponential pdf with lambda_, the slope of the exponential as a free parameter. For the signal a Gaussian pdf is used with mean and width fixed to 1.2 and 0.1 respectively. The background and signal pdfs are extended using the yield parameters Nbkg and Nsig respectively, which are free. The extended negative log-likelihood is then constructed using the background and signal models summed and the data.
>>> lambda_ = zfit.Parameter("lambda", -2.0, -4.0, -1.0)
>>> Nsig = zfit.Parameter("Nsig", 1., -20., 500)
>>> Nbkg = zfit.Parameter("Nbkg", 250, 0., 50)
>>> signal = zfit.pdf.Gauss(obs=obs, mu=1.2, sigma=0.1).create_extended(Nsig)
>>> background = zfit.pdf.Exponential(obs=obs, lambda_=lambda_).create_extended(Nbkg)
>>> total = zfit.pdf.SumPDF([signal, background])
>>> nll = ExtendedUnbinnedNLL(model=total, data=data)
The background plus signal can then be fitted to the data.
>>> # Instantiate a minuit minimizer
>>> minimizer = Minuit()
>>> # minimisation of the loss function
>>> minimum = minimizer.minimize(loss=nll)
>>> minimum.hesse()
>>> print(minimum)
valid |
converged |
param at limit |
edm |
min value |
|---|---|---|---|---|
True |
True |
False |
4.9e-05 |
-1077 |
Parameters
So the fitted number of signal candidates is 4.518 +/- 5.8, which is consistent with zero. We can then compute an
upper limit on this number which should be approximately equal to 4.5 + 2 * 5.8 ≈ 16.
First we import from the calculators submodule of hypotests
the AsymptoticCalculator which takes as input
the loss function and minimizer.
>>> from hepstats.hypotests.calculators import AsymptoticCalculator
>>> calculator = AsymptoticCalculator(nll, Minuit(), asimov_bins=100)
The POI and POIarray
classes are also imported, POI stands for parameter of interest. In our case the POI is Nsig. To compute
an upper limit you need to explicitly specify the background-only hypothesis (null) and the background plus
signal hypothesis, in hepstats this done using POI/ POIarray:
>>> from hepstats.hypotests.parameters import POI, POIarray
>>>
>>> # background only
>>> poialt = POI(Nsig, 0)
>>> # background + signal
>>> poinull = POIarray(Nsig, np.linspace(0.0, 25, 20))
A POI takes as input the parameter Nsig and a single value for a
given hypothesis, for poialt it’s 0 because this is the background only hypothesis. Similarly POIarray
takes as input the parameter Nsig and an array of values to scan for Nsig, from 0 to 25. A range is needed
because the calculator instance will compute a p-value for each value in poinull, the upper limit for
a given confidence level
We can now create an UpperLimit instance which takes as input
the calculator, poinull and poialt. The UpperLimit
instance will ask the calculator to compute the p-values for each value in poinull and eventually find
the value of the upper limit on Nsig (if the upper limit is in the range of the poinull values). Below
is an example on how to compute a CLs upper limit at 95 % confidence level.
>>> from hepstats.hypotests import UpperLimit
>>> ul = UpperLimit(calculator, poinull, poialt)
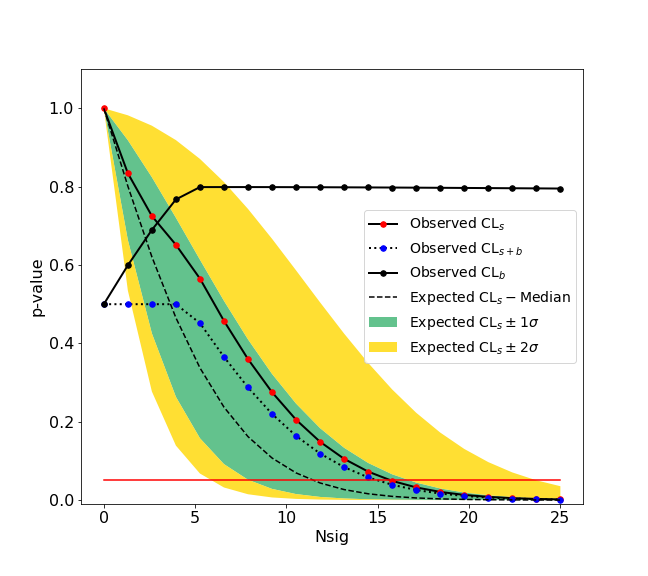
>>> ul.upperlimit(alpha=0.05, CLs=True)
Observed upper limit: Nsig = 15.725784747406346 Expected upper limit: Nsig = 11.927442041887158 Expected upper limit +1 sigma: Nsig = 16.596396280677116 Expected upper limit -1 sigma: Nsig = 8.592750403611896 Expected upper limit +2 sigma: Nsig = 22.24864429383046 Expected upper limit -2 sigma: Nsig = 6.400549971360598
In the result you obtain the observed and expected limits. The observed limit is the limit based on the observation of 4.518 +/- 5.8 signal candidates in data. The expected limit is the limit under the background only hypothesis. A graphical representation on how the upper limit is computed in shown in the following figure.