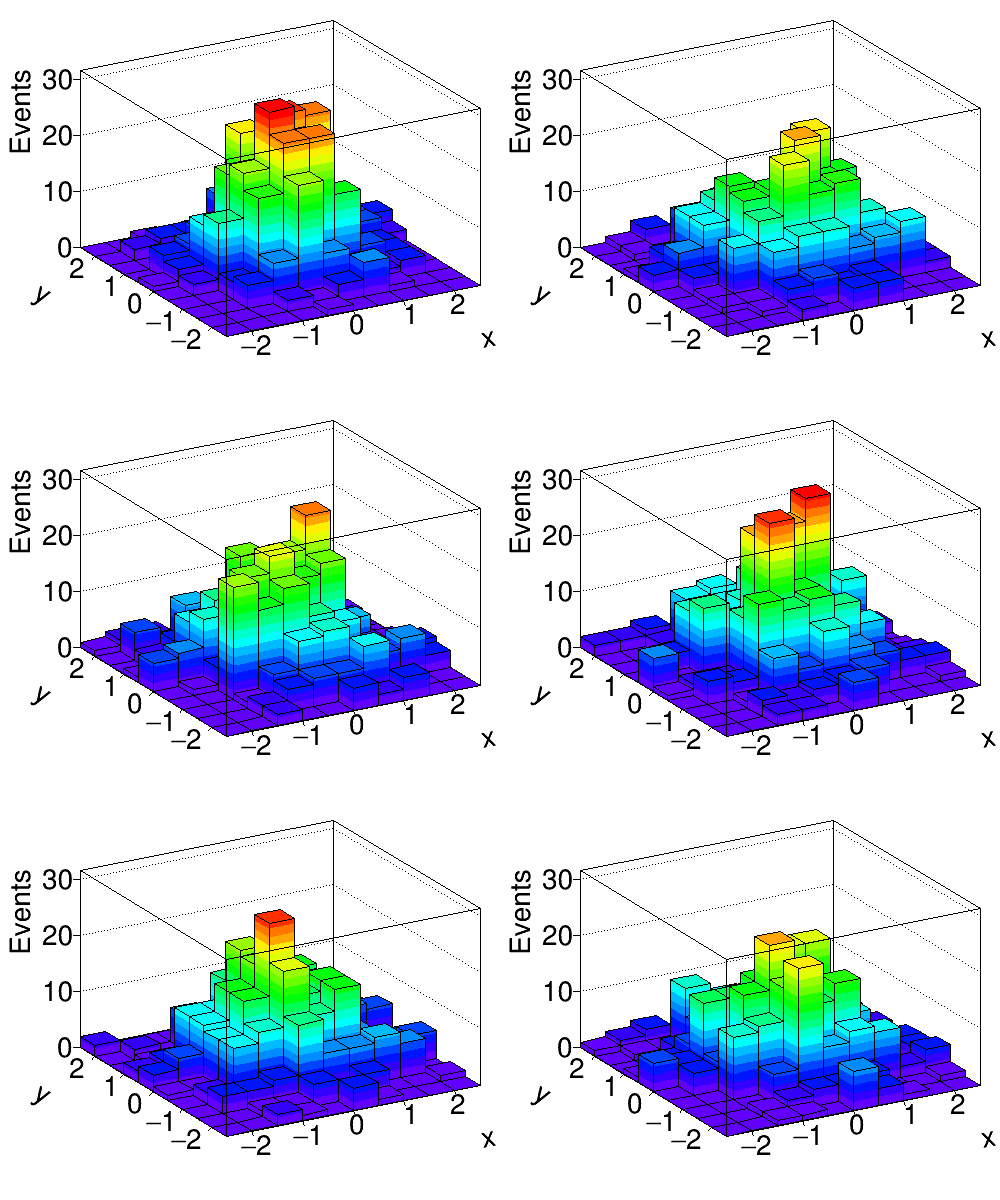
Bootstrap a TTree with NumPy
This example demonstrates how to sample entries in a TTree with replacement with the help of NumPy and root_numpy. This example depends on rootpy which can be installed with pip:
pip install --user rootpy

Python source code: plot_bootstrap.py
from rootpy.extern.six.moves import range
from rootpy.tree import Tree, TreeModel, FloatCol
from rootpy.plotting import Canvas, Hist2D, set_style
from rootpy.io import root_open
from root_numpy import root2array, array2tree, rec2array, fill_hist
import ROOT
import numpy as np
from random import gauss
import random
import os

ROOT.gROOT.SetBatch()
set_style('ATLAS')
np.random.seed(0)
random.seed(0)

# create an example TTree dataset

class Sample(TreeModel):
    x = FloatCol()
    y = FloatCol()


with root_open('sample.root', 'recreate'):
    # generate toy data in a TTree
    tree = Tree('sample', model=Sample)
    for i in range(500):
        tree.x = gauss(0, 1)
        tree.y = gauss(0, 1)
        tree.Fill()
    tree.write()


# read in the TTree as a NumPy array
array = root2array('sample.root', 'sample')

if os.path.exists('bootstrap.gif'):
    os.remove('bootstrap.gif')
# Canvas name is set here to aid the automatic documentation generation
# It needs to take the GIF already saved instead of saving a png of the last
# frame.
canvas = Canvas(width=500, height=400, name='bootstrap.gif')
hist = Hist2D(10, -3, 3, 10, -3, 3, drawstyle='LEGO2')

output = root_open('bootstrap.root', 'recreate')

# bootstrap 10 times
for bootstrap_idx in range(10):
    # sample with replacement
    # http://docs.scipy.org/doc/numpy-dev/reference/generated/numpy.random.choice.html
    sample_idx = np.random.choice(len(array), size=len(array), replace=True)
    array_bootstrapped = array[sample_idx]
    # convert back to a TTree and write it out
    tree_bootstrapped = array2tree(
        array_bootstrapped,
        name='bootstrap_{0}'.format(bootstrap_idx))
    tree_bootstrapped.Write()
    tree_bootstrapped.Delete()
    # fill the ROOT histogram with the numpy array
    hist.Reset()
    fill_hist(hist, rec2array(array_bootstrapped))
    hist.Draw()
    hist.xaxis.title = 'x'
    hist.yaxis.title = 'y'
    hist.zaxis.title = 'Events'
    hist.xaxis.limits = (-2.5, 2.5)
    hist.yaxis.limits = (-2.5, 2.5)
    hist.zaxis.range_user = (0, 30)
    hist.xaxis.divisions = 5
    hist.yaxis.divisions = 5
    hist.zaxis.divisions = 5
    canvas.Print('bootstrap.gif+50')

# loop the gif
canvas.Print('bootstrap.gif++')
output.Close()
Total running time of the example: 5.13 seconds