Comparing histograms¤
mplhep provides dedicated comparison plotters in the mh.comp module for creating plots with different comparison panels. The following functions are available:
mh.comp.hists(): compare two histograms, plot the main plot and a comparison panel.mh.comp.data_model(): compare a model made of histograms or functions to data, plot the main plot and a comparison panel.mh.comp.comparison(): to only plot the comparison panel given two histograms.mh.comp.get_comparison(): to get the[values, lower_uncertainties, upper_uncertainties]for a given comparison type.
Prerequisites
Throughout this guide the following codeblock is assumed.
Comparing two histograms¤
Available methods¤
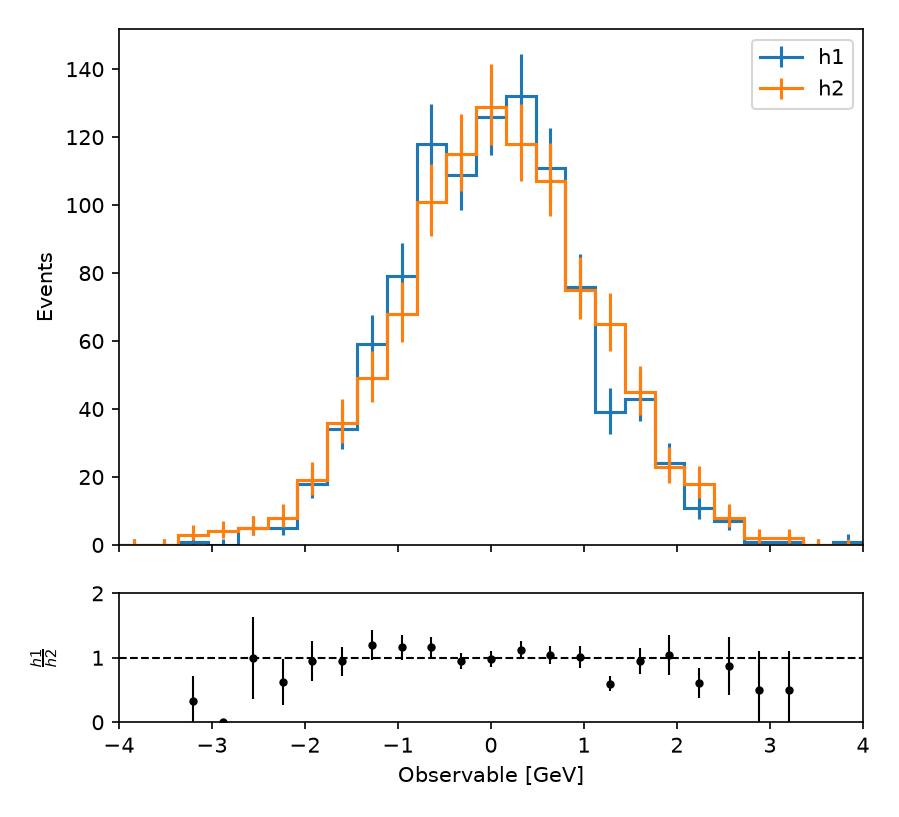
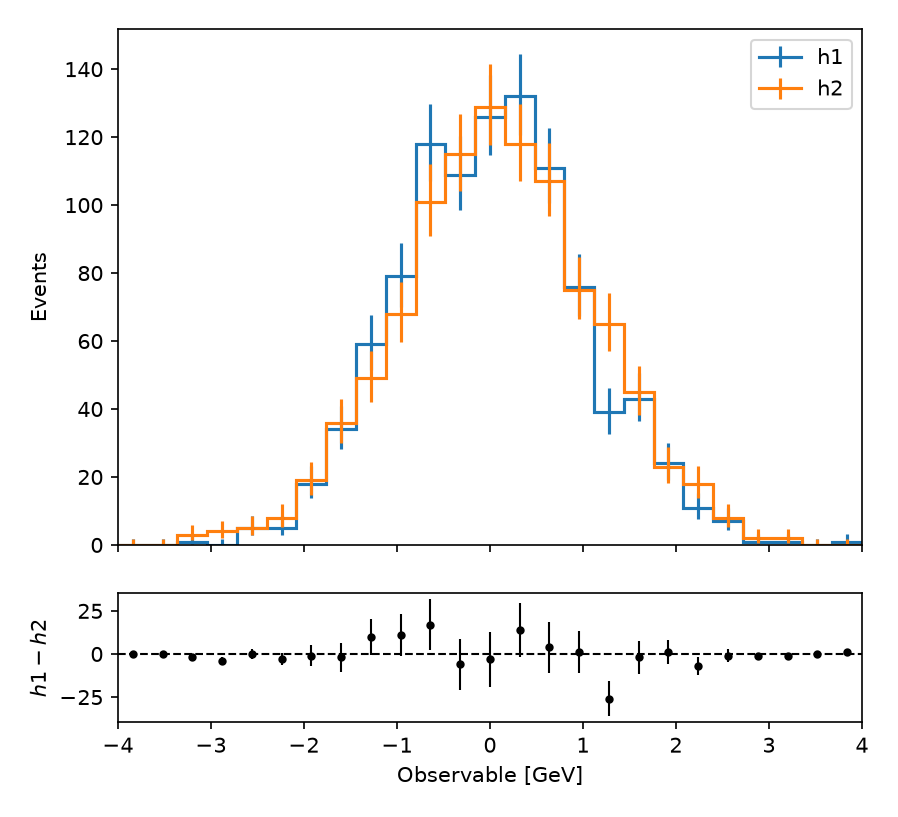
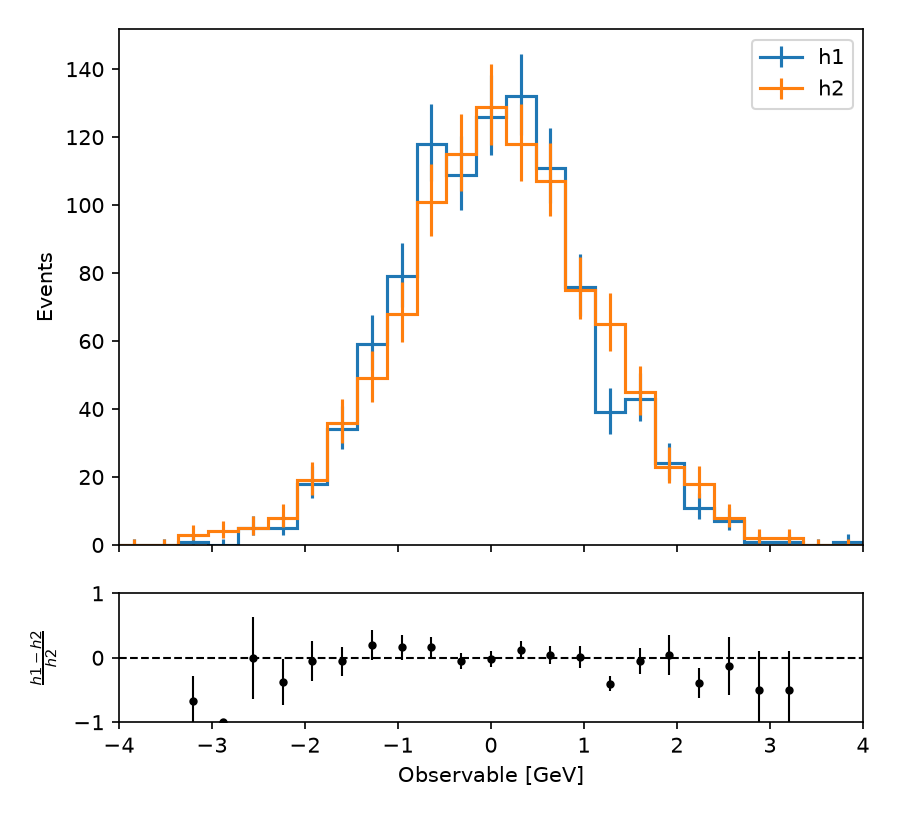
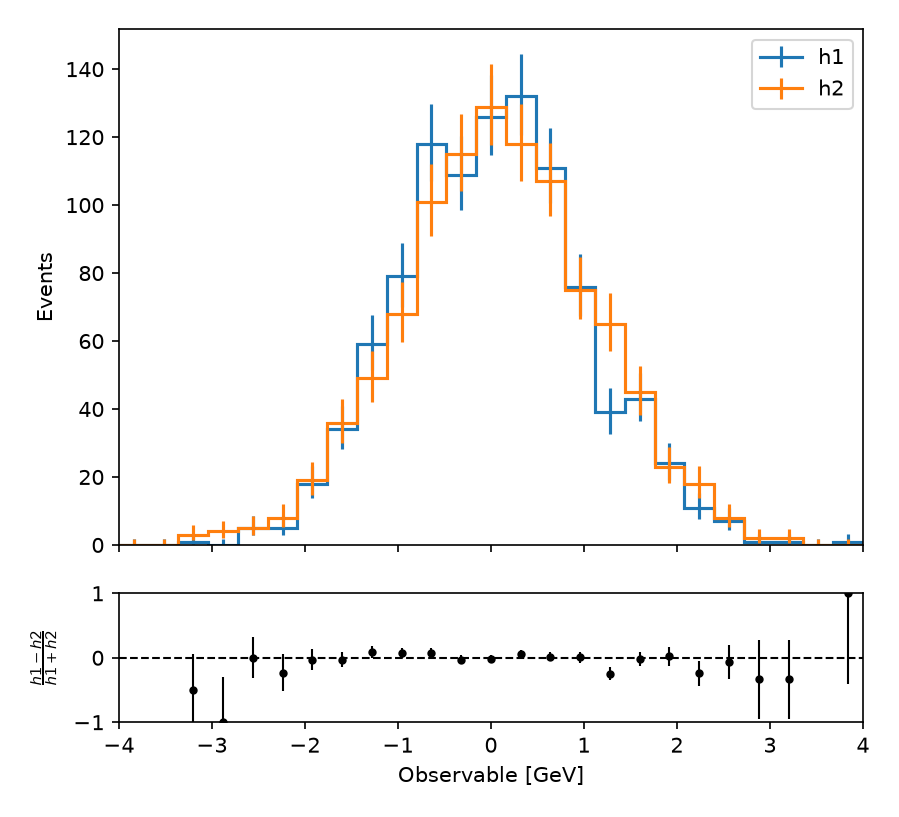
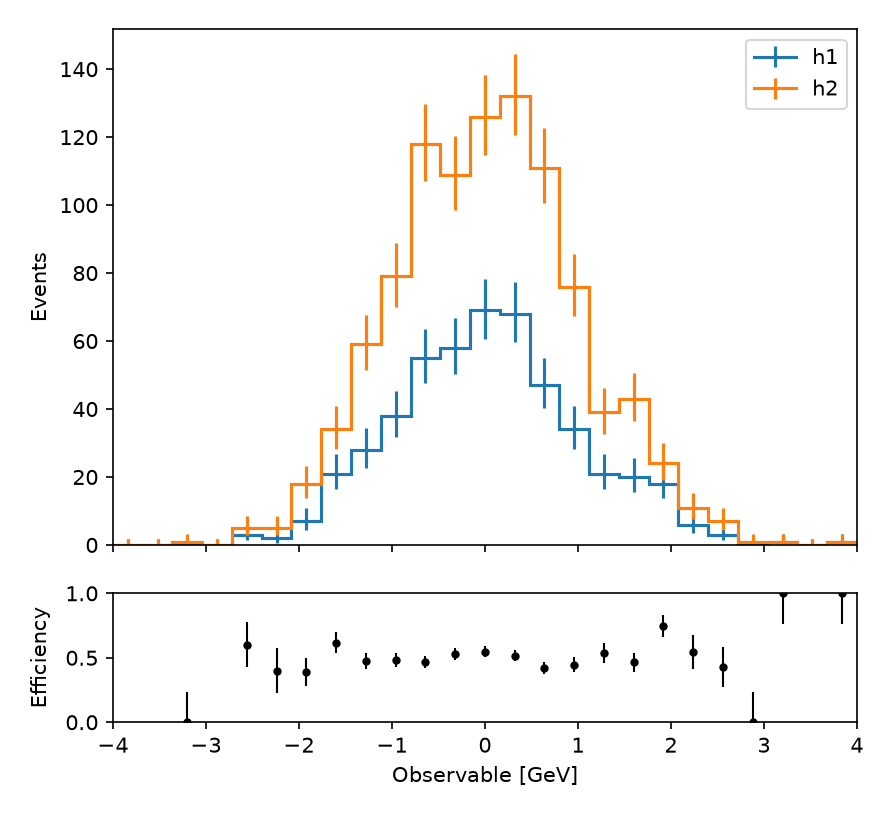
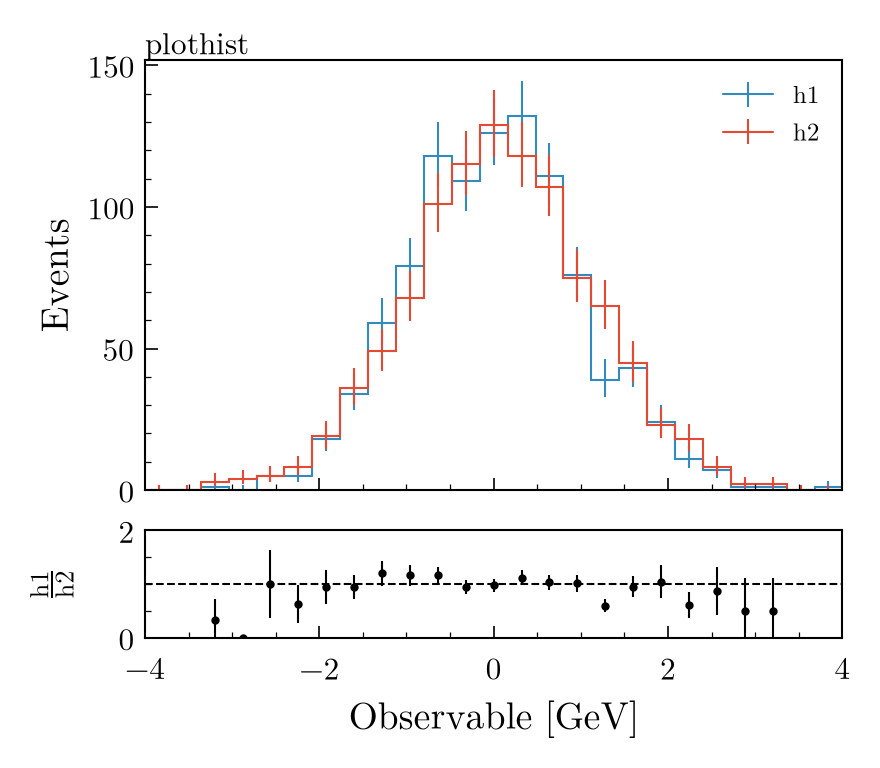
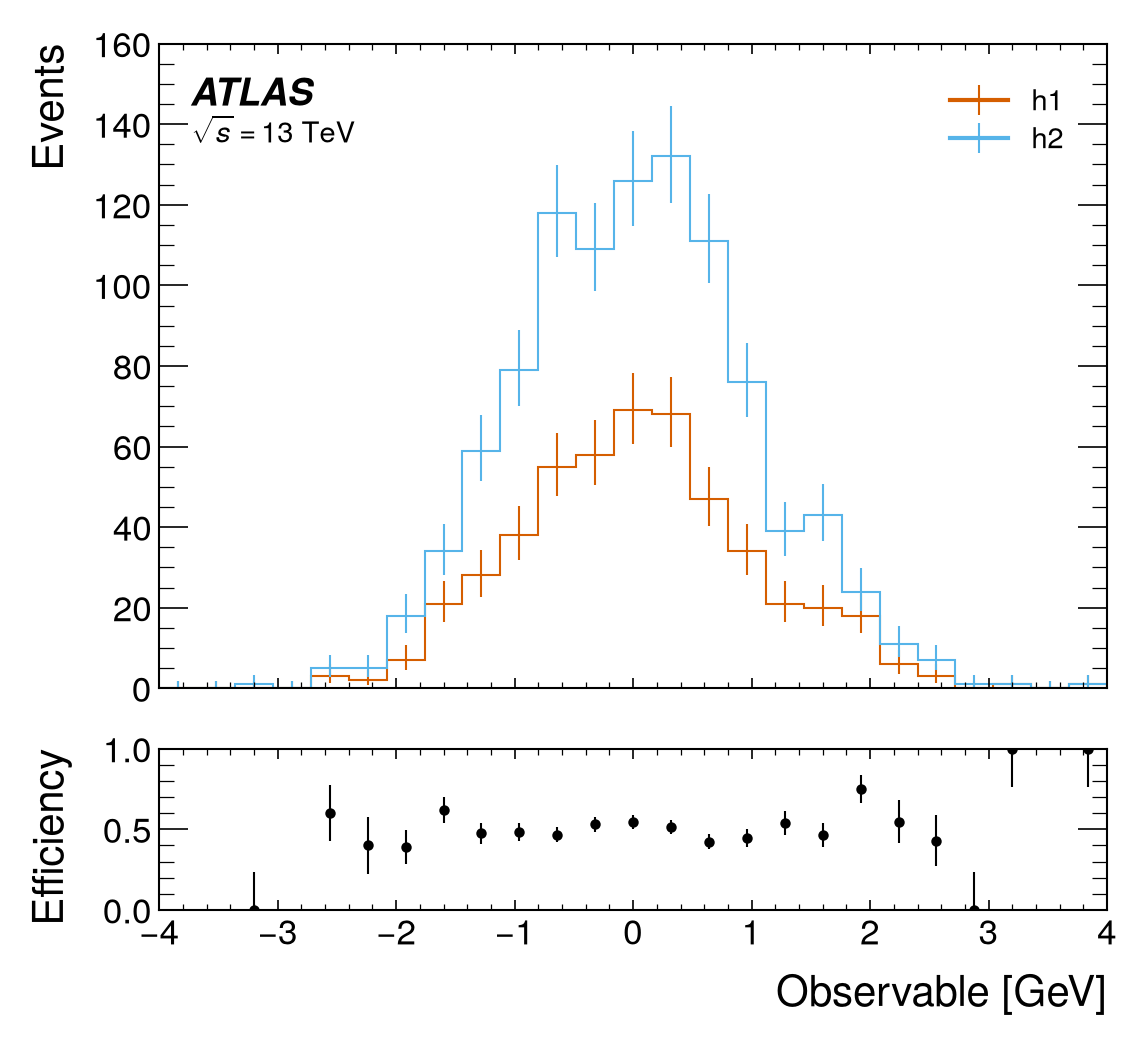
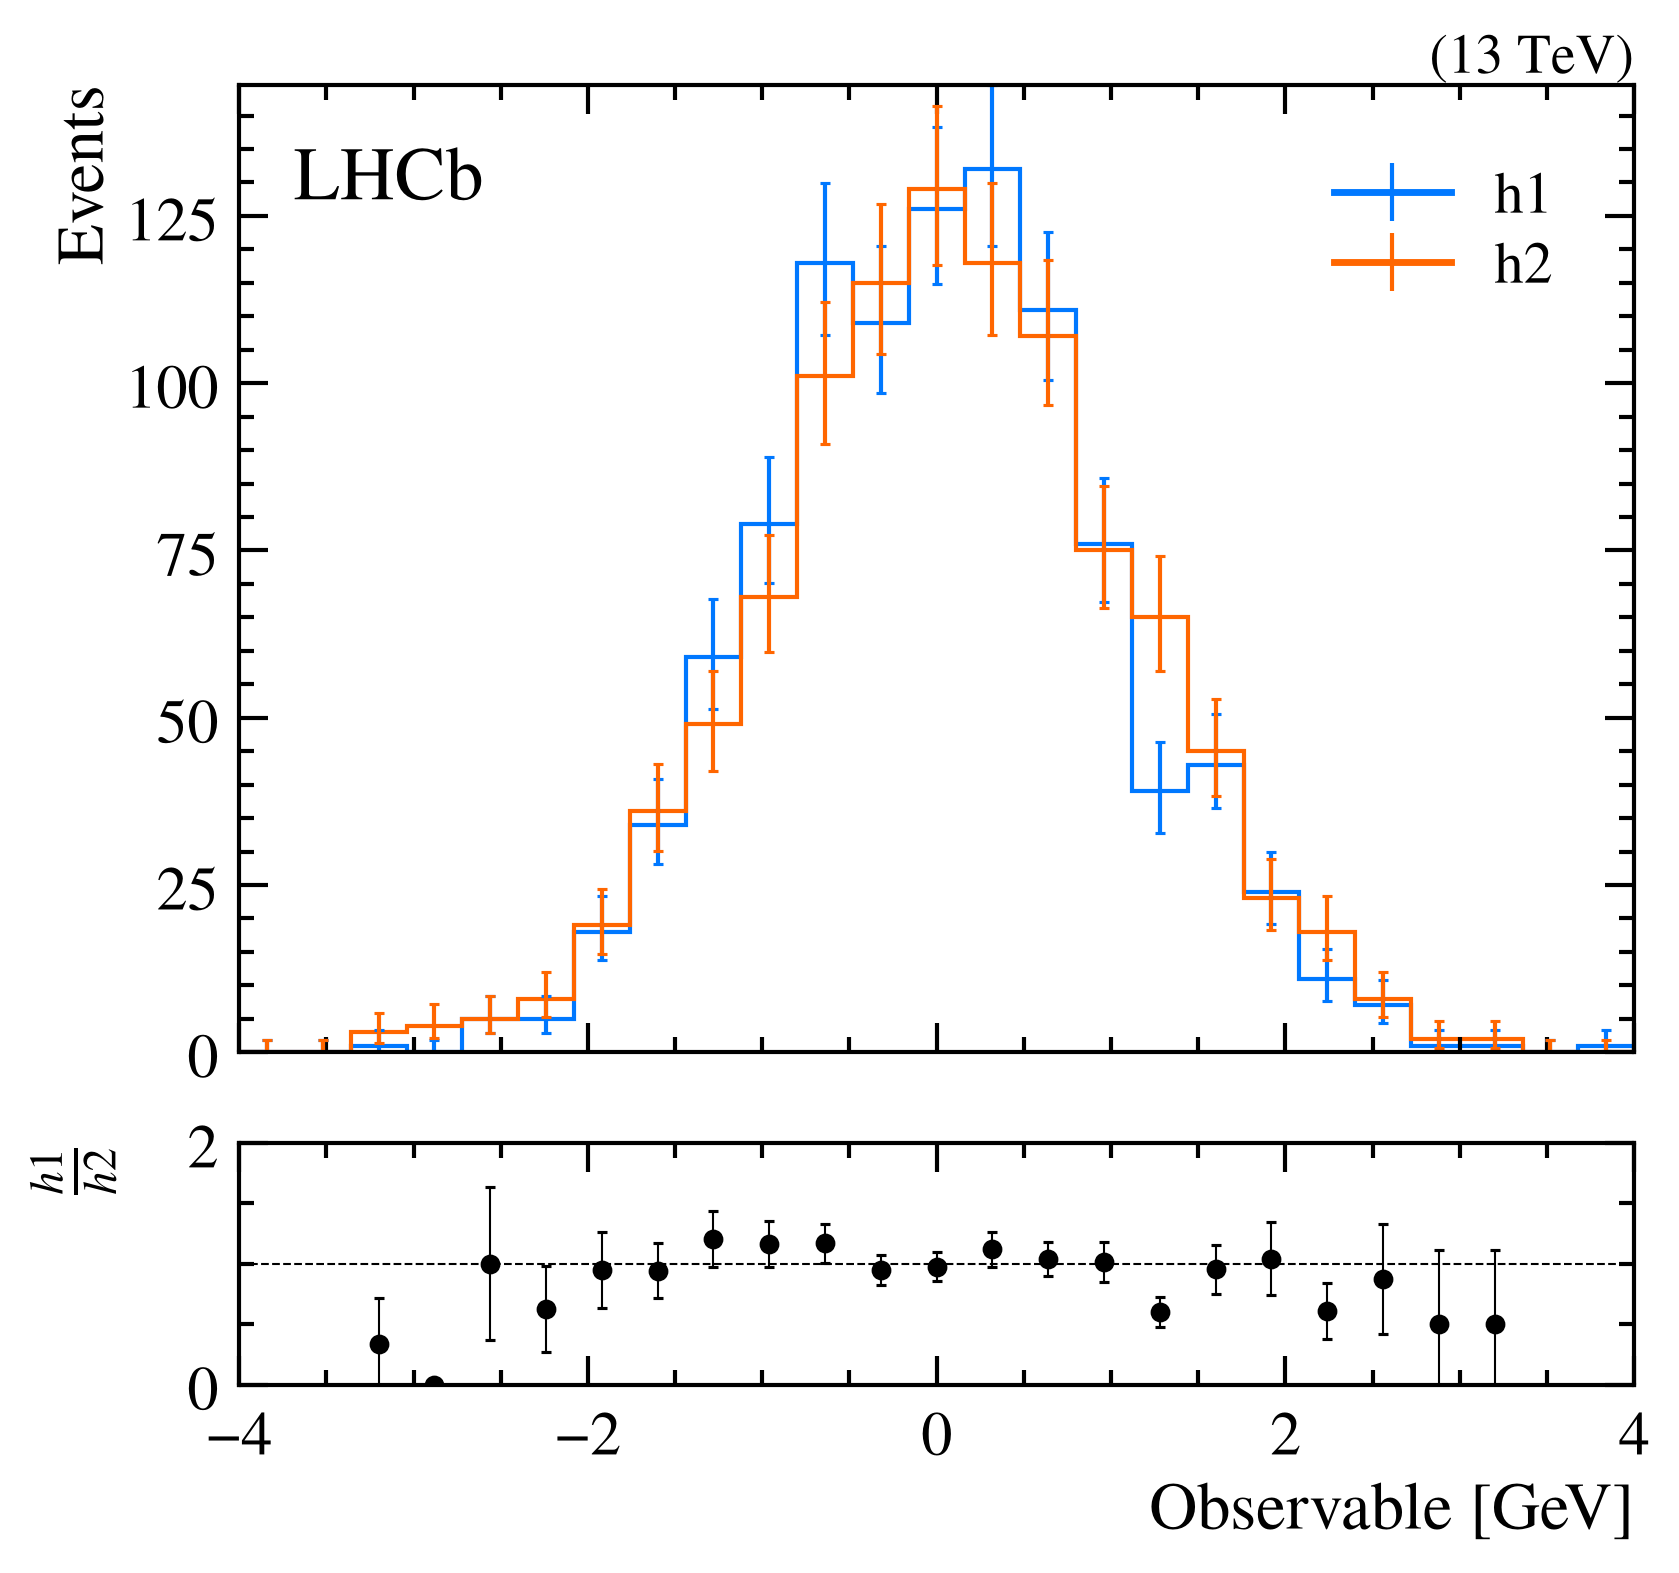
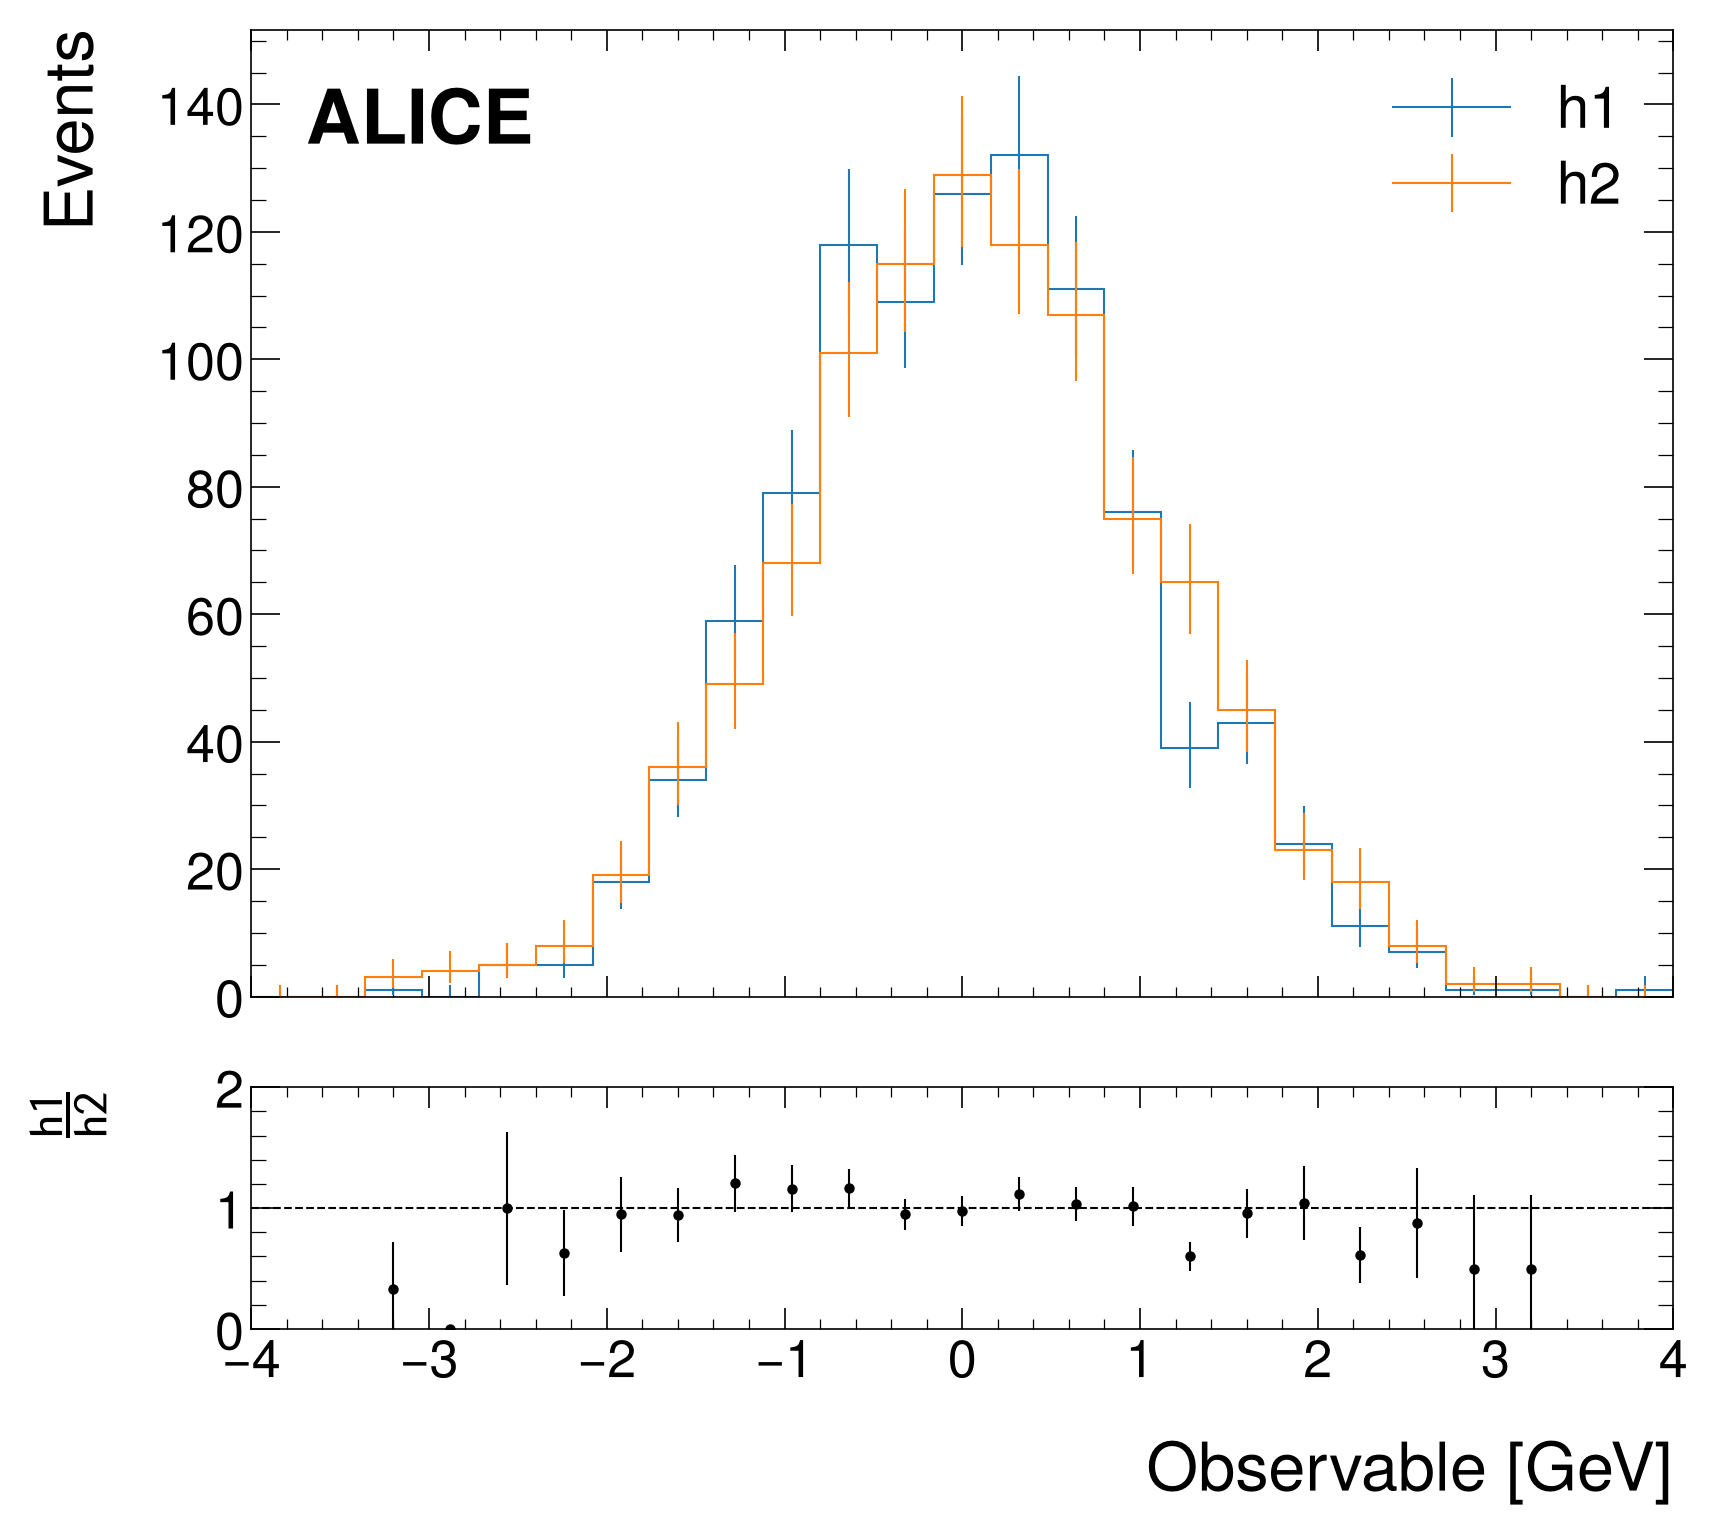
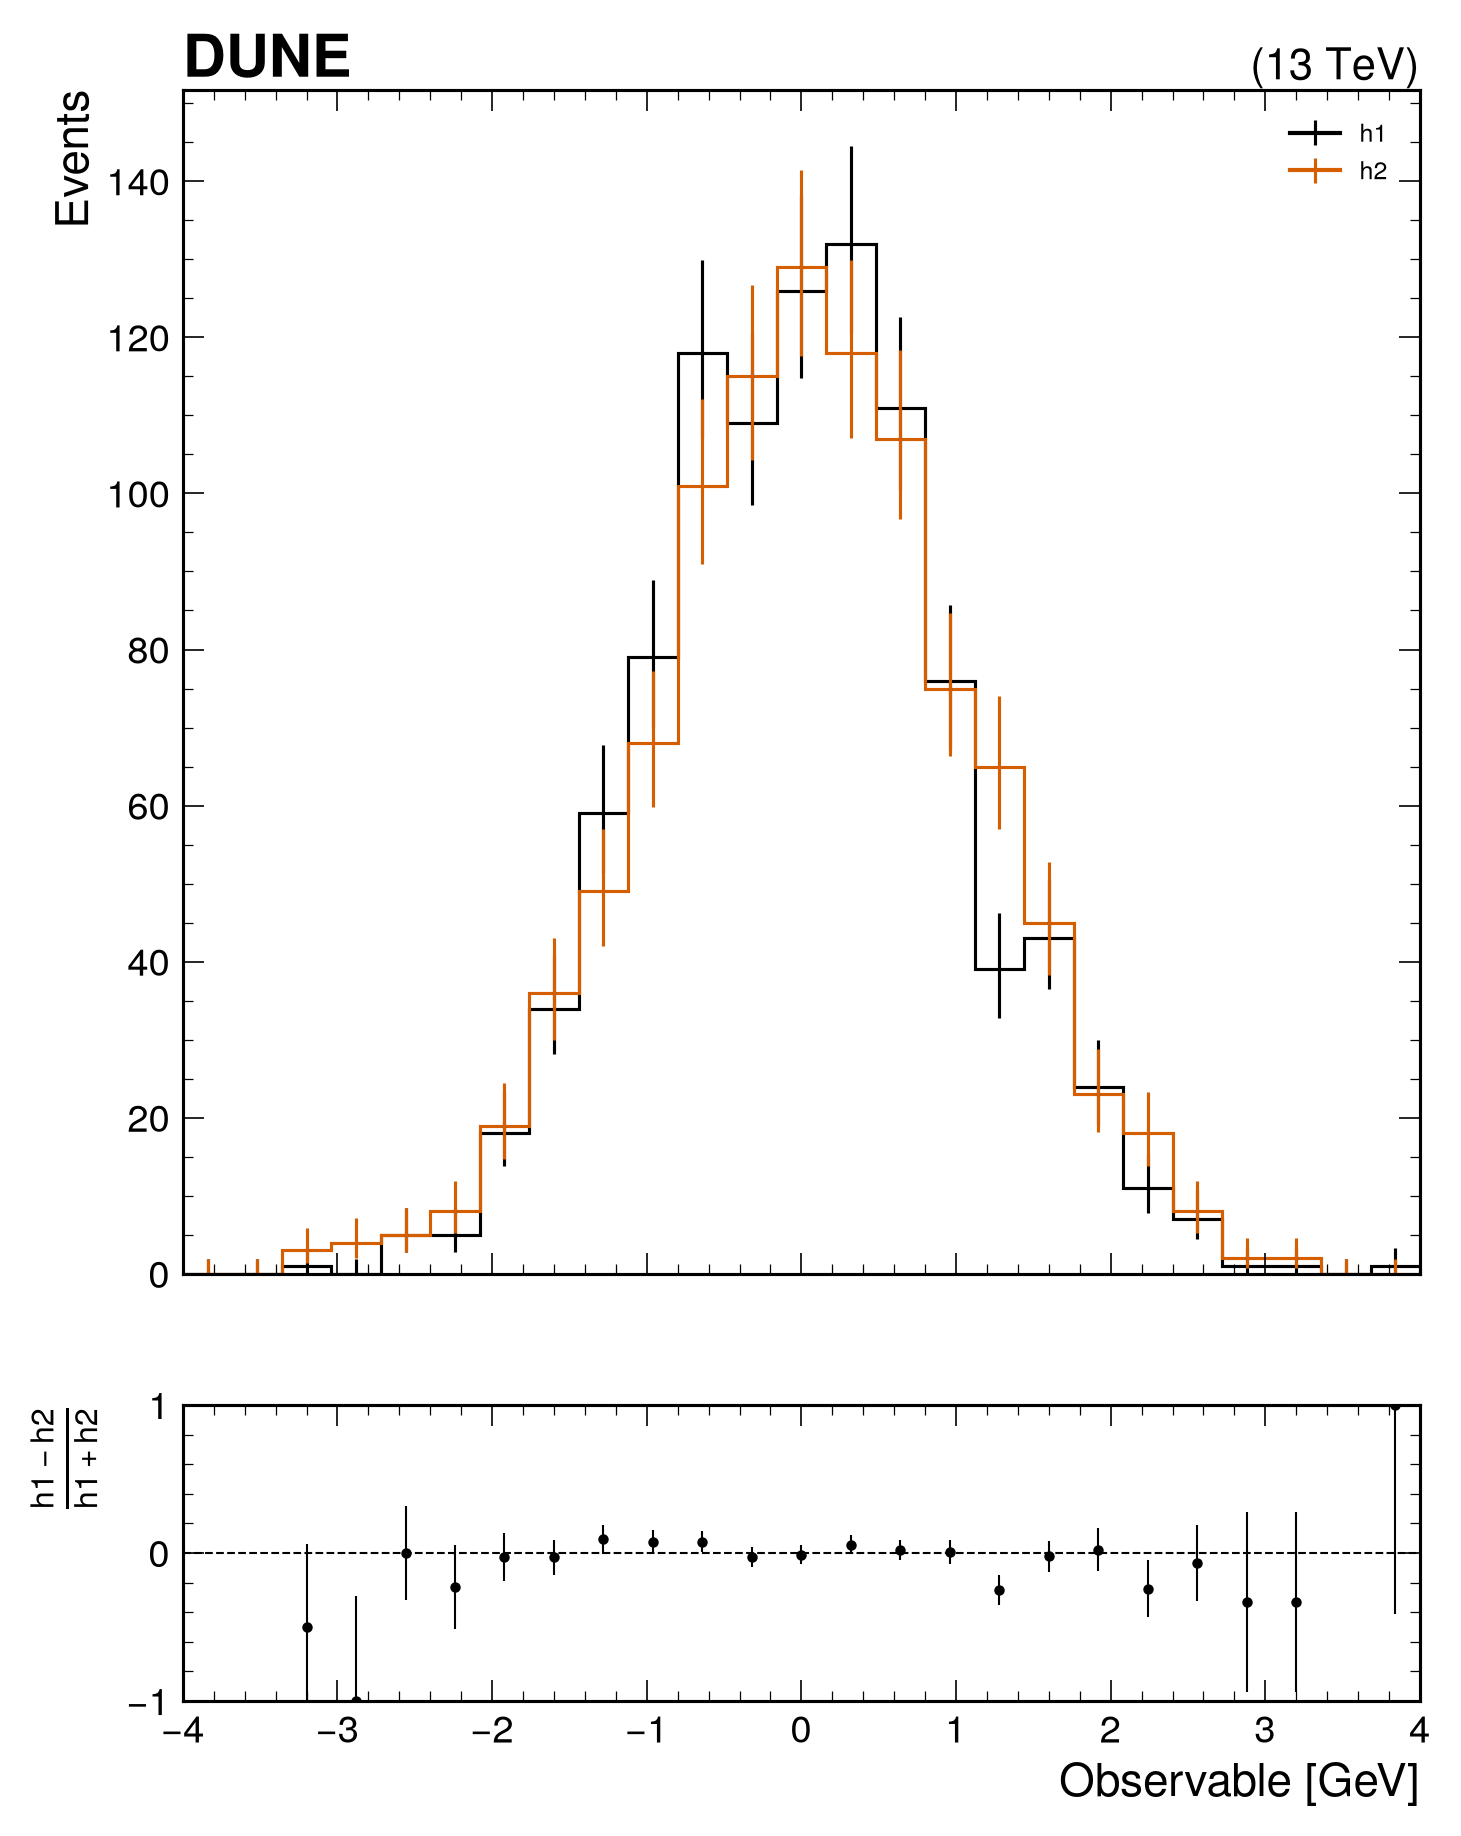
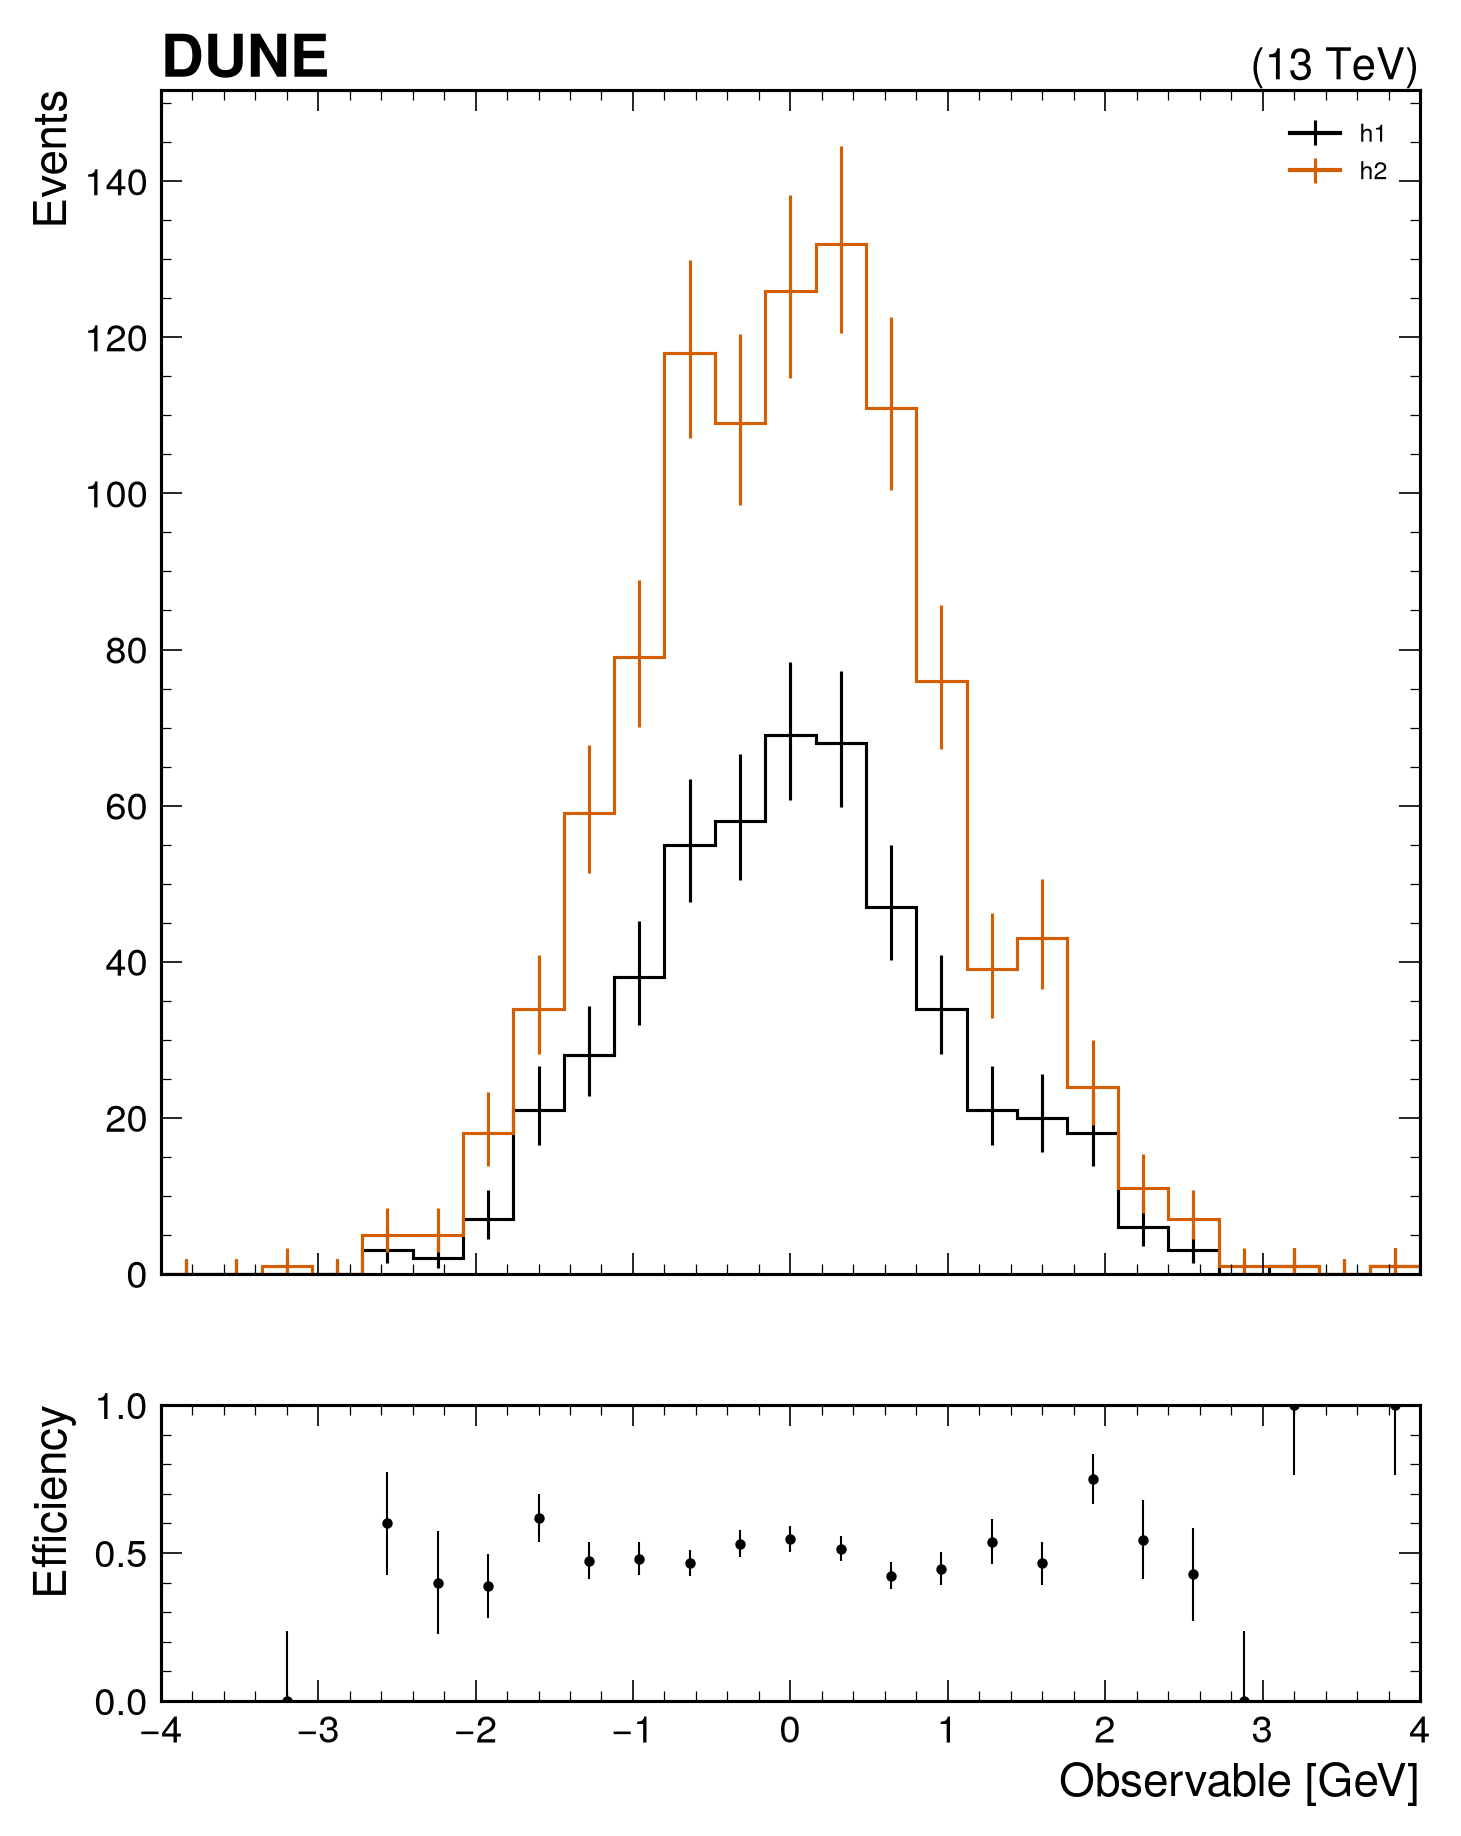
To compare two histograms, use mh.comp.hists(). This function takes two histograms as input and creates a figure with a main plot showing both histograms and a comparison panel below it.
The comparison parameter accepts:
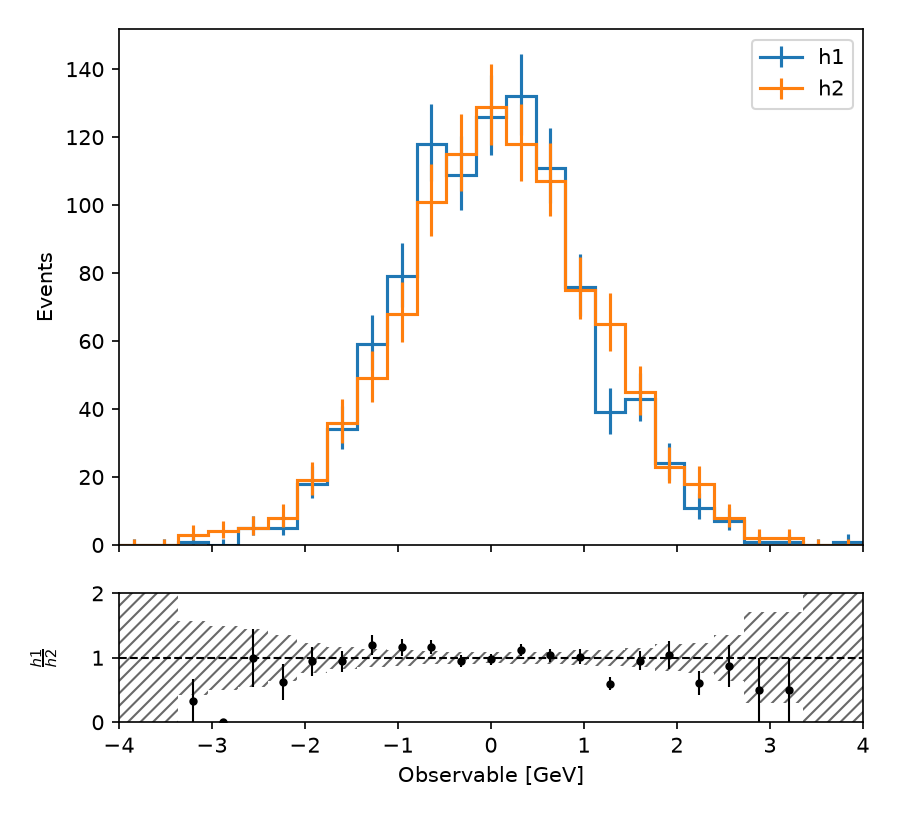
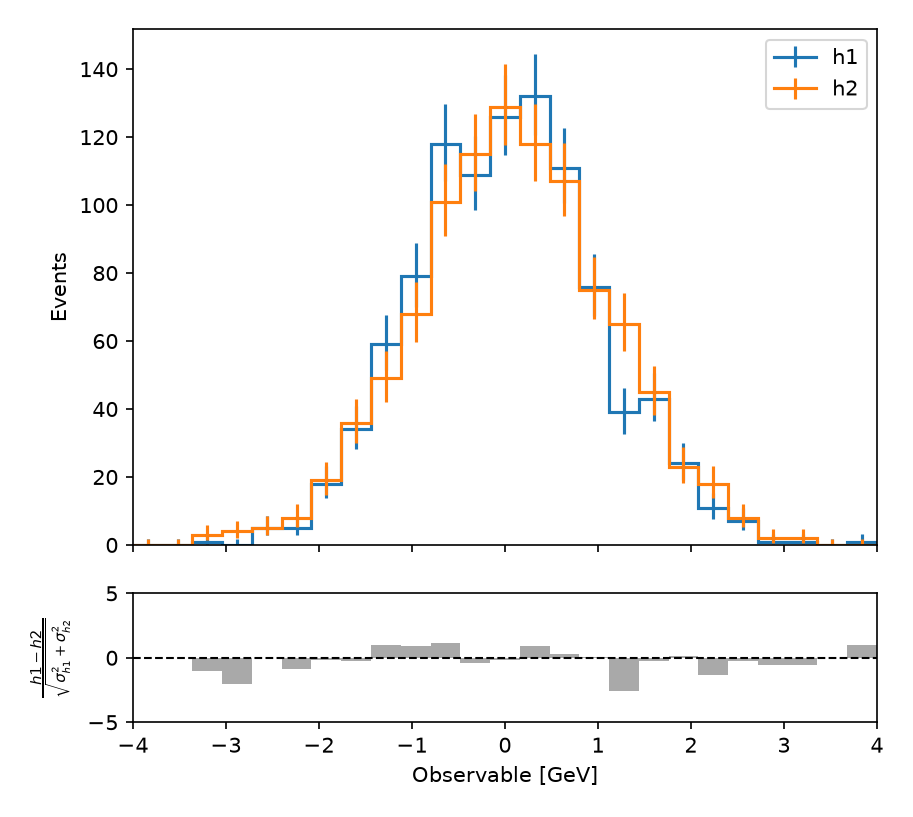
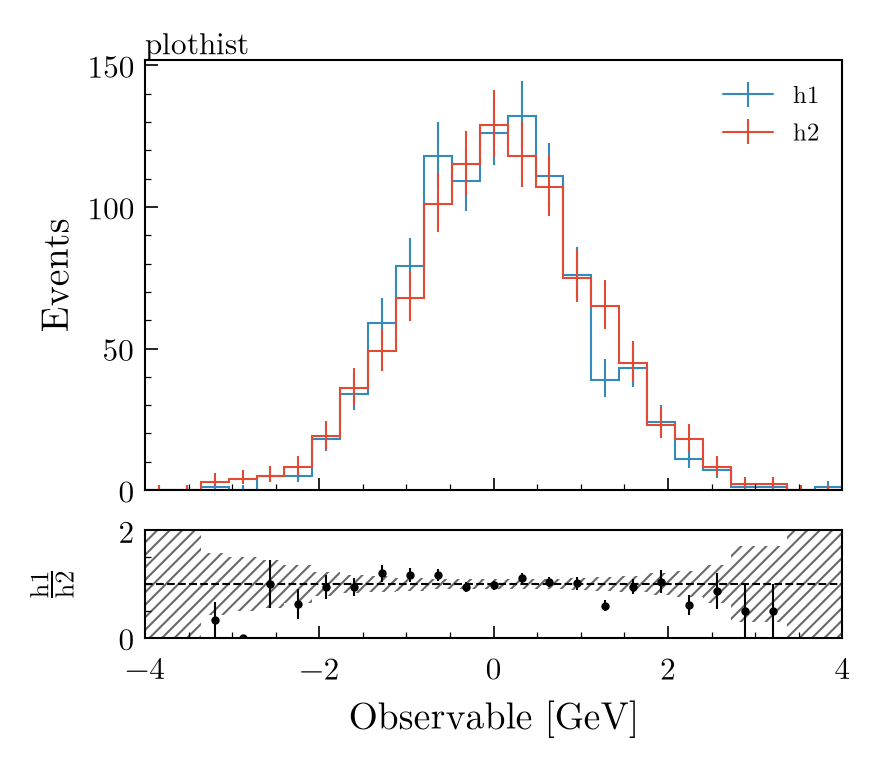
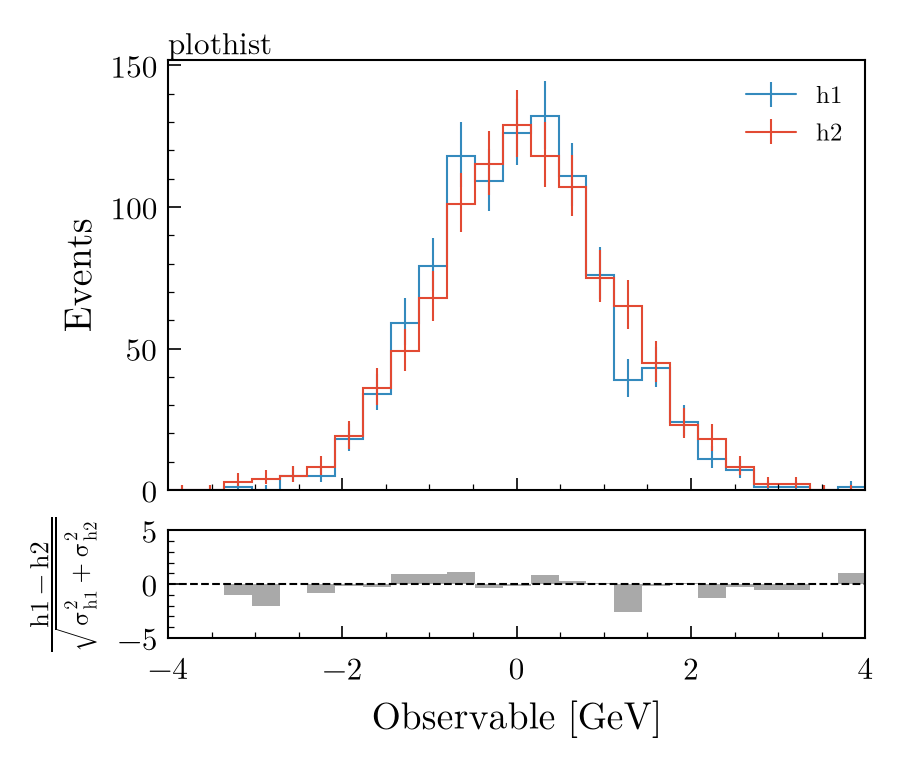
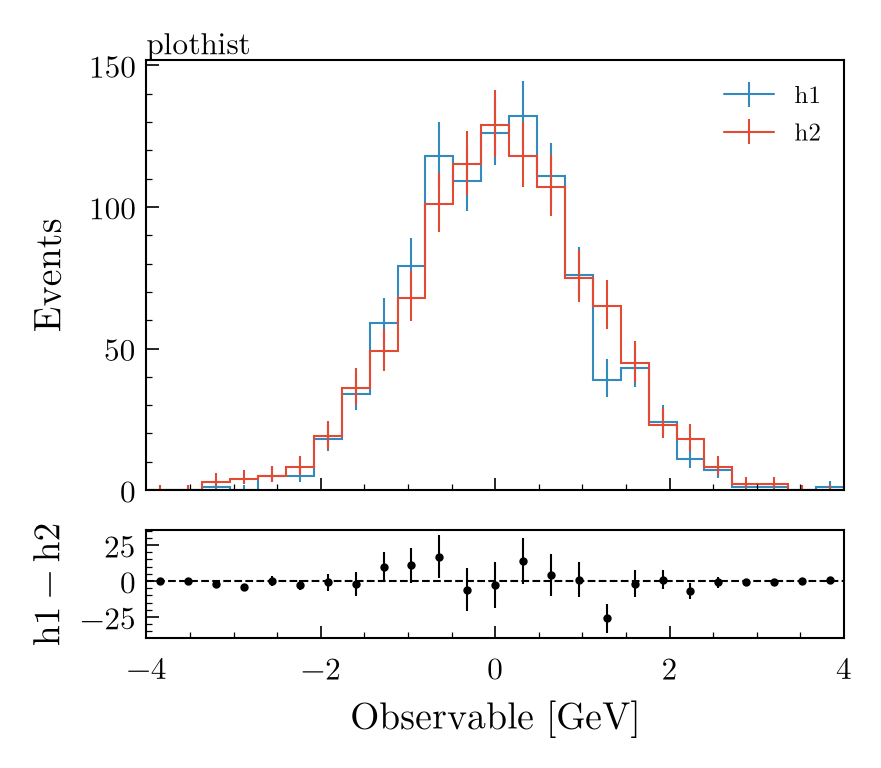
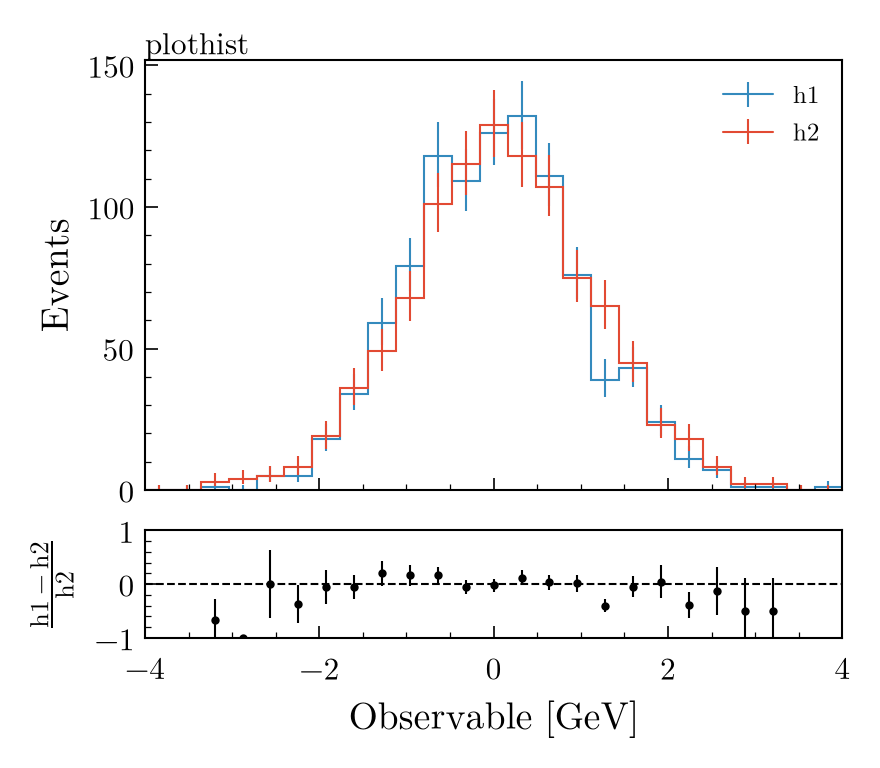
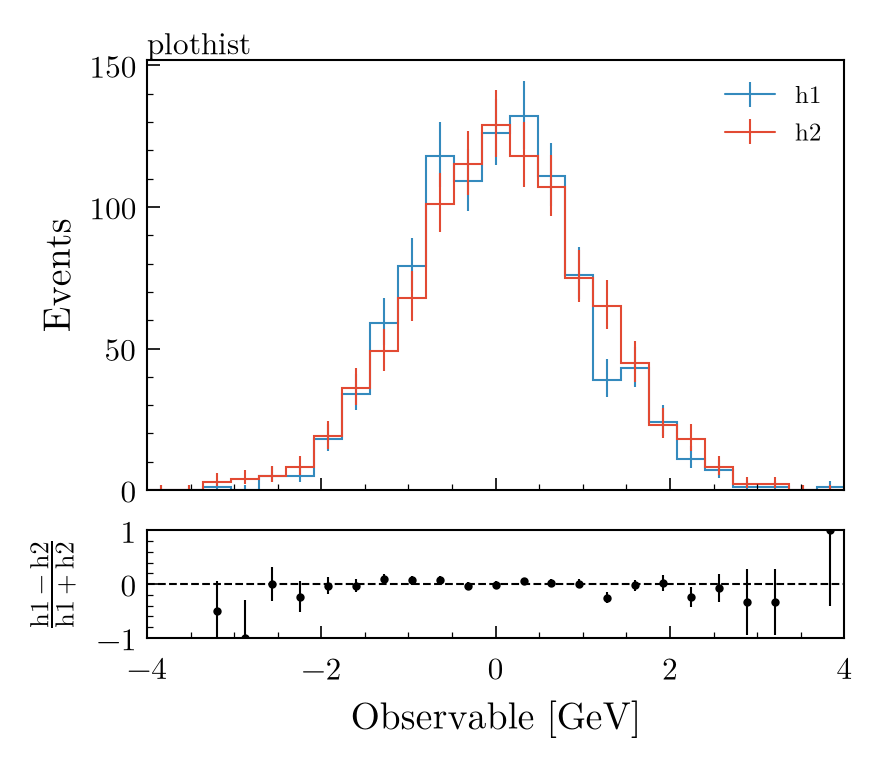
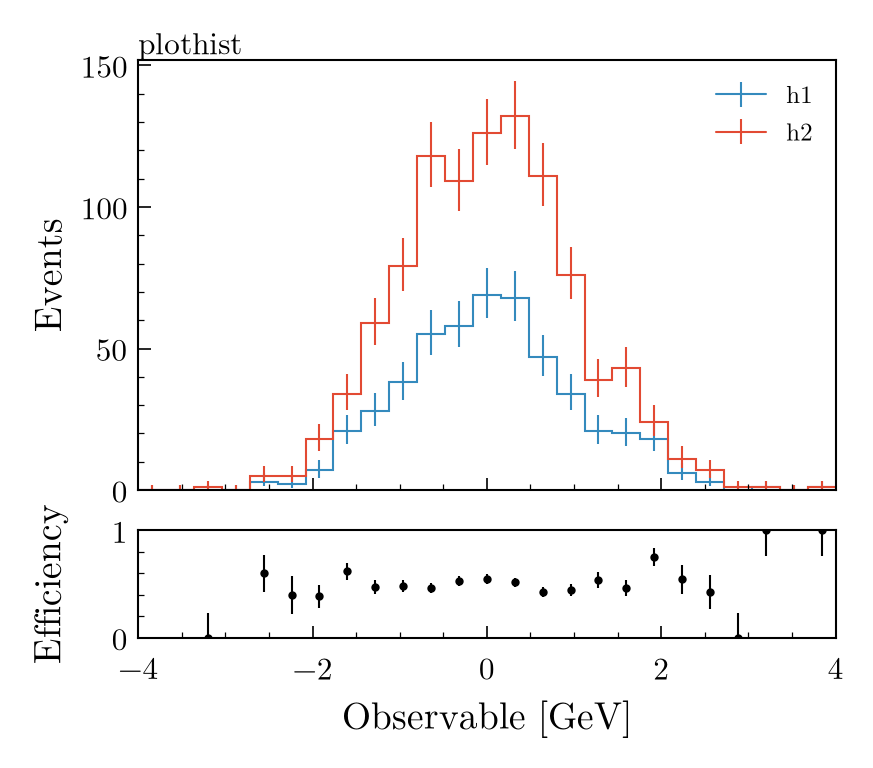
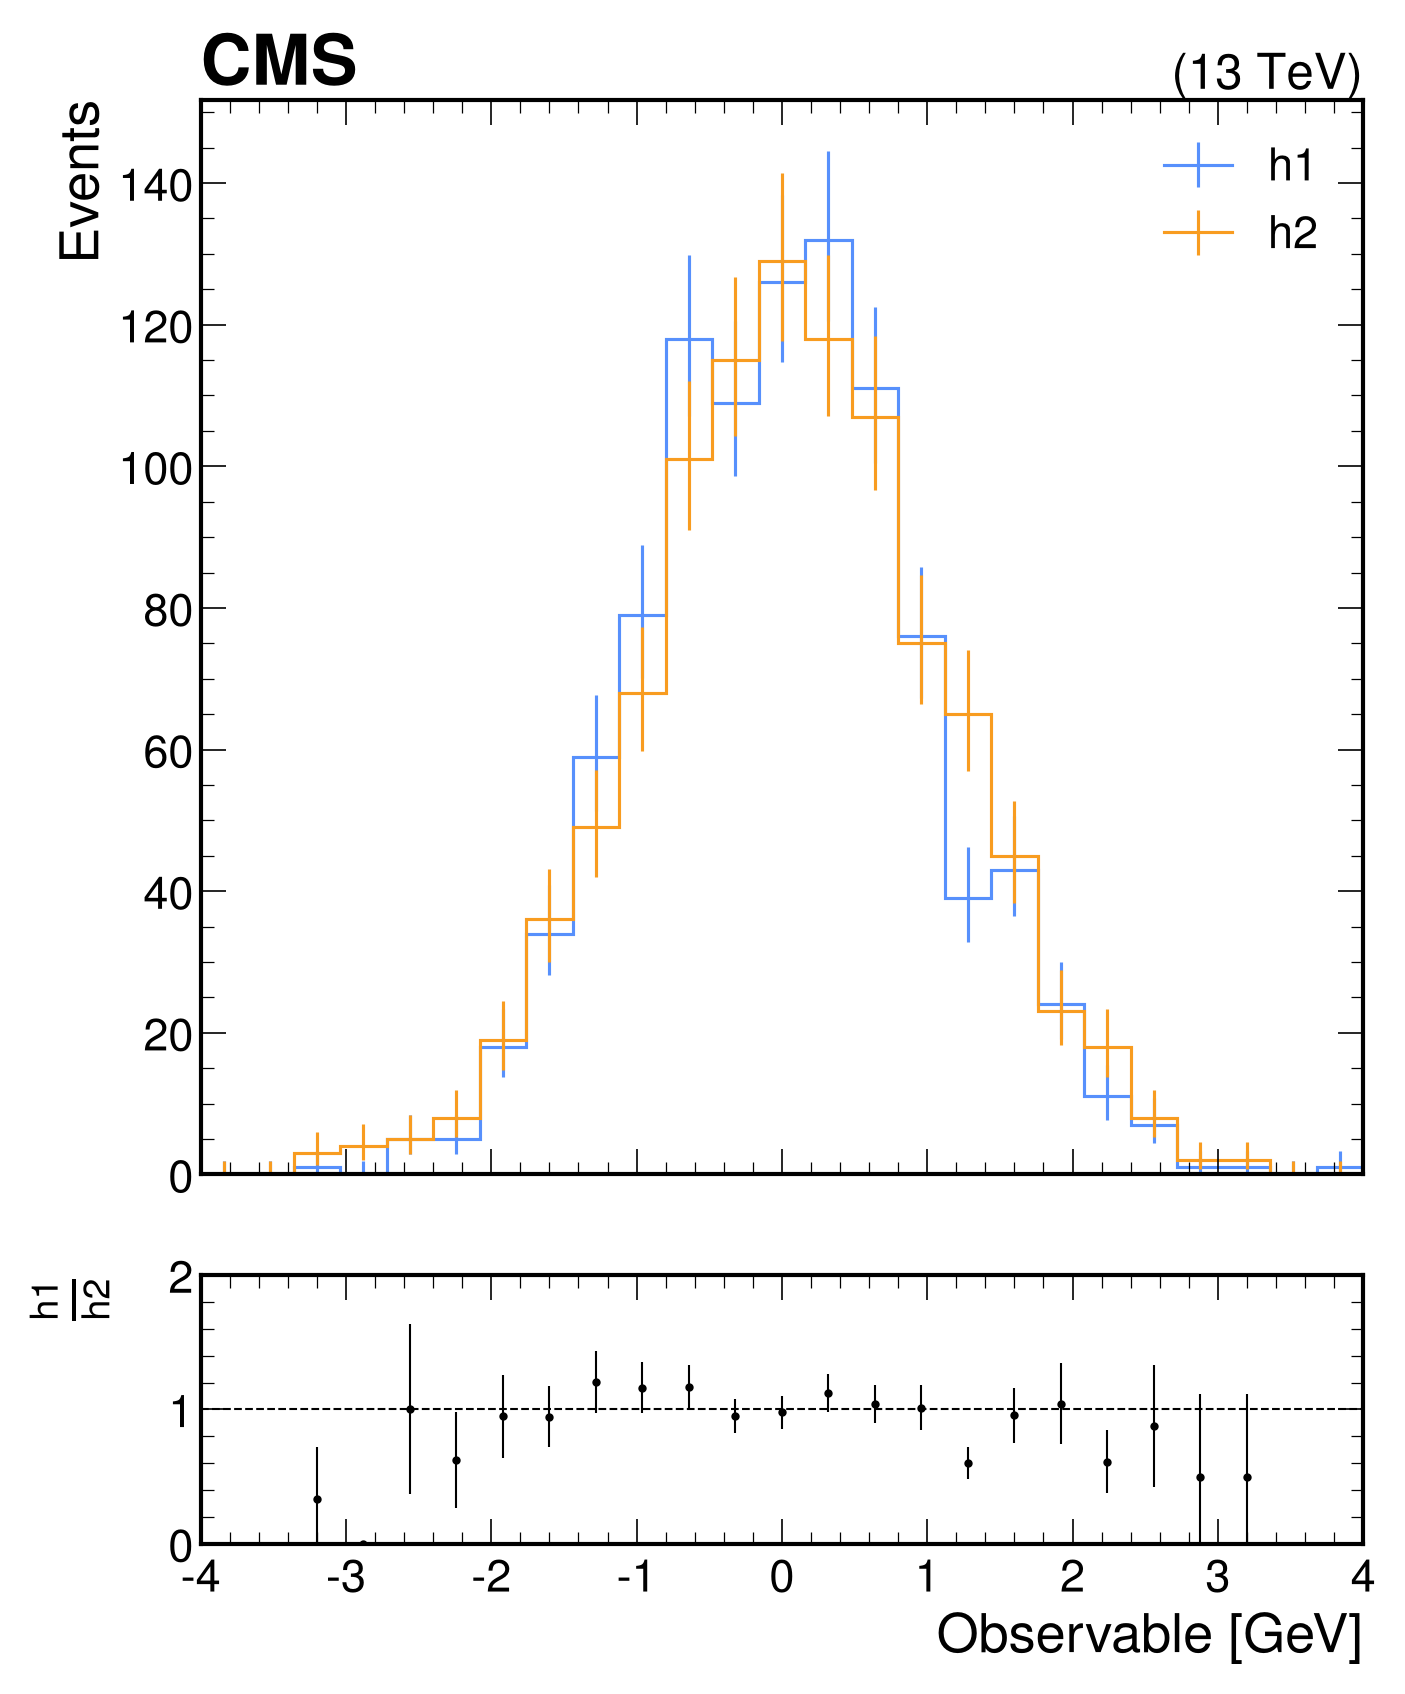
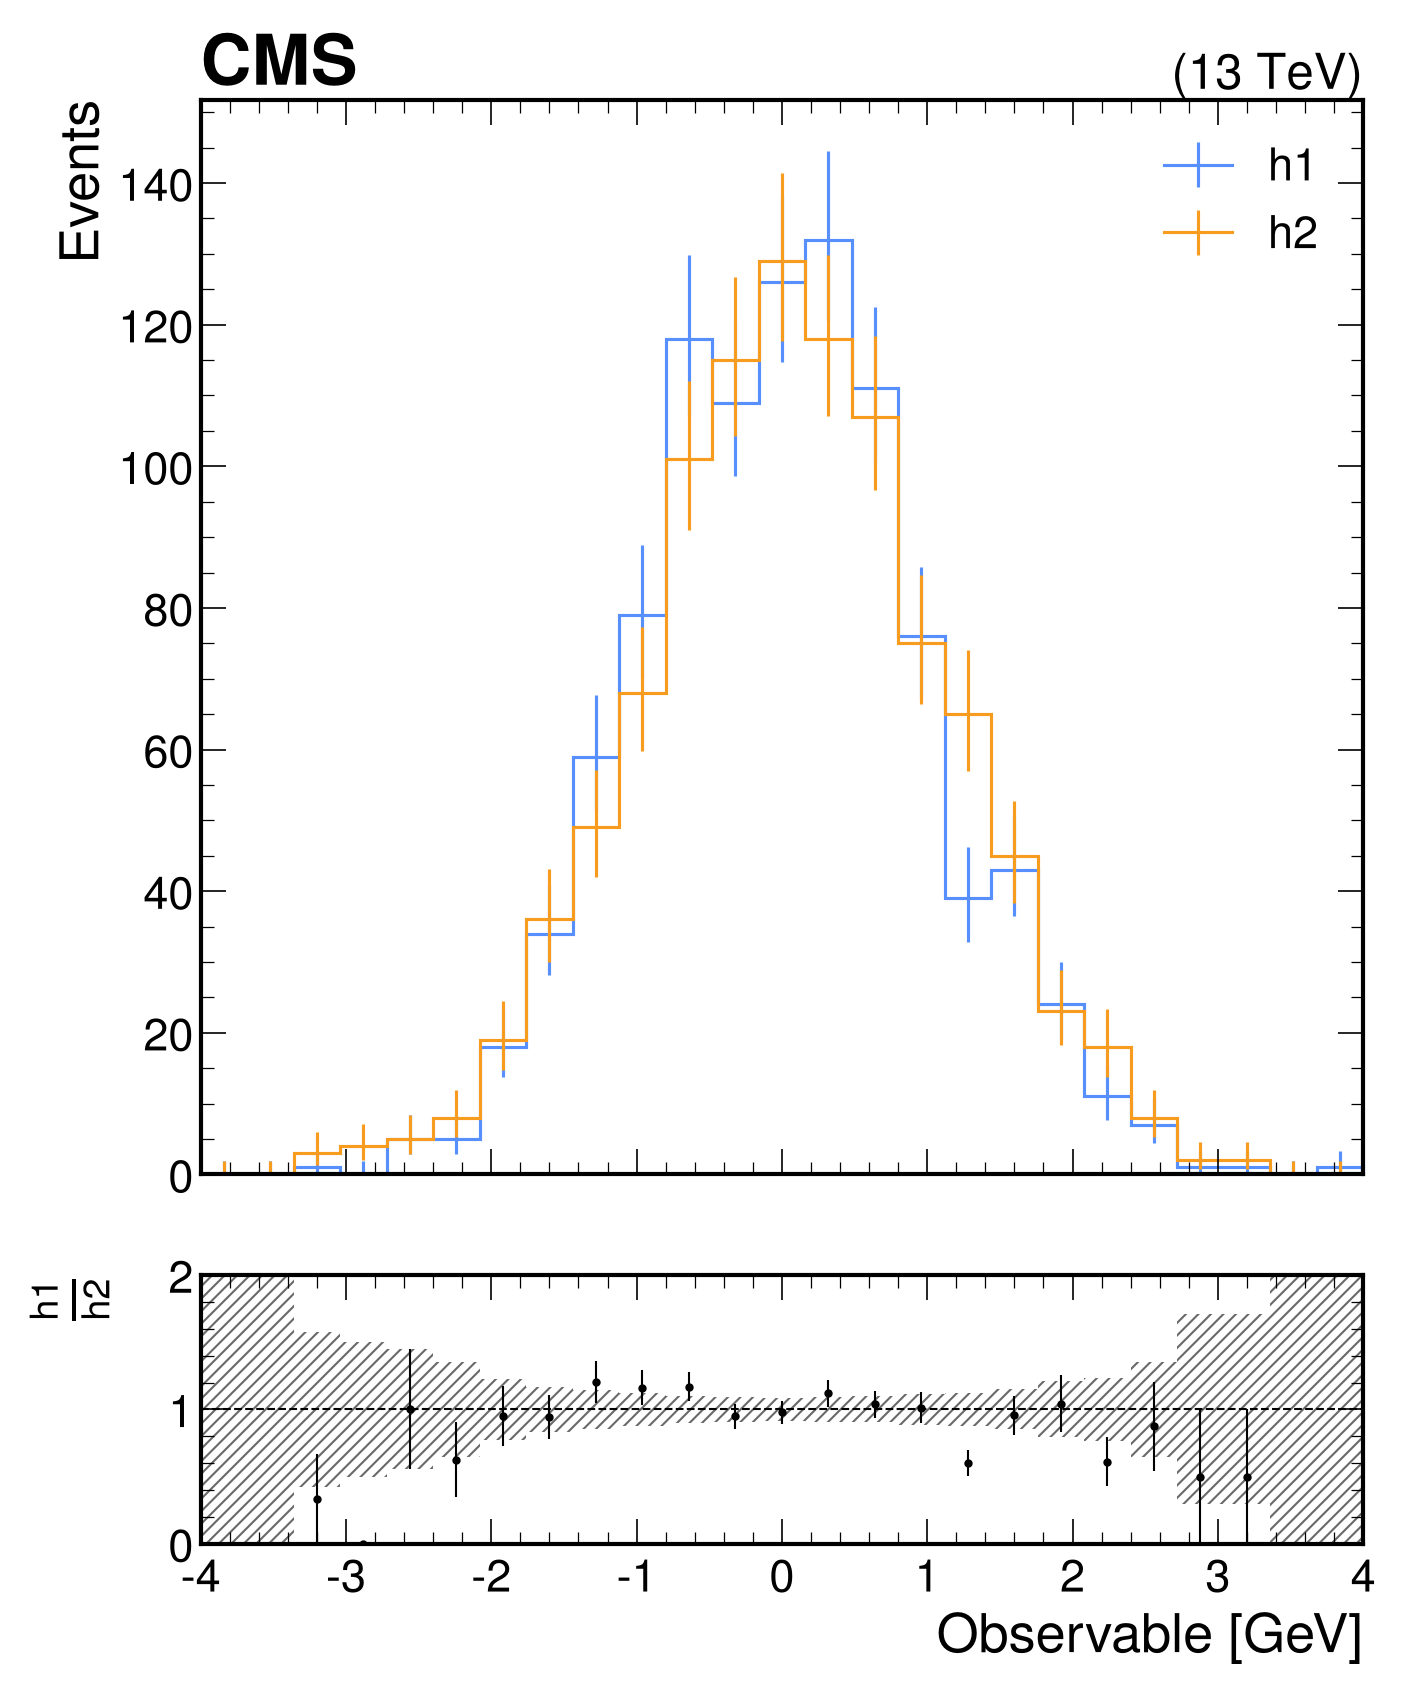
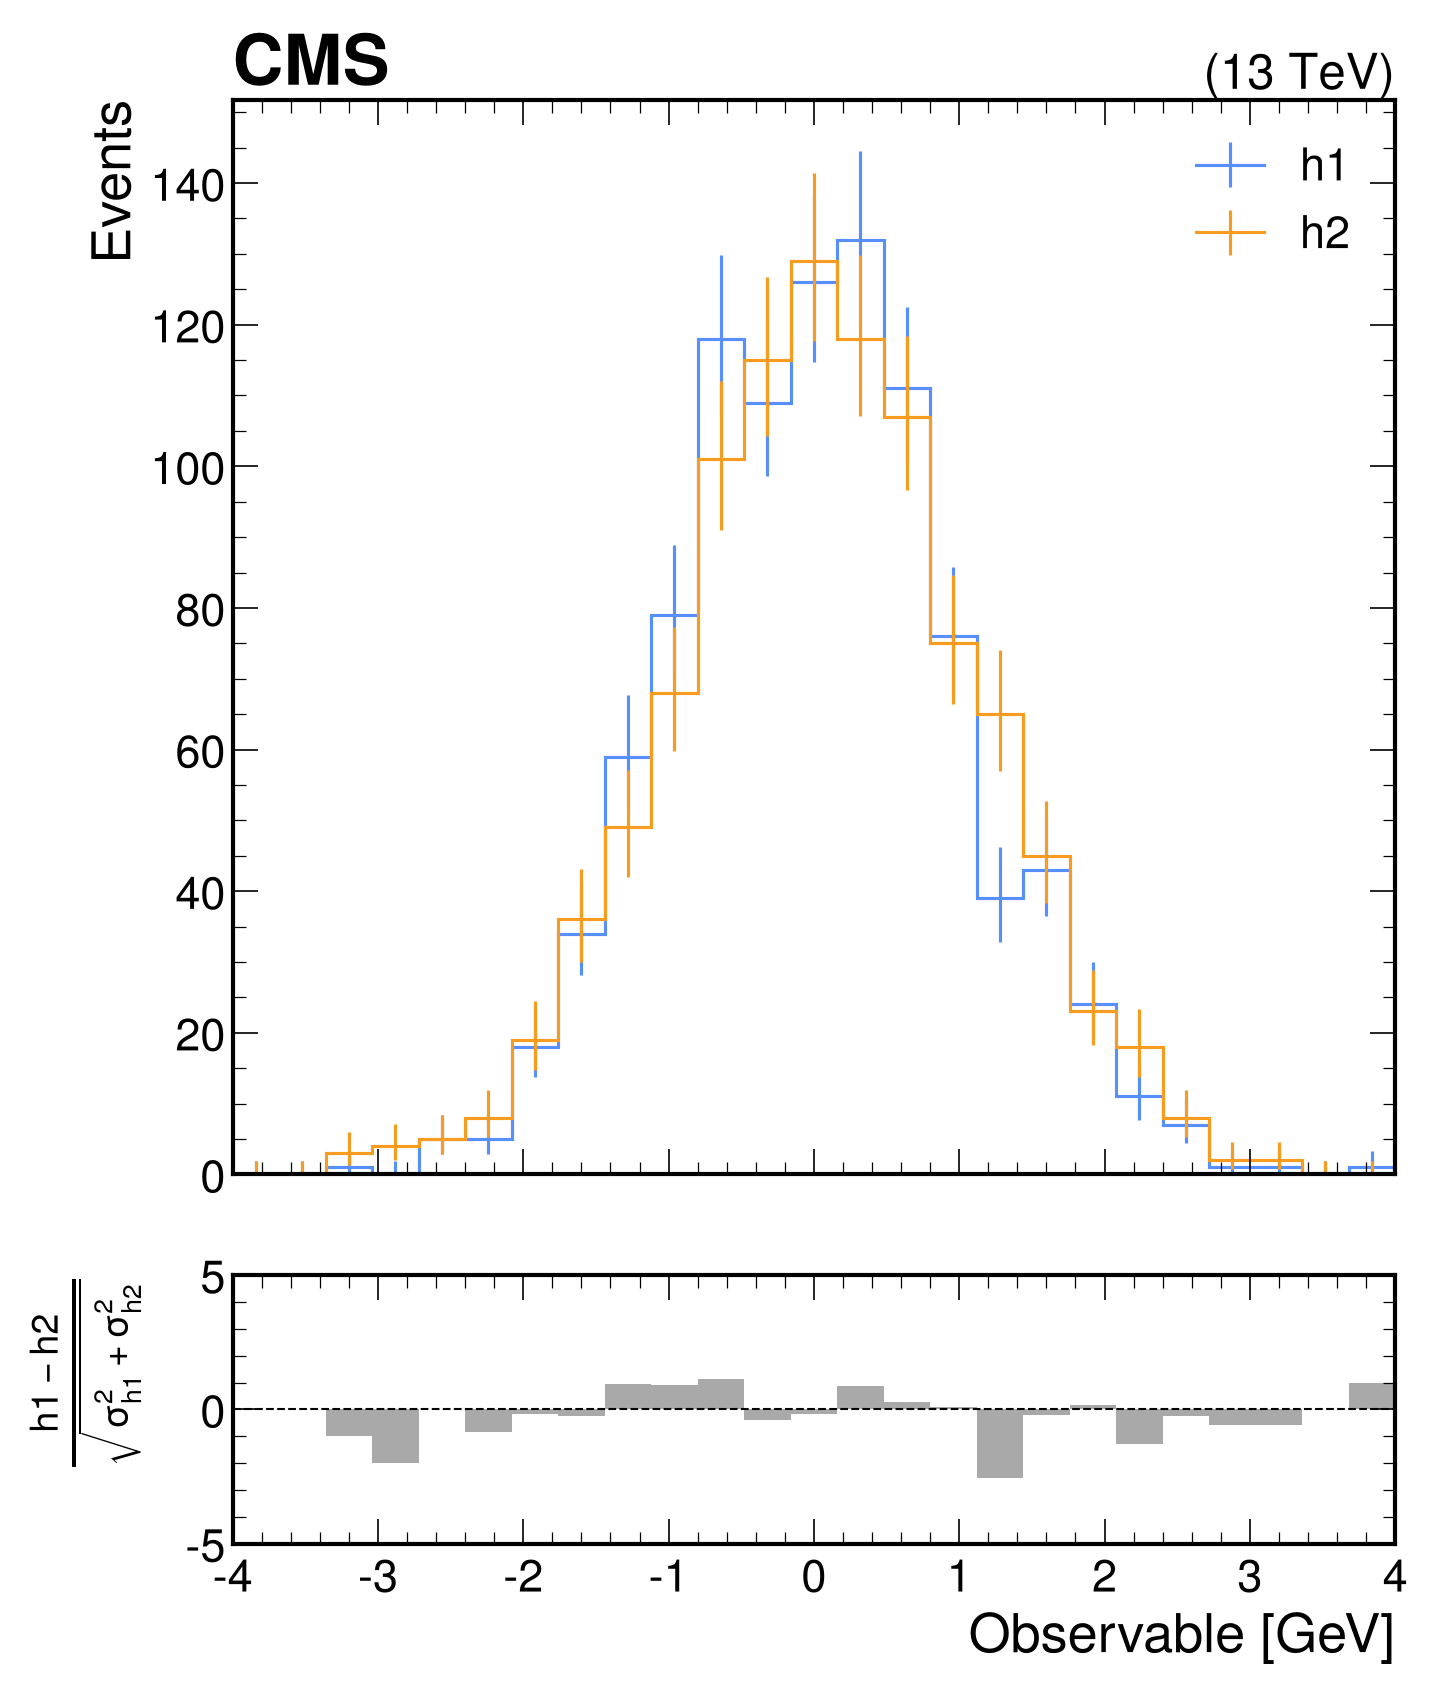
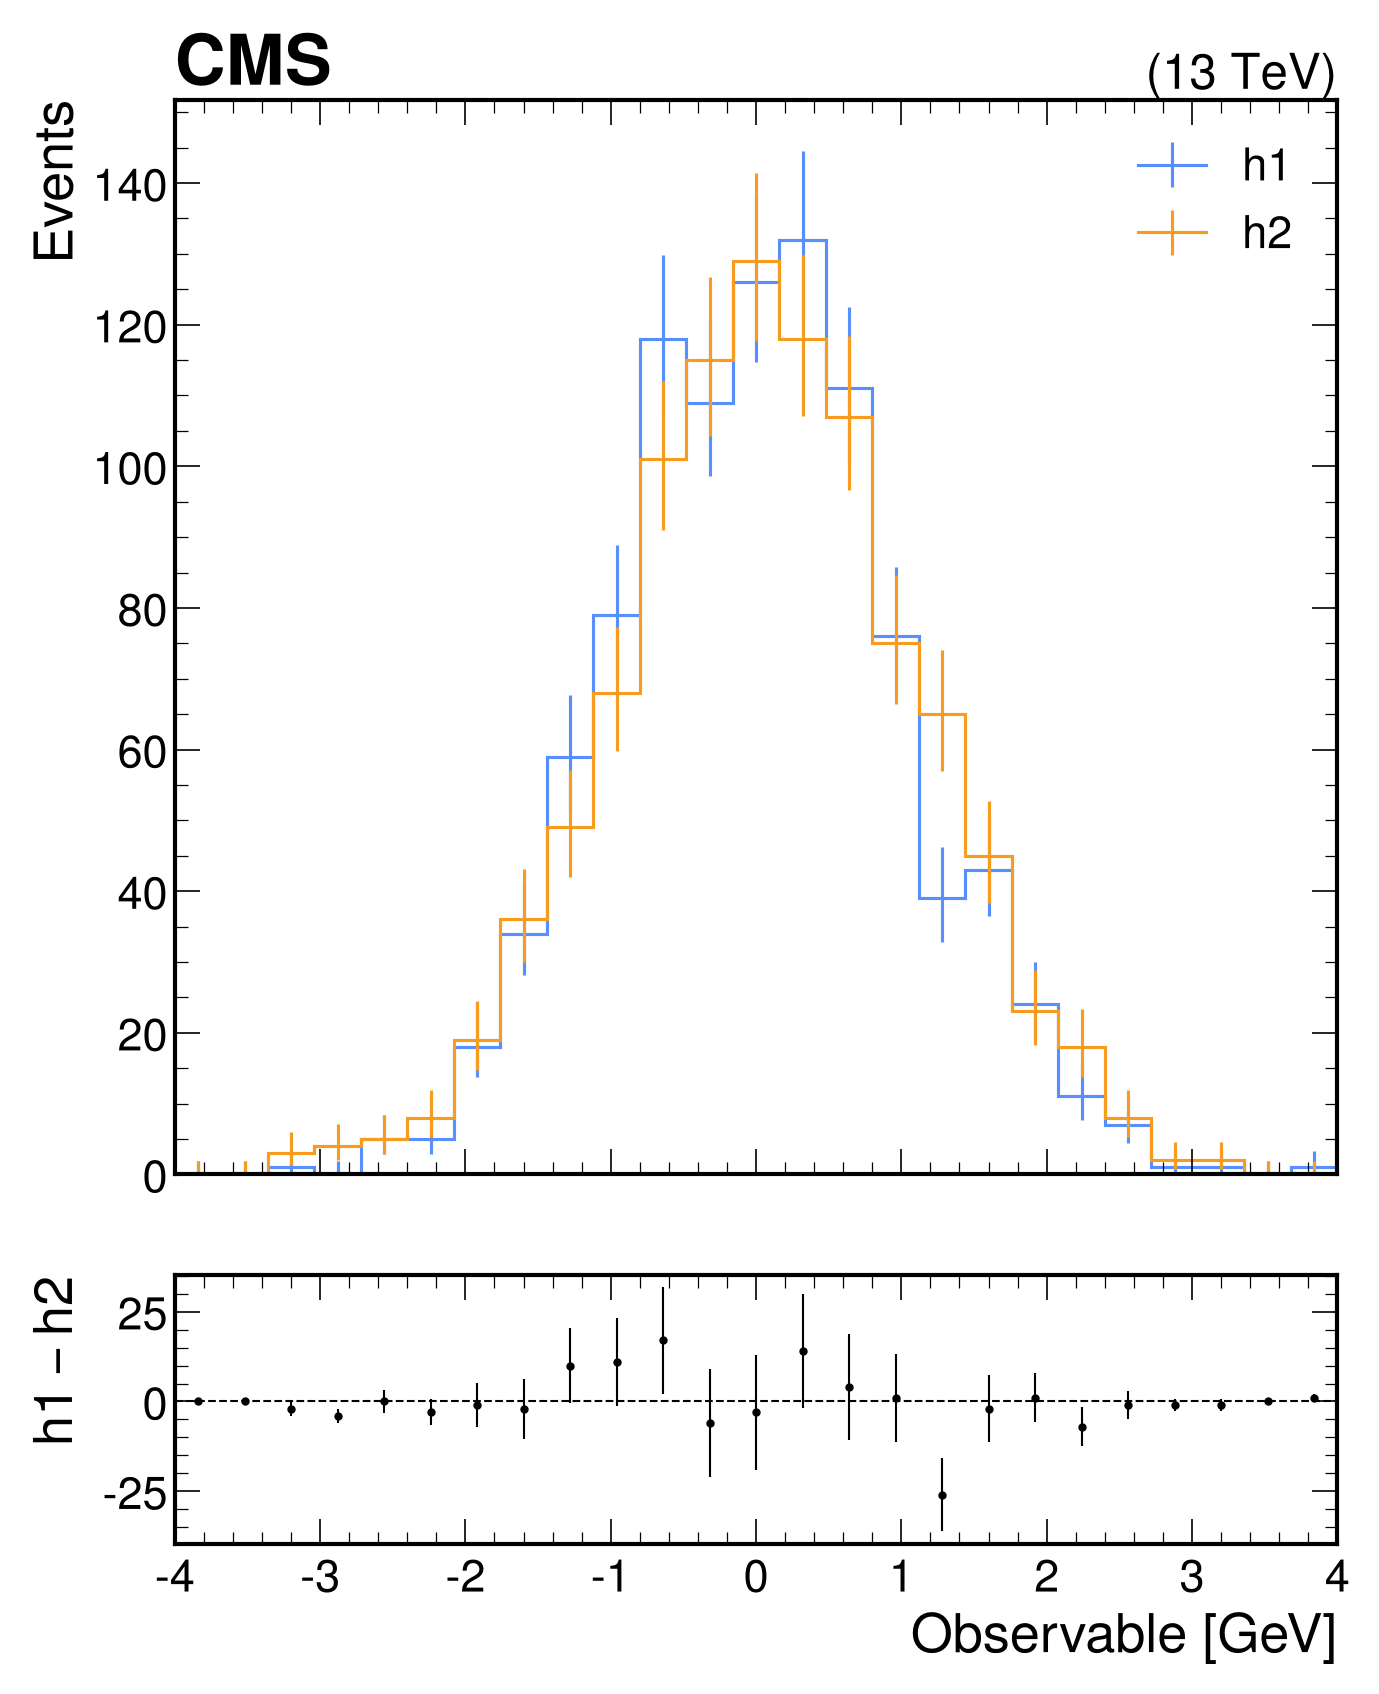
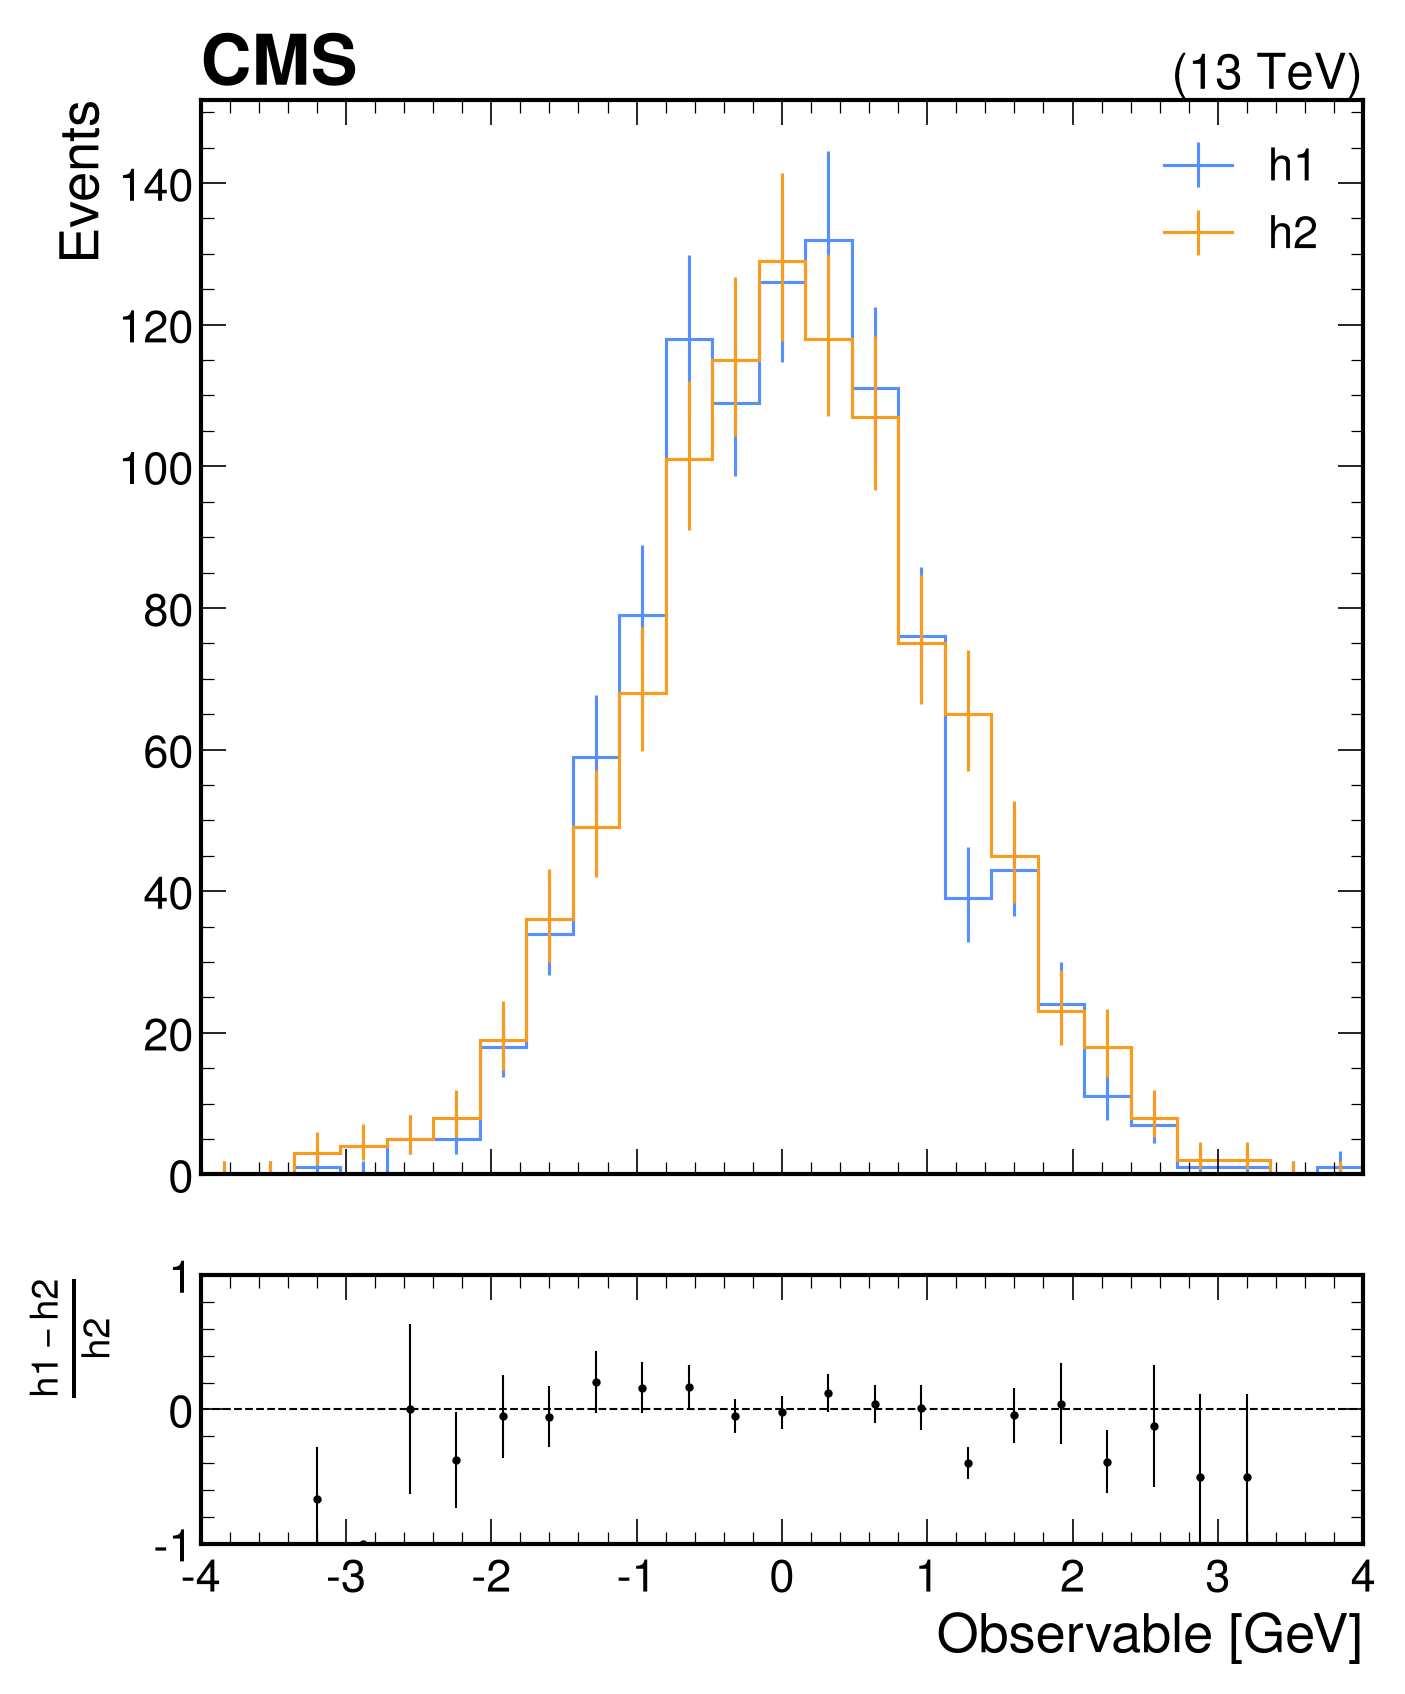
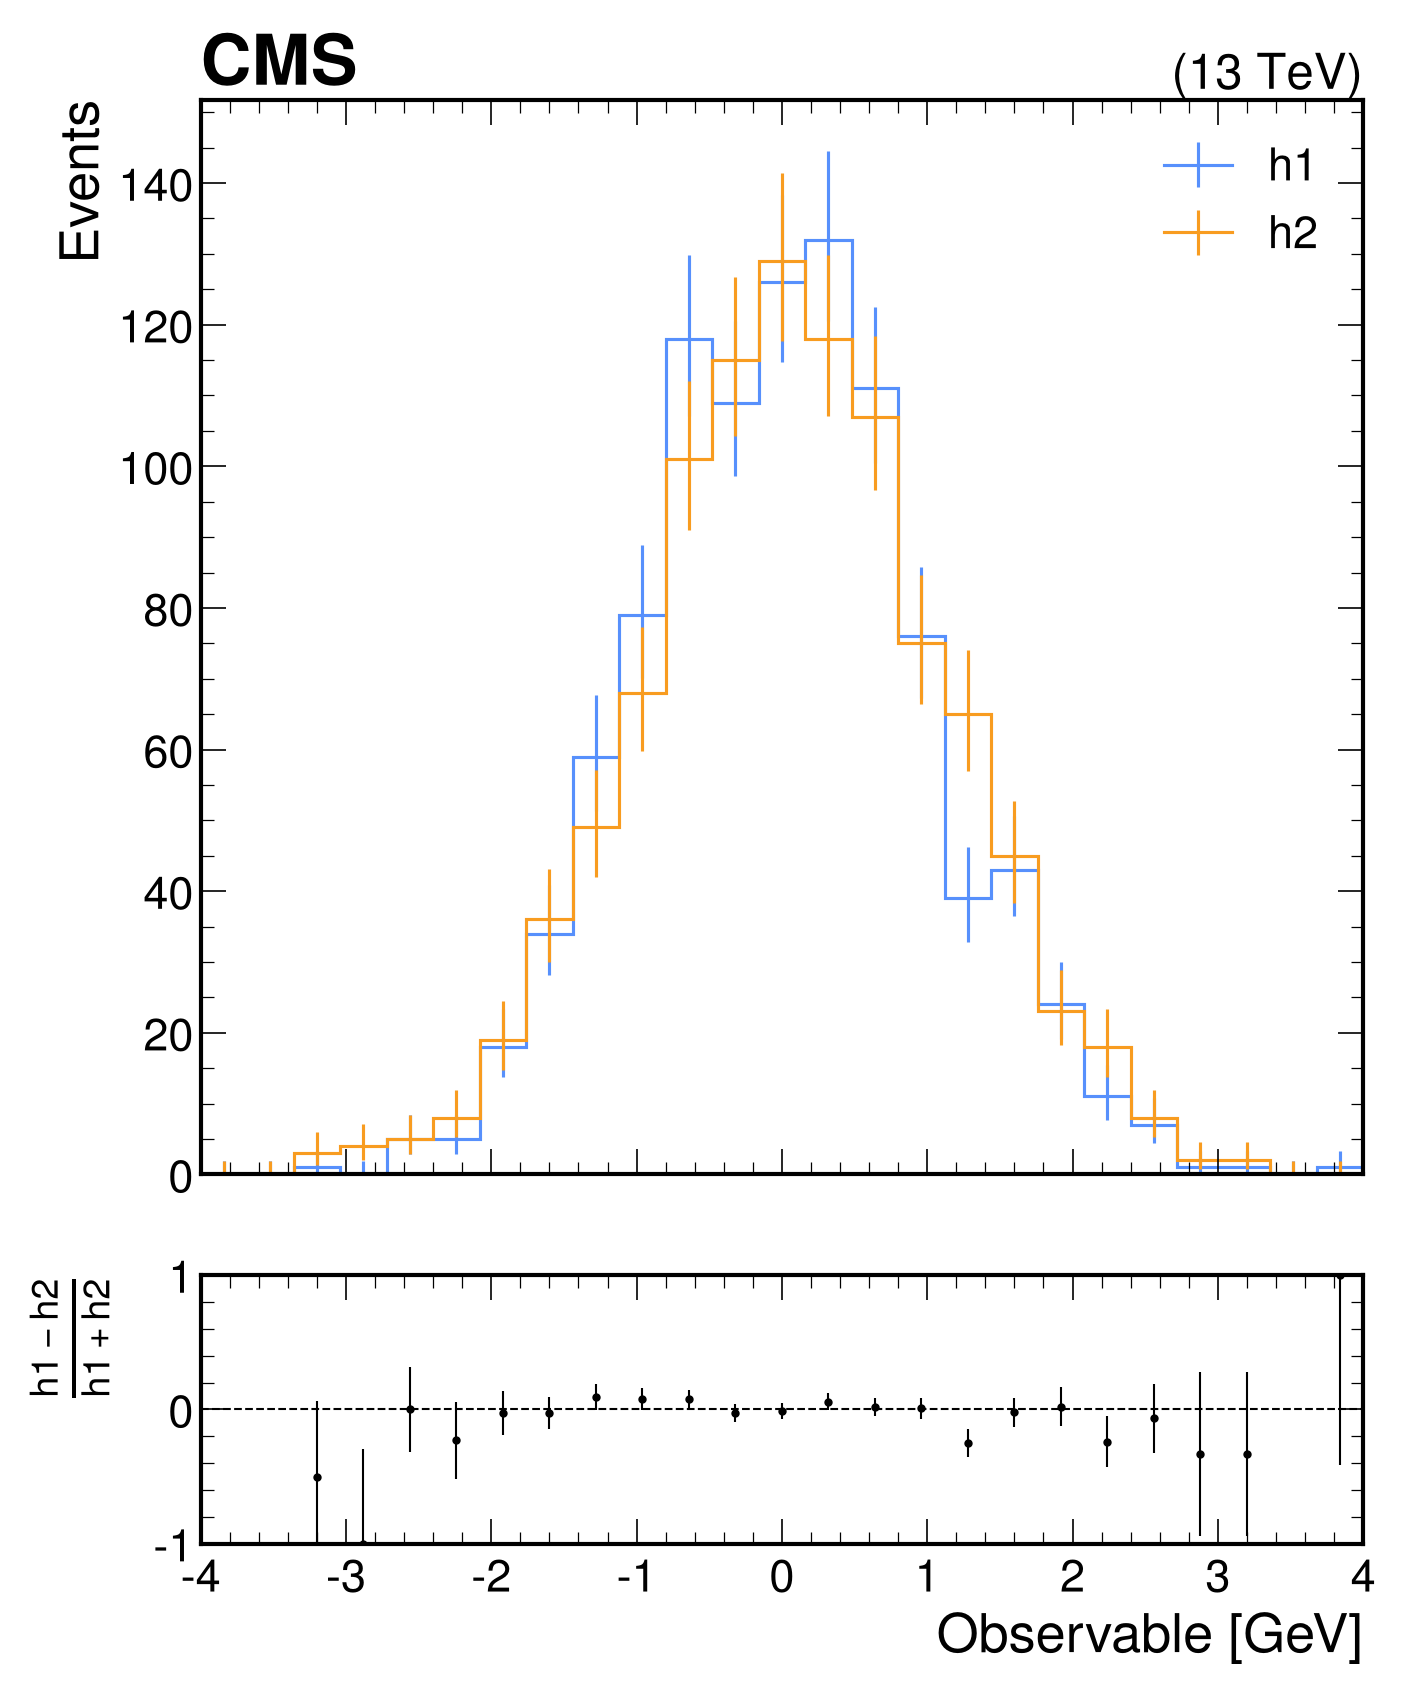
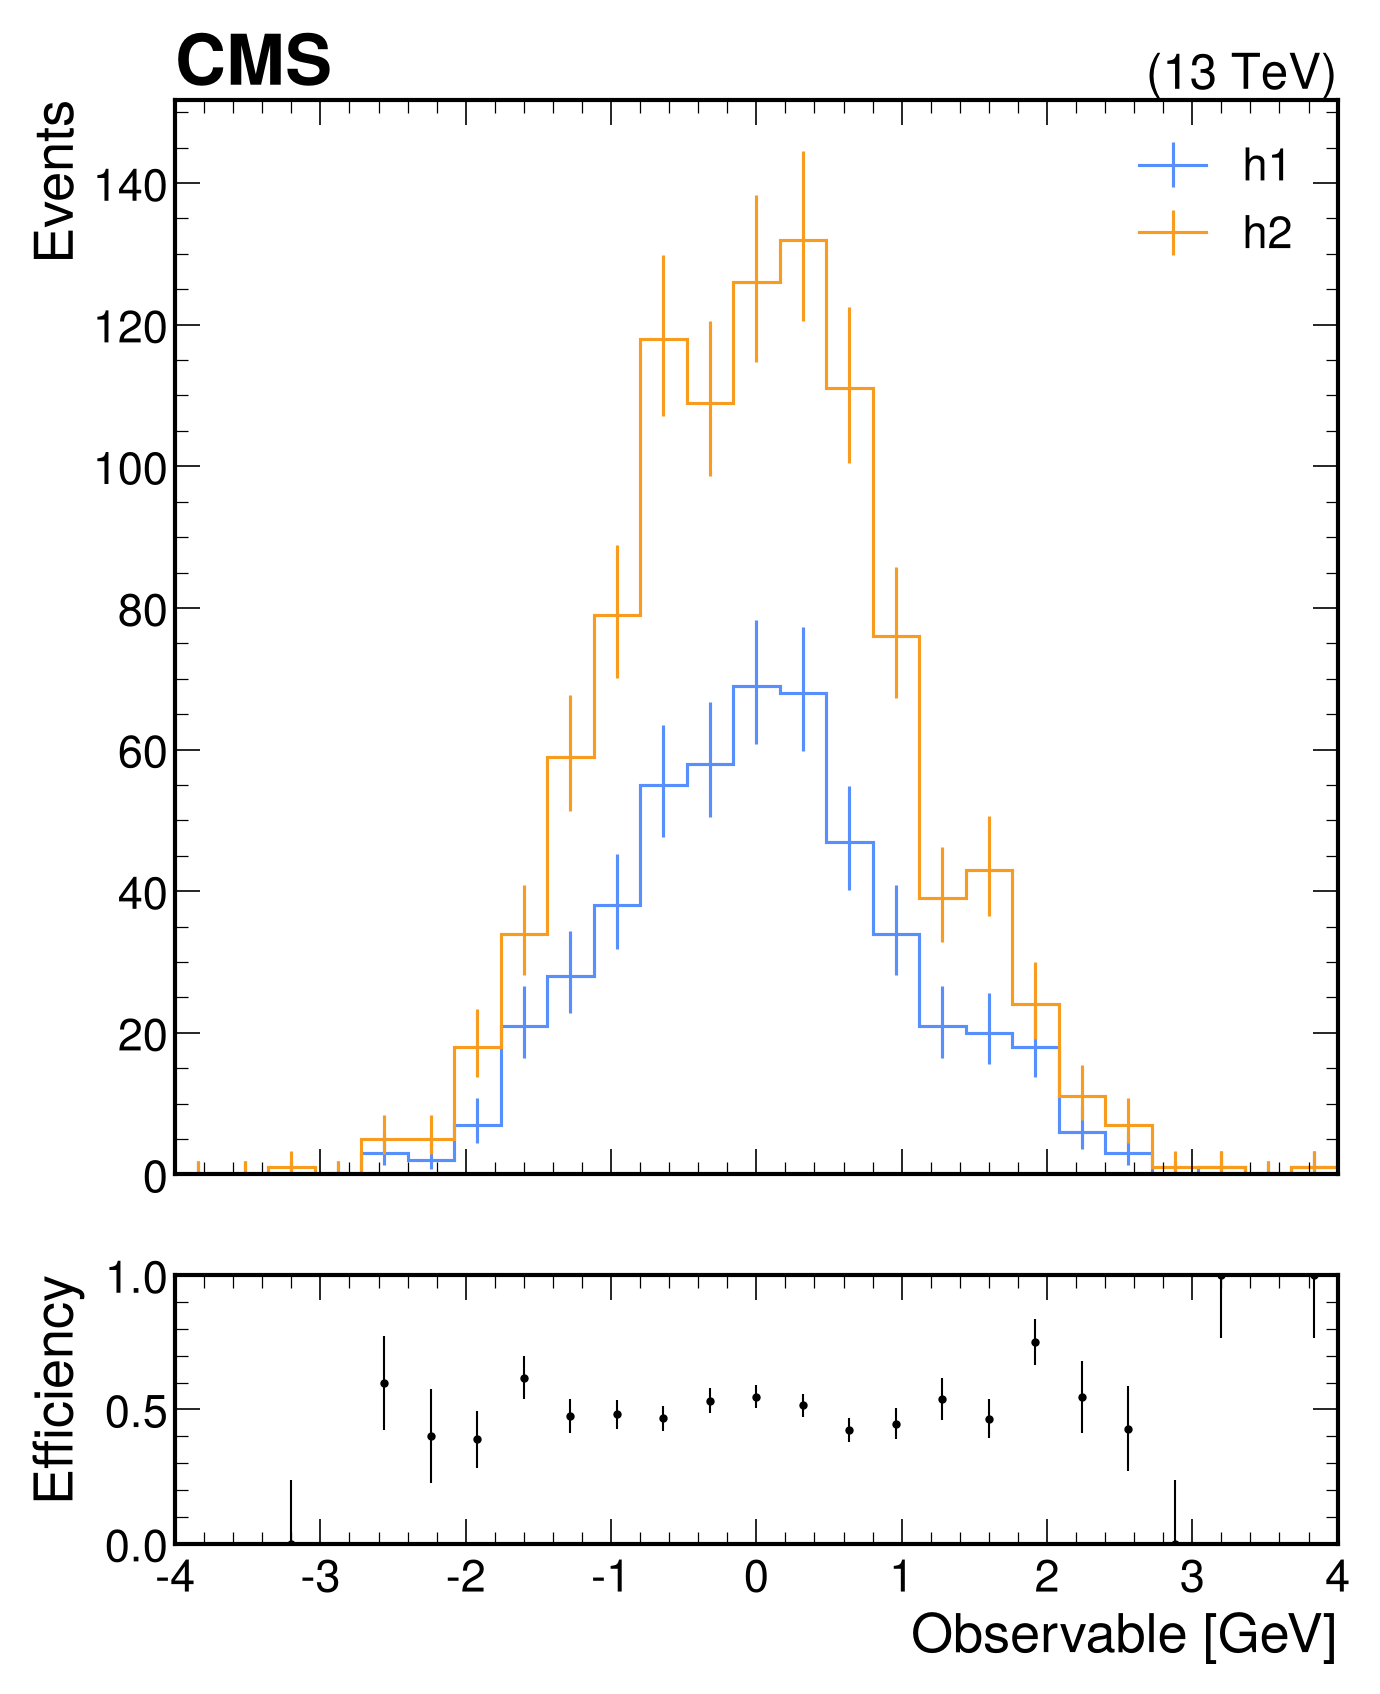
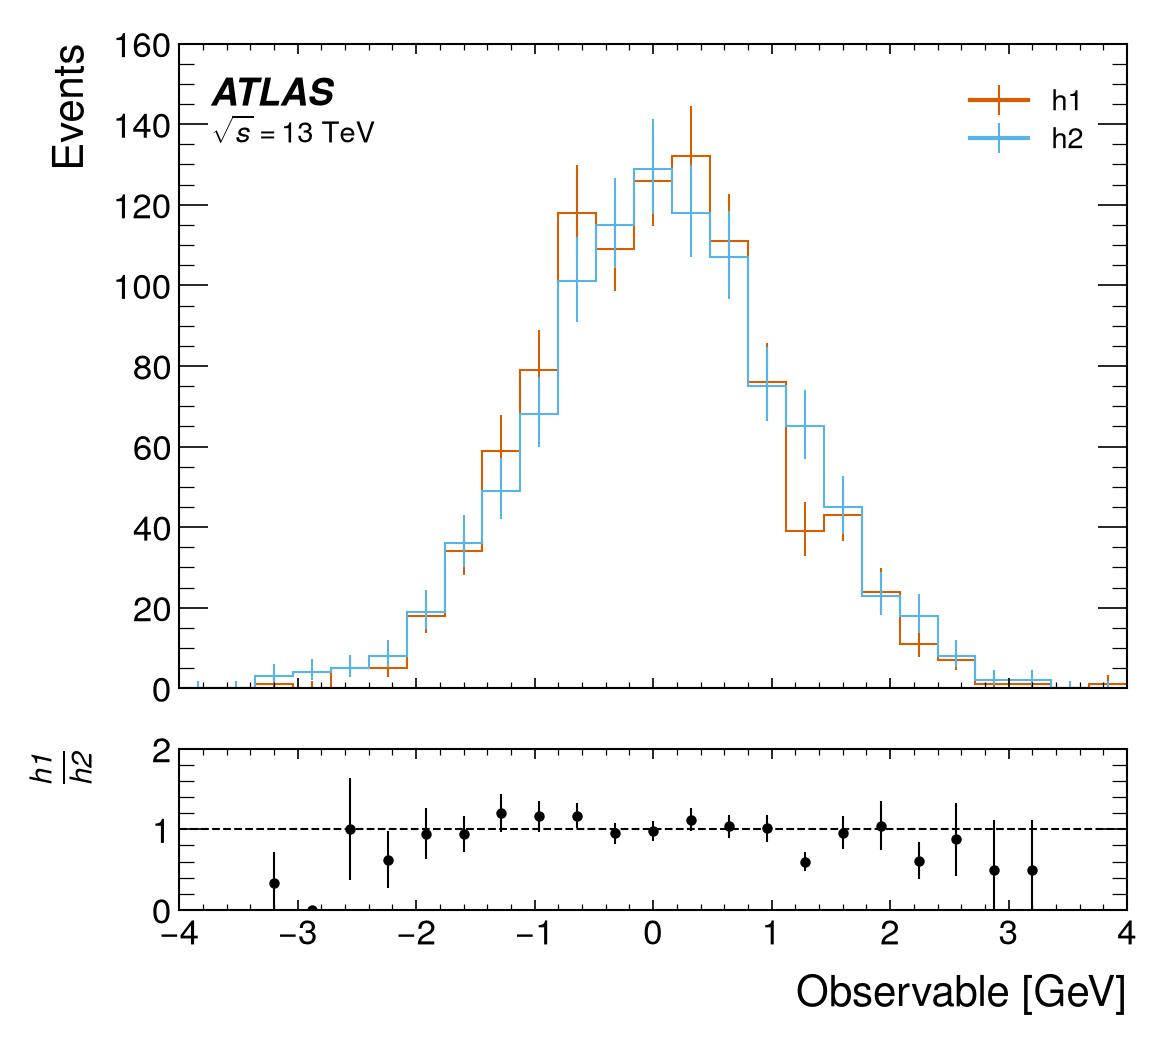
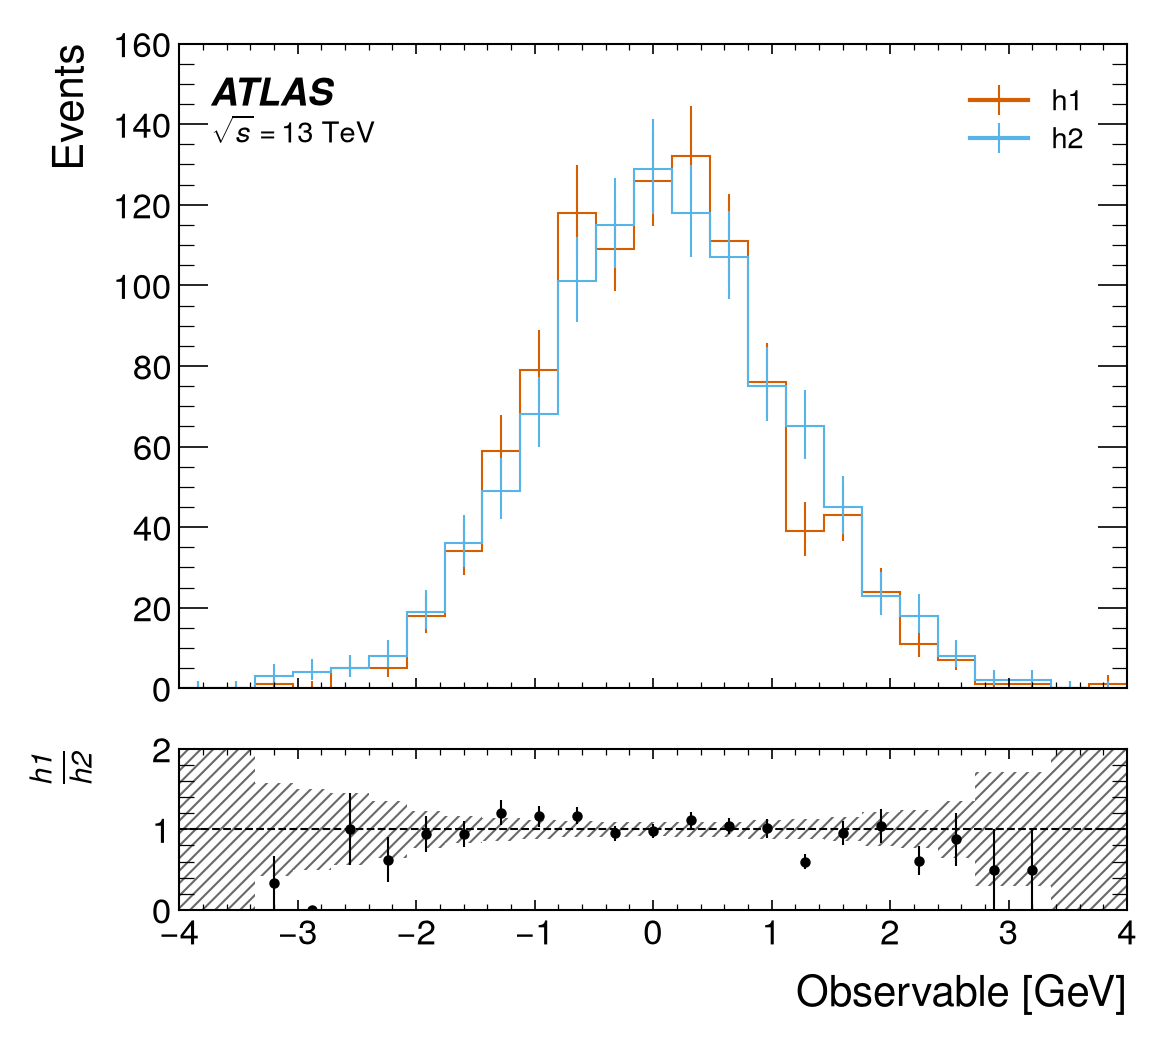
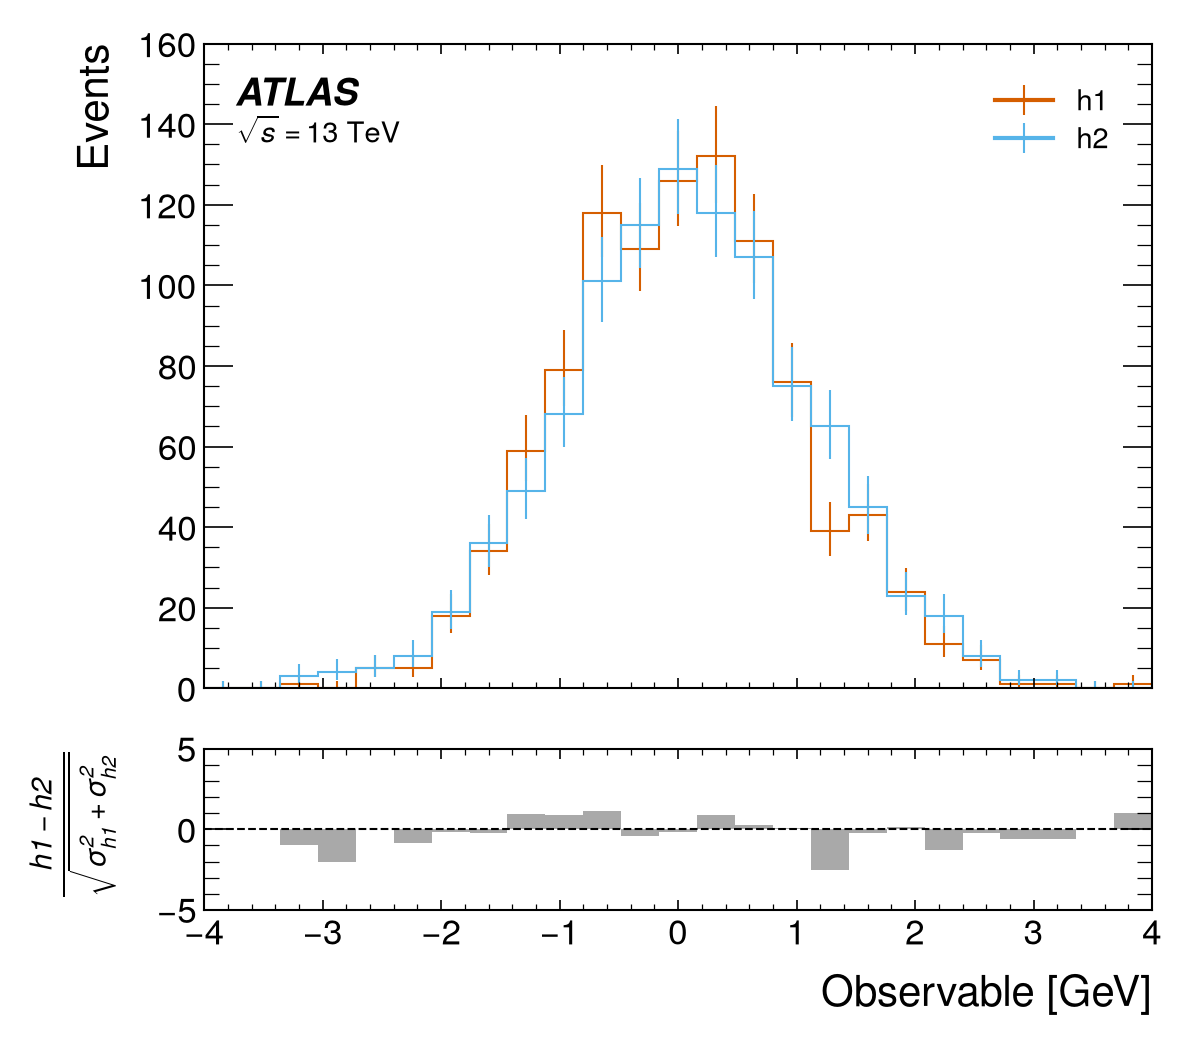
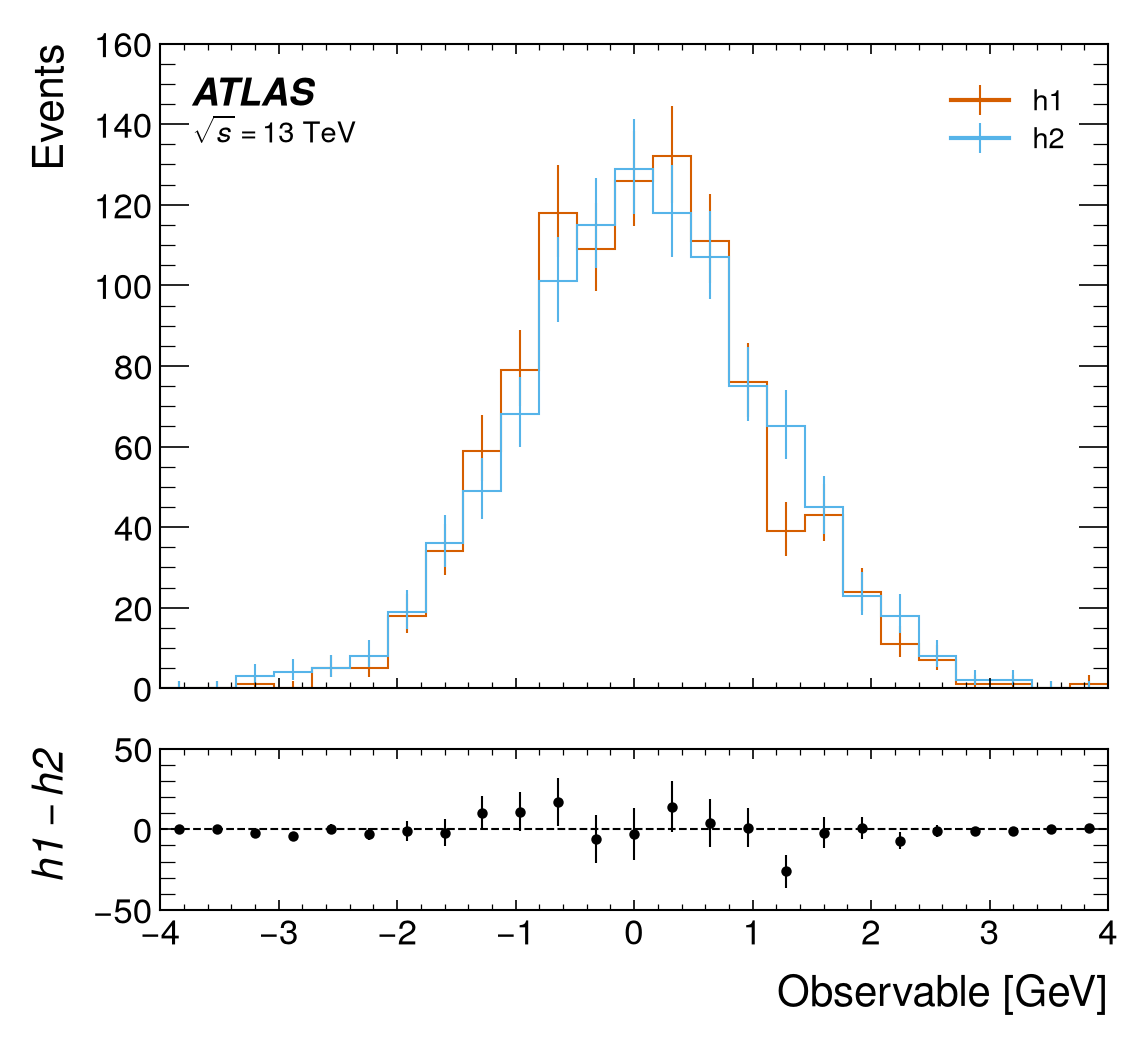
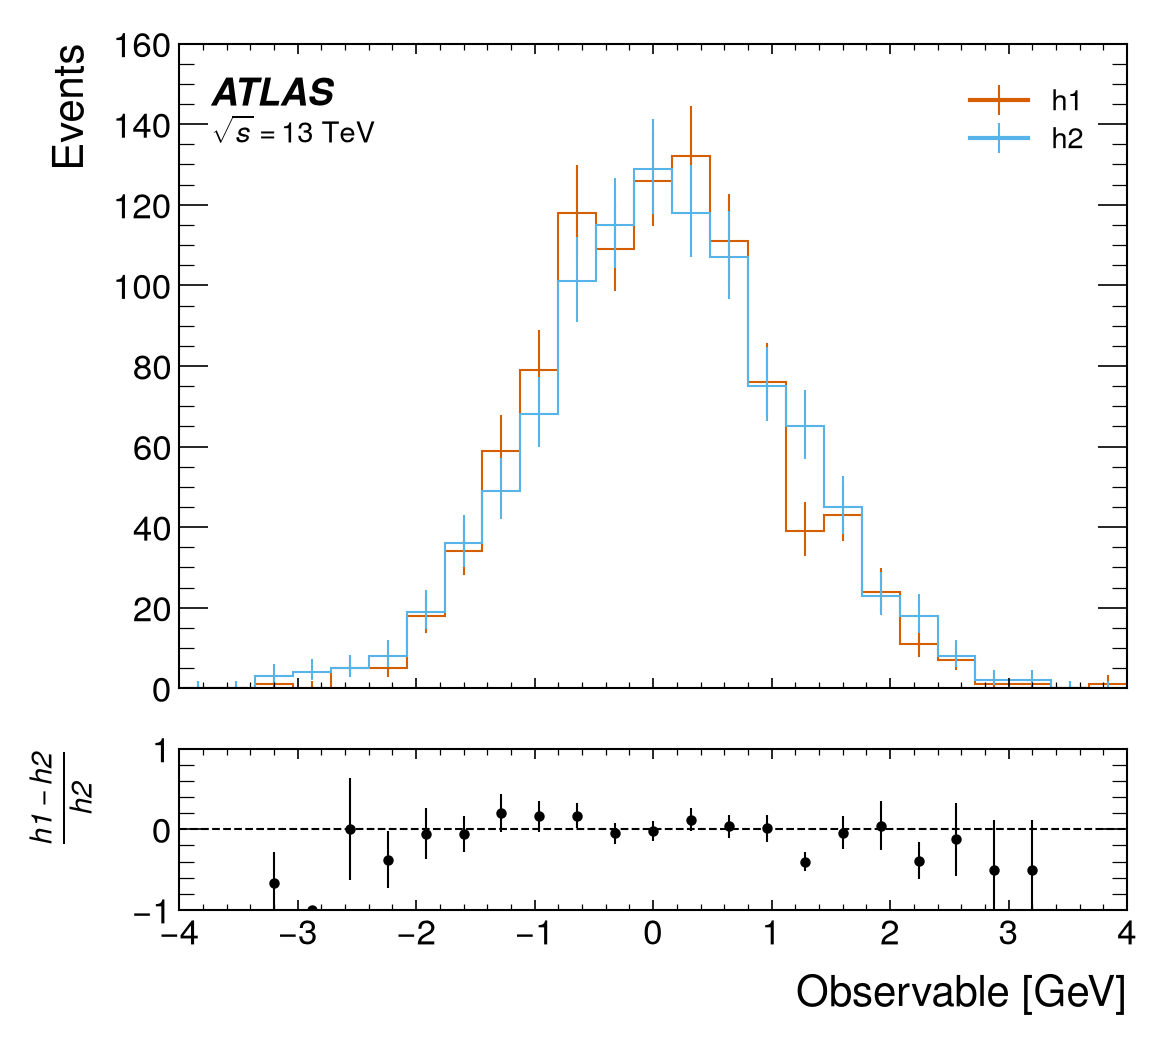
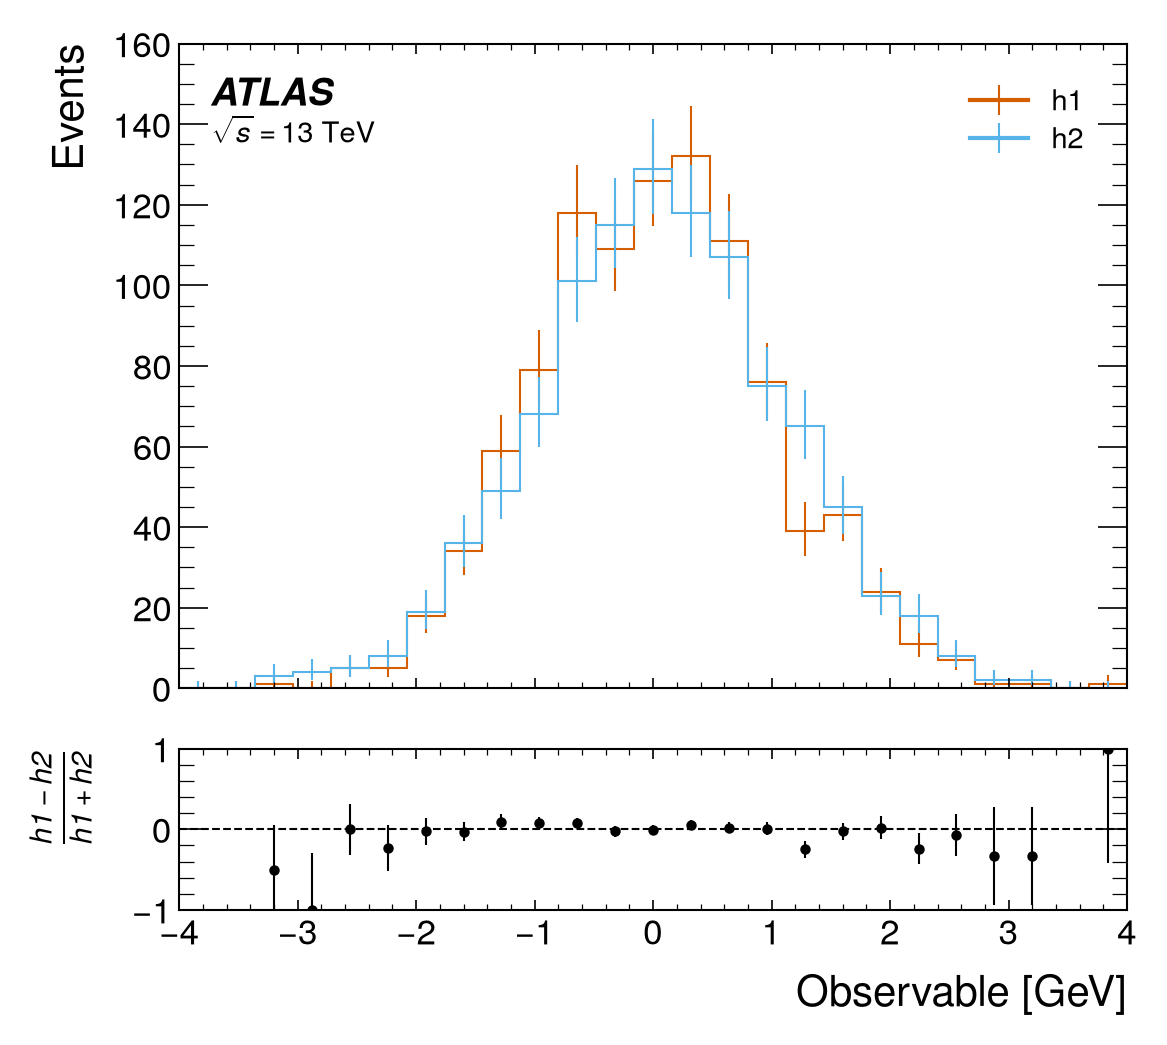
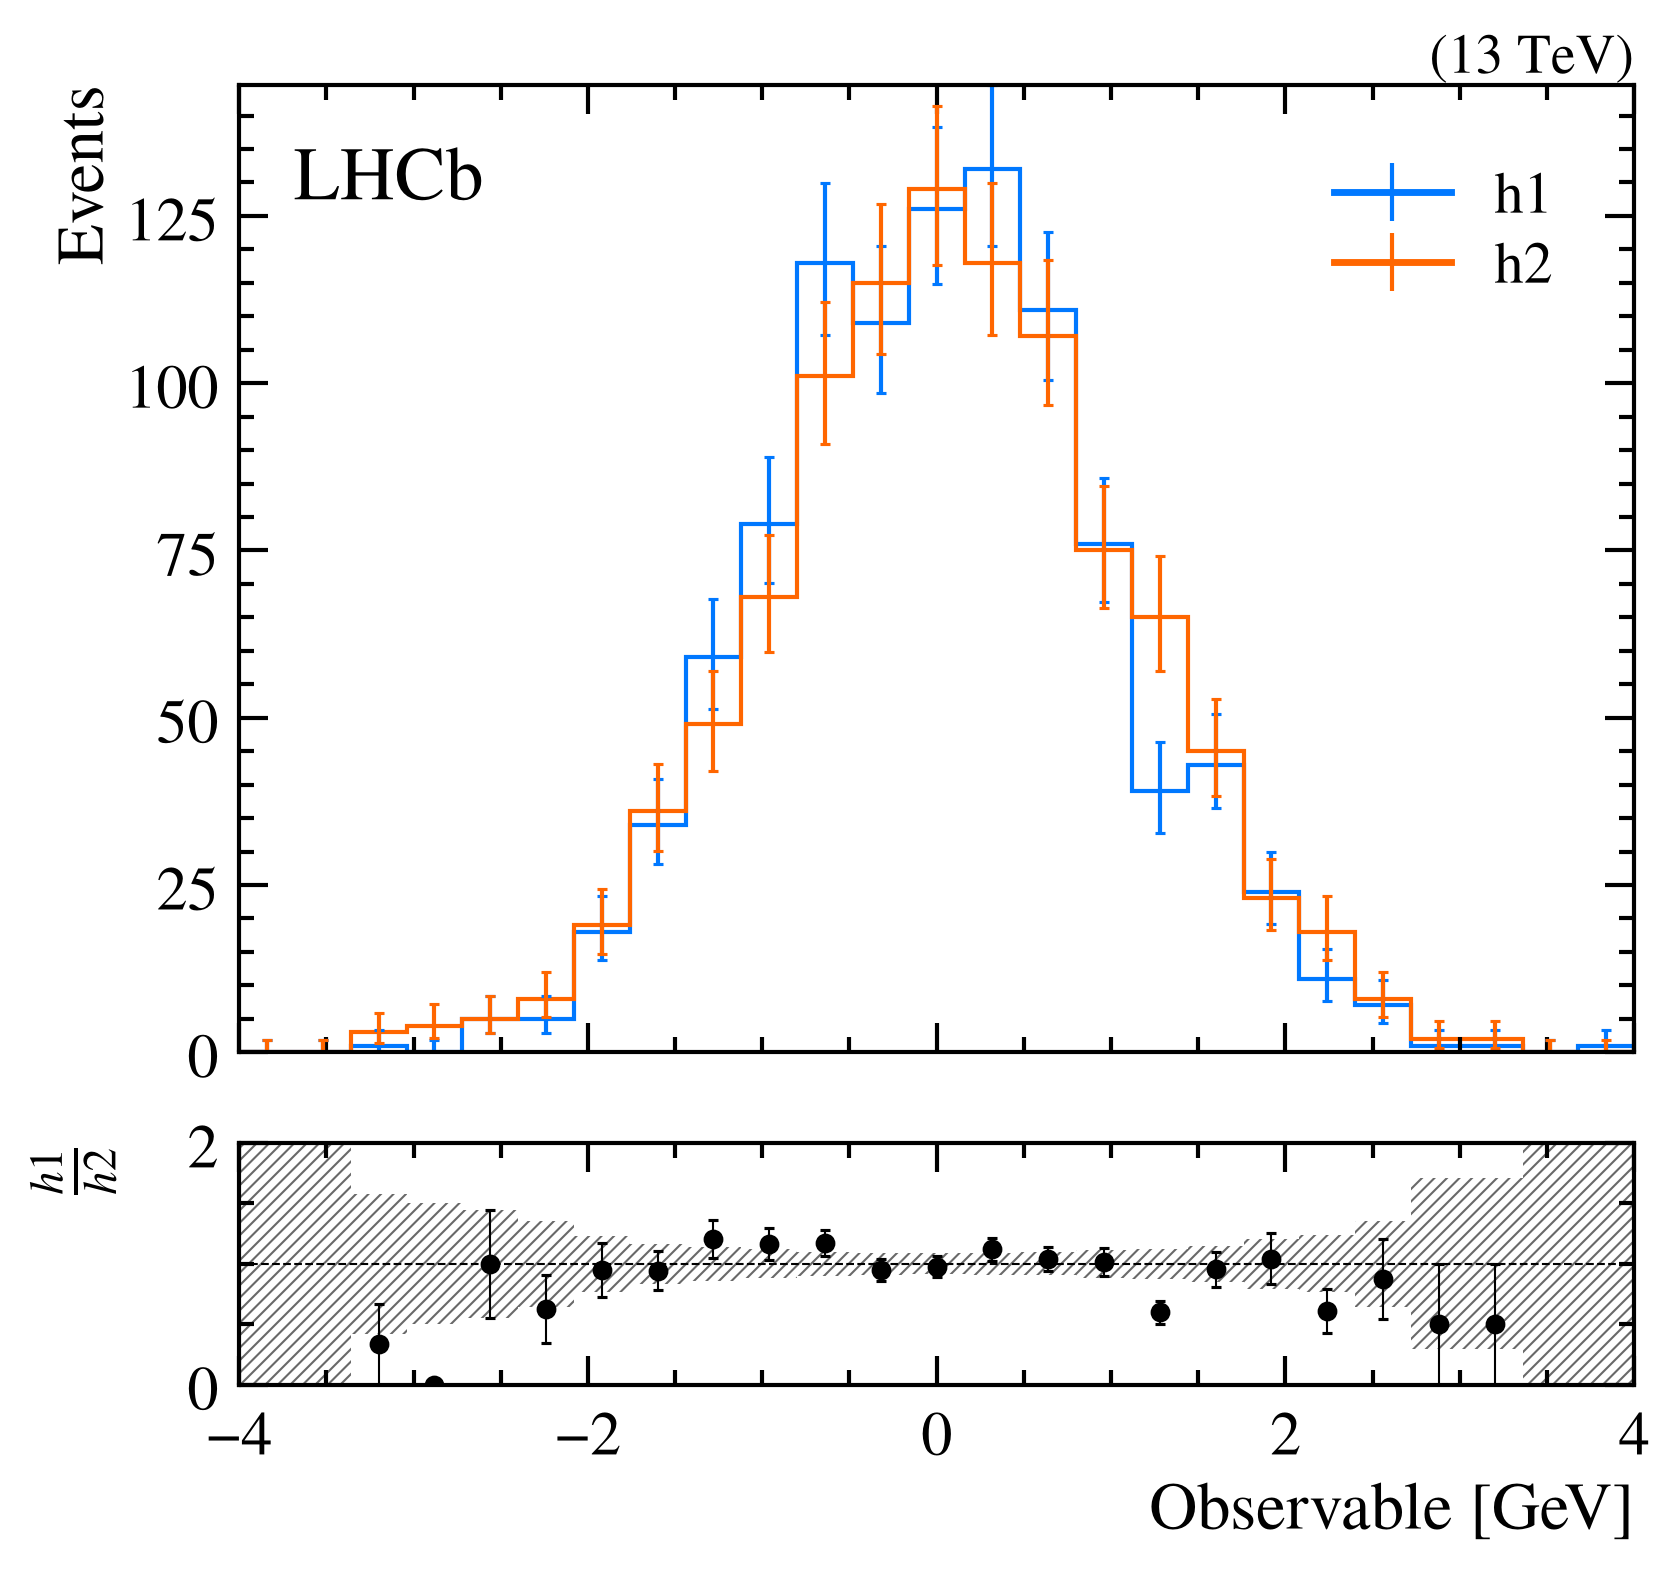
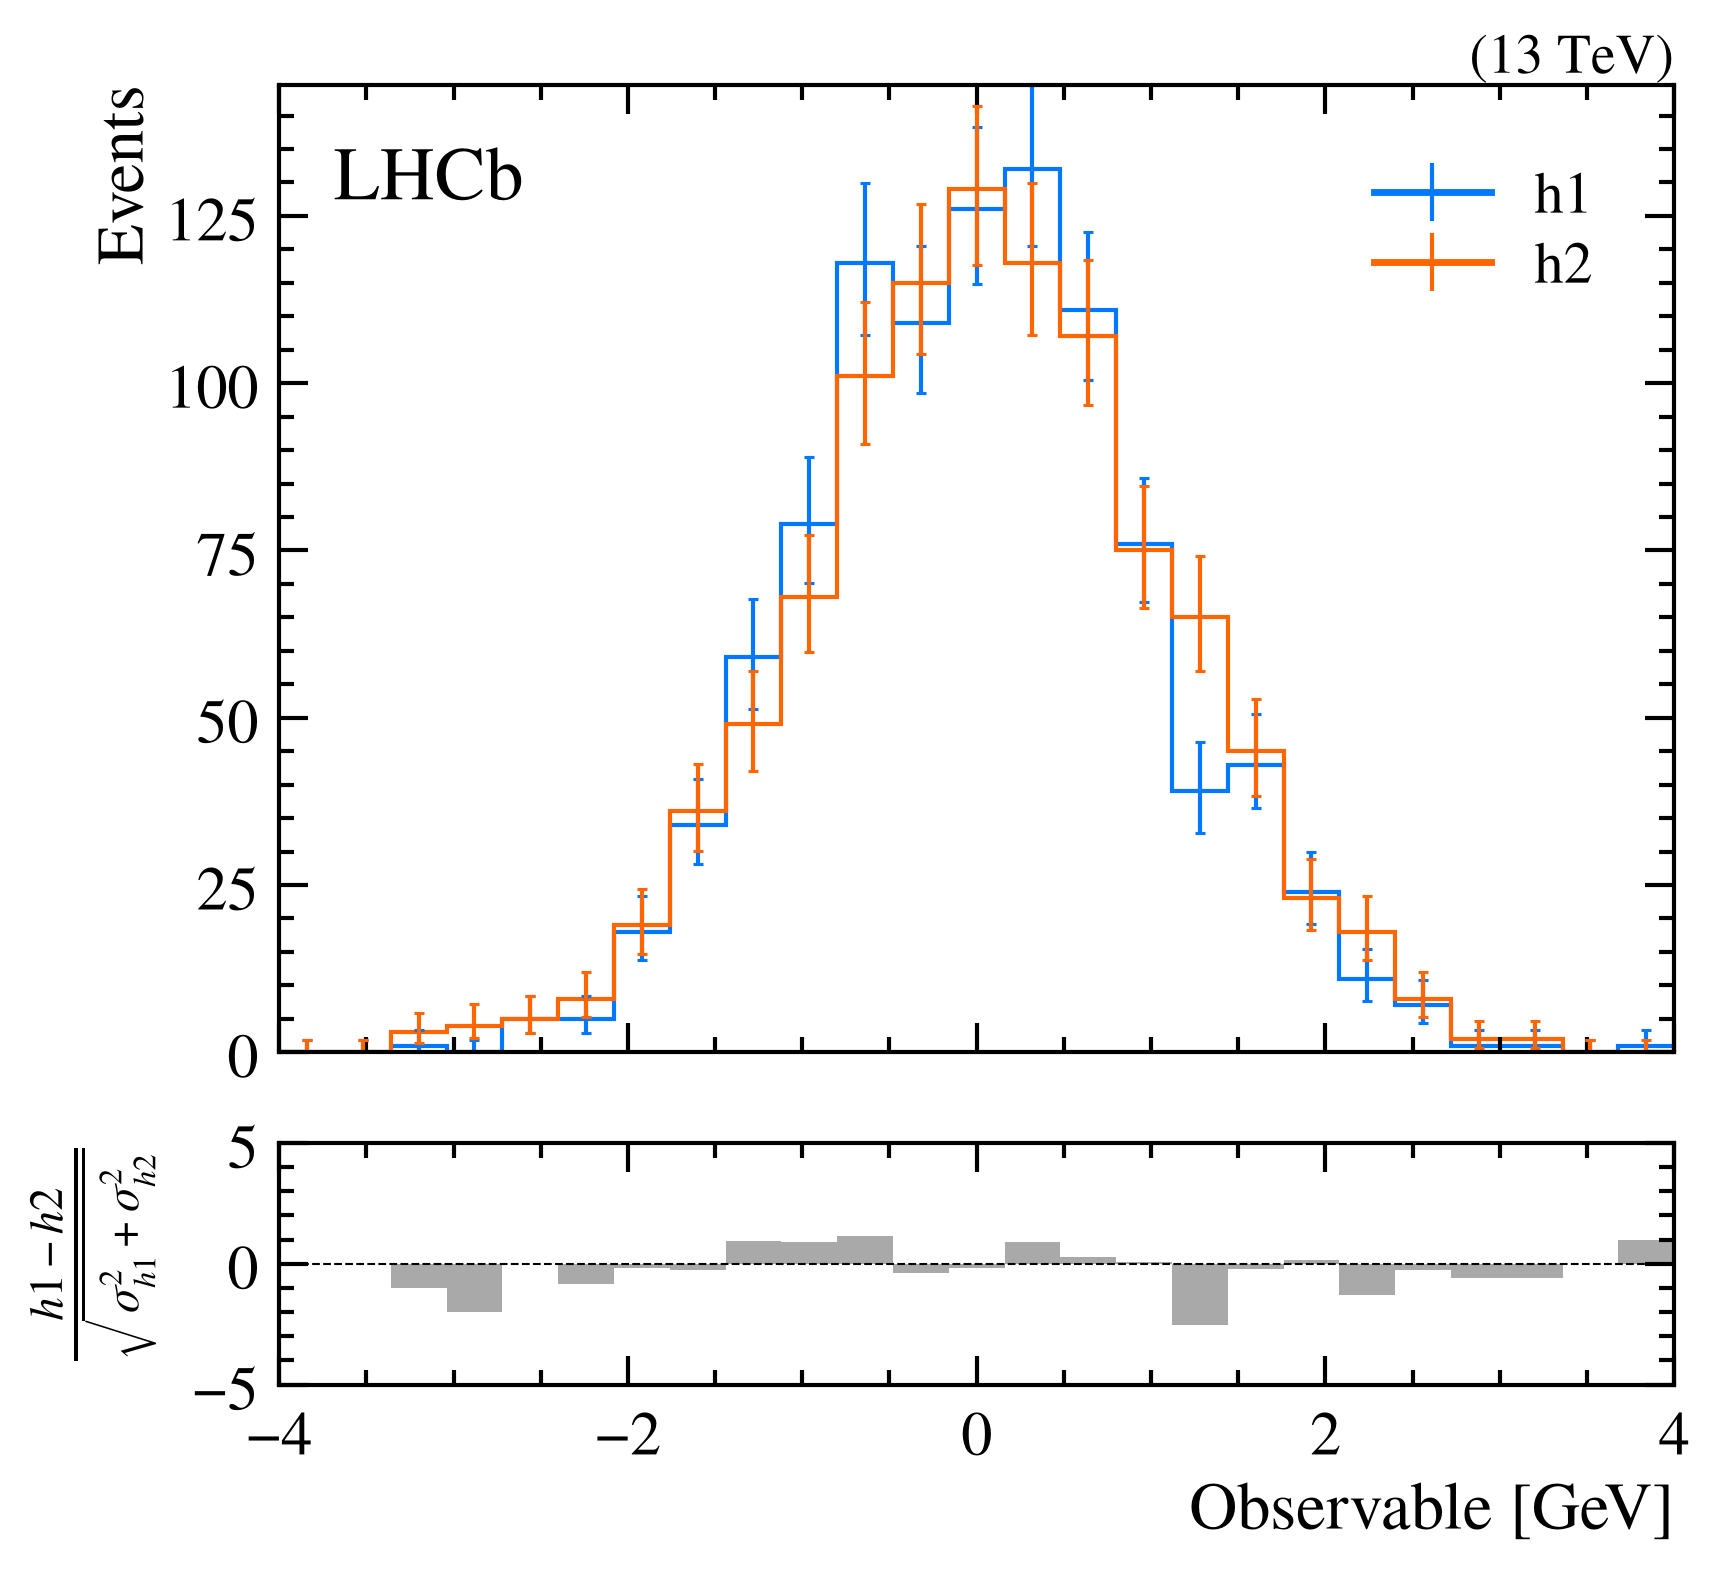
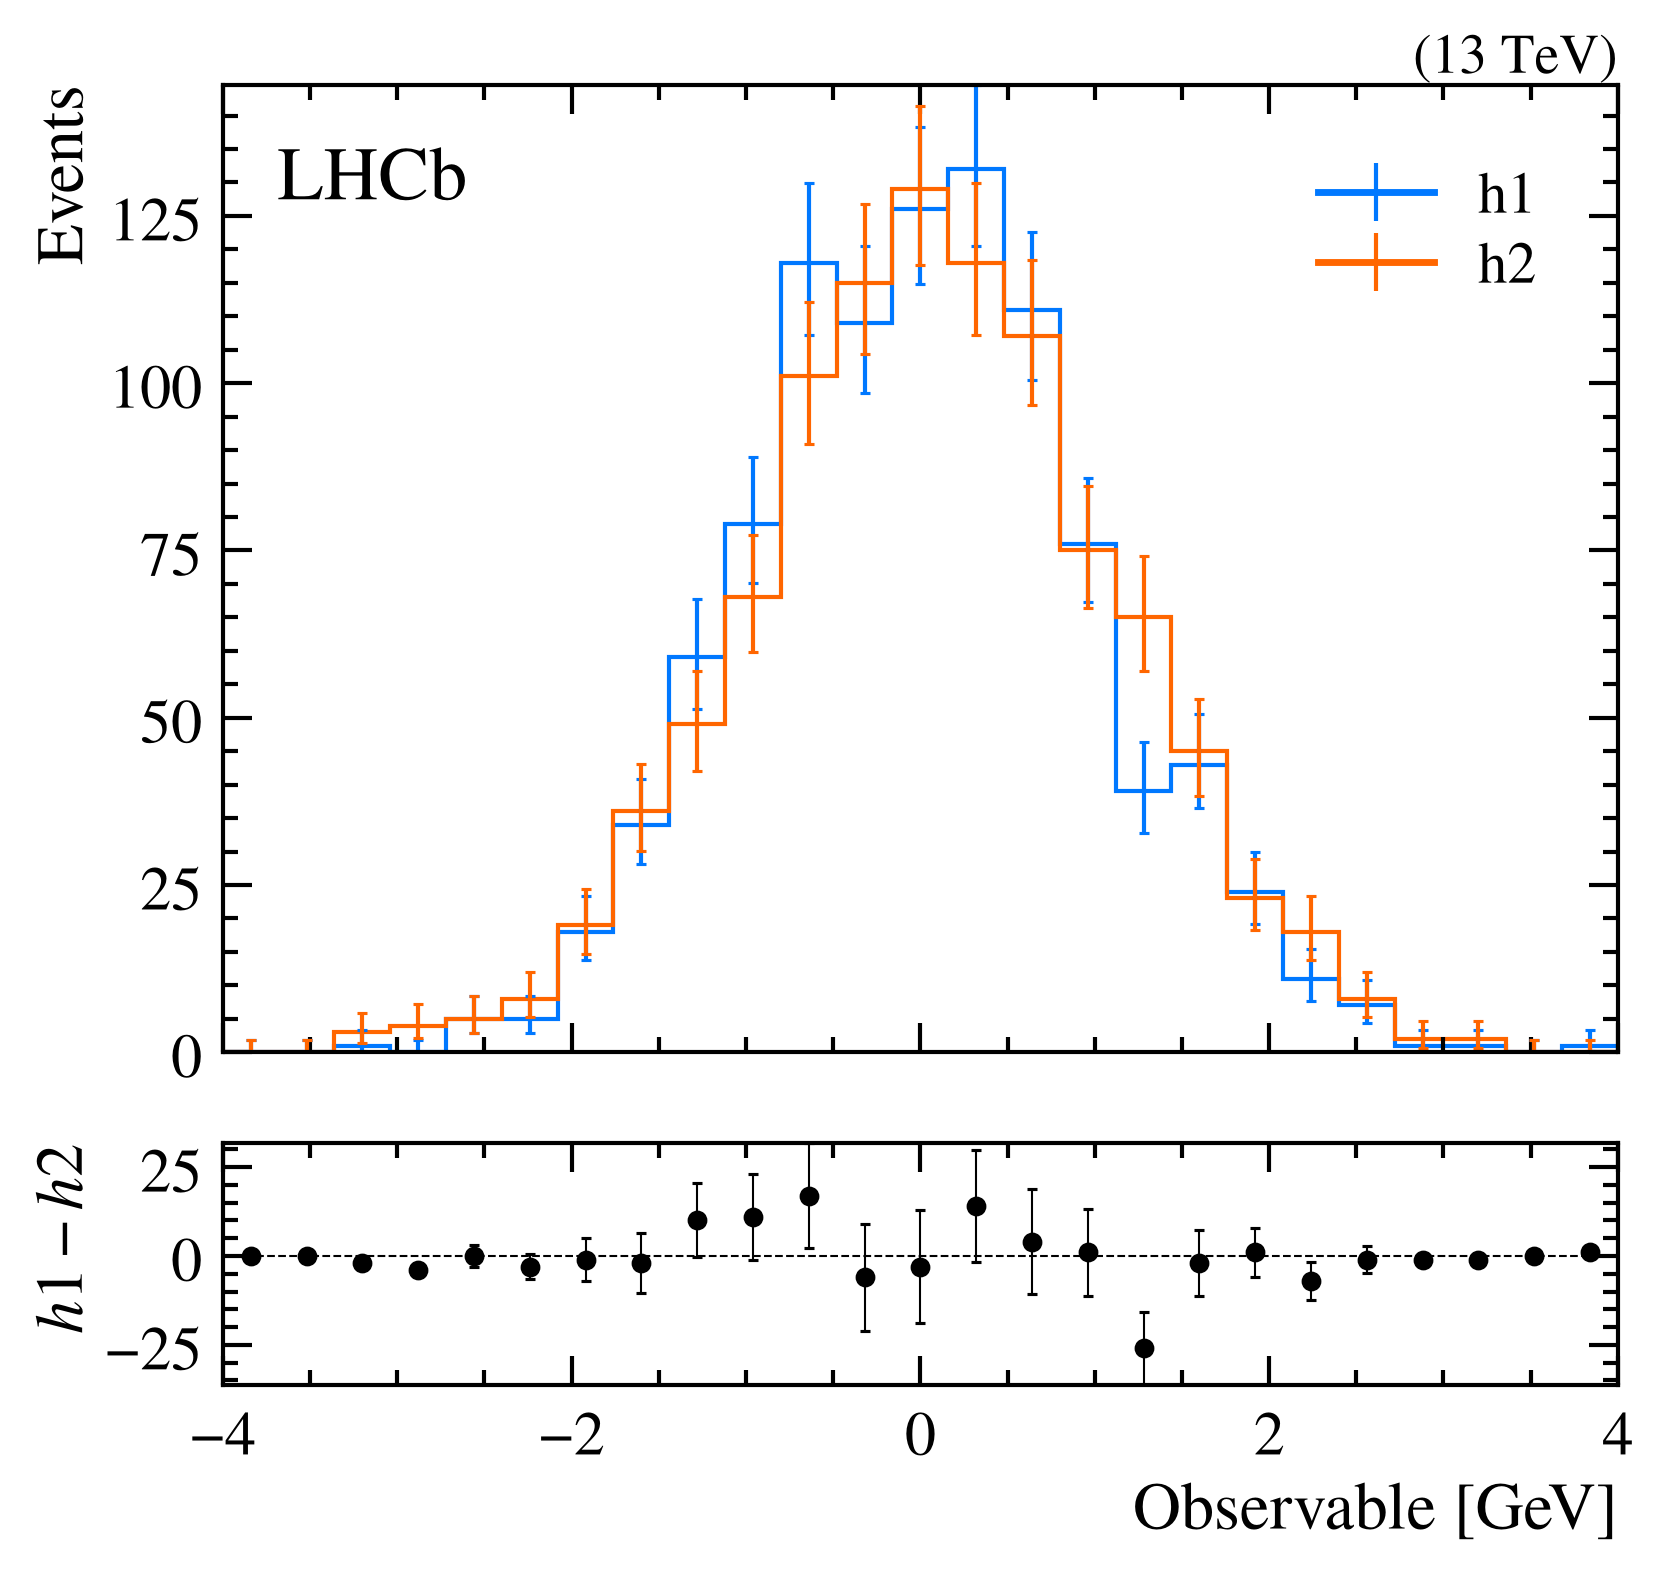
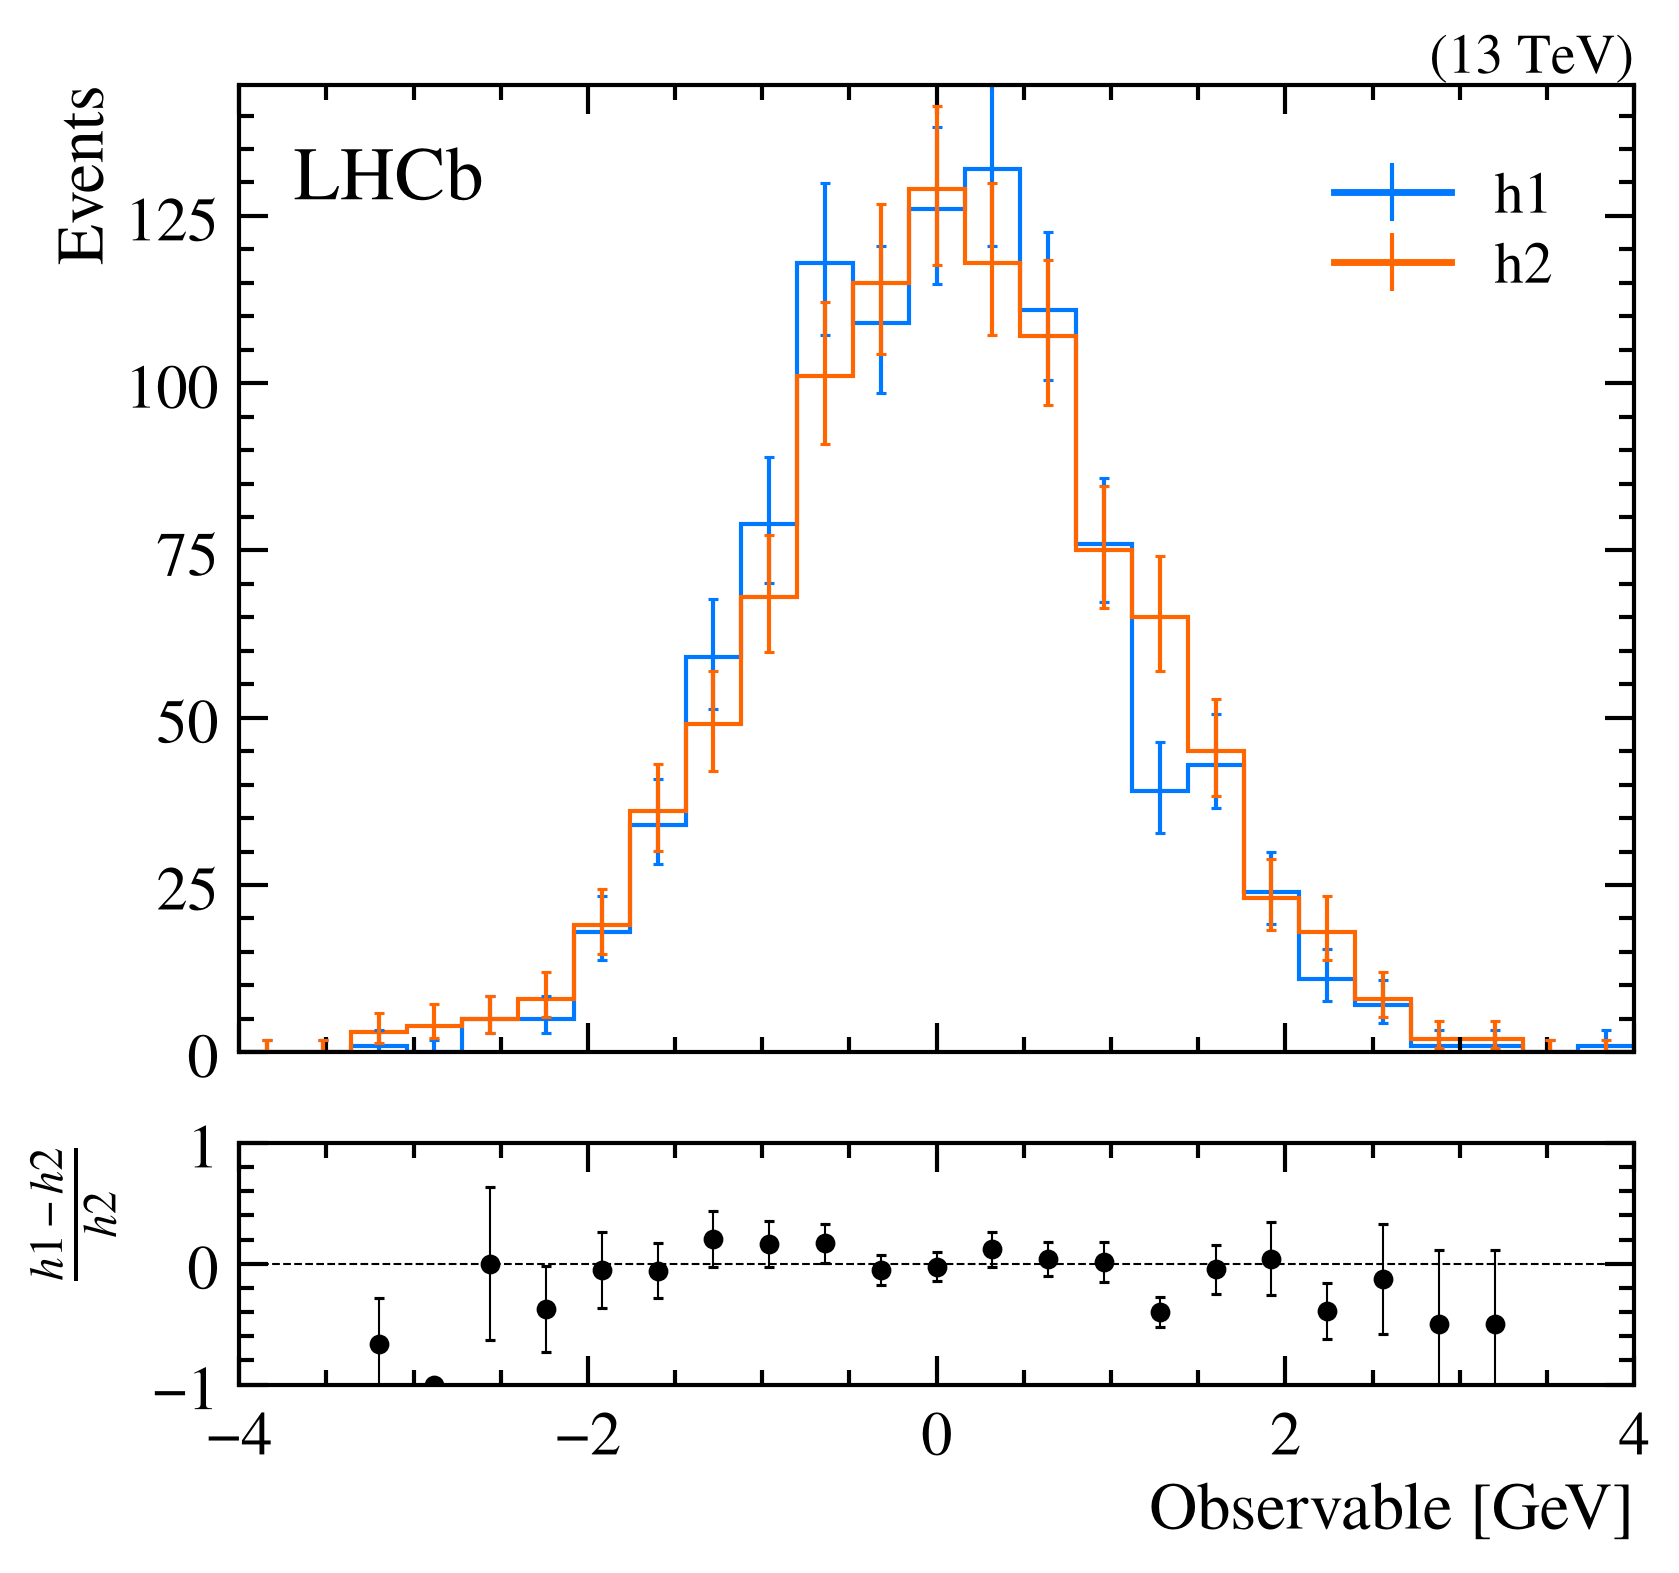
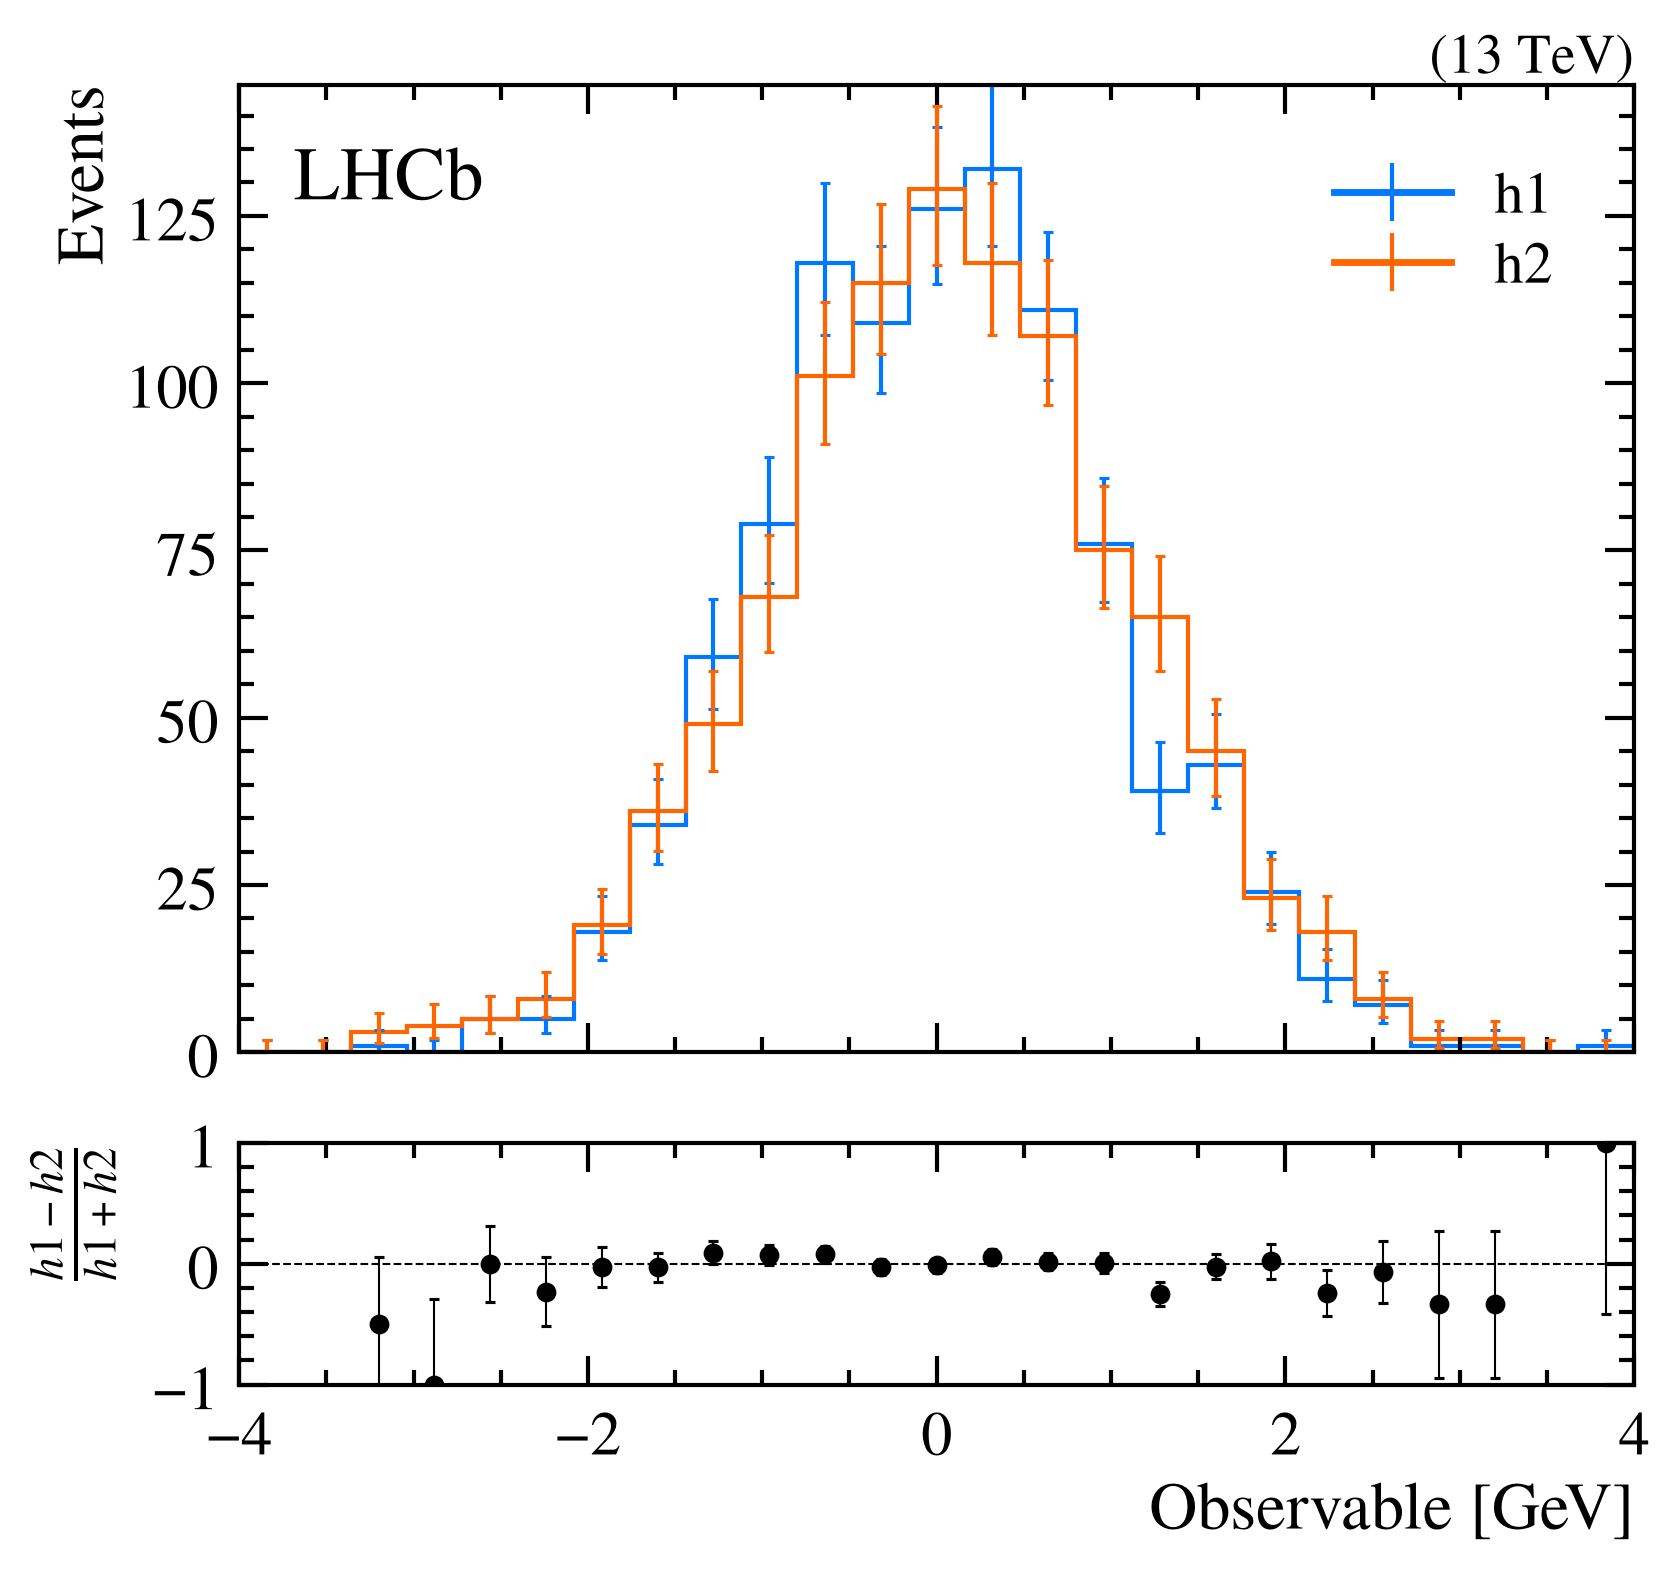
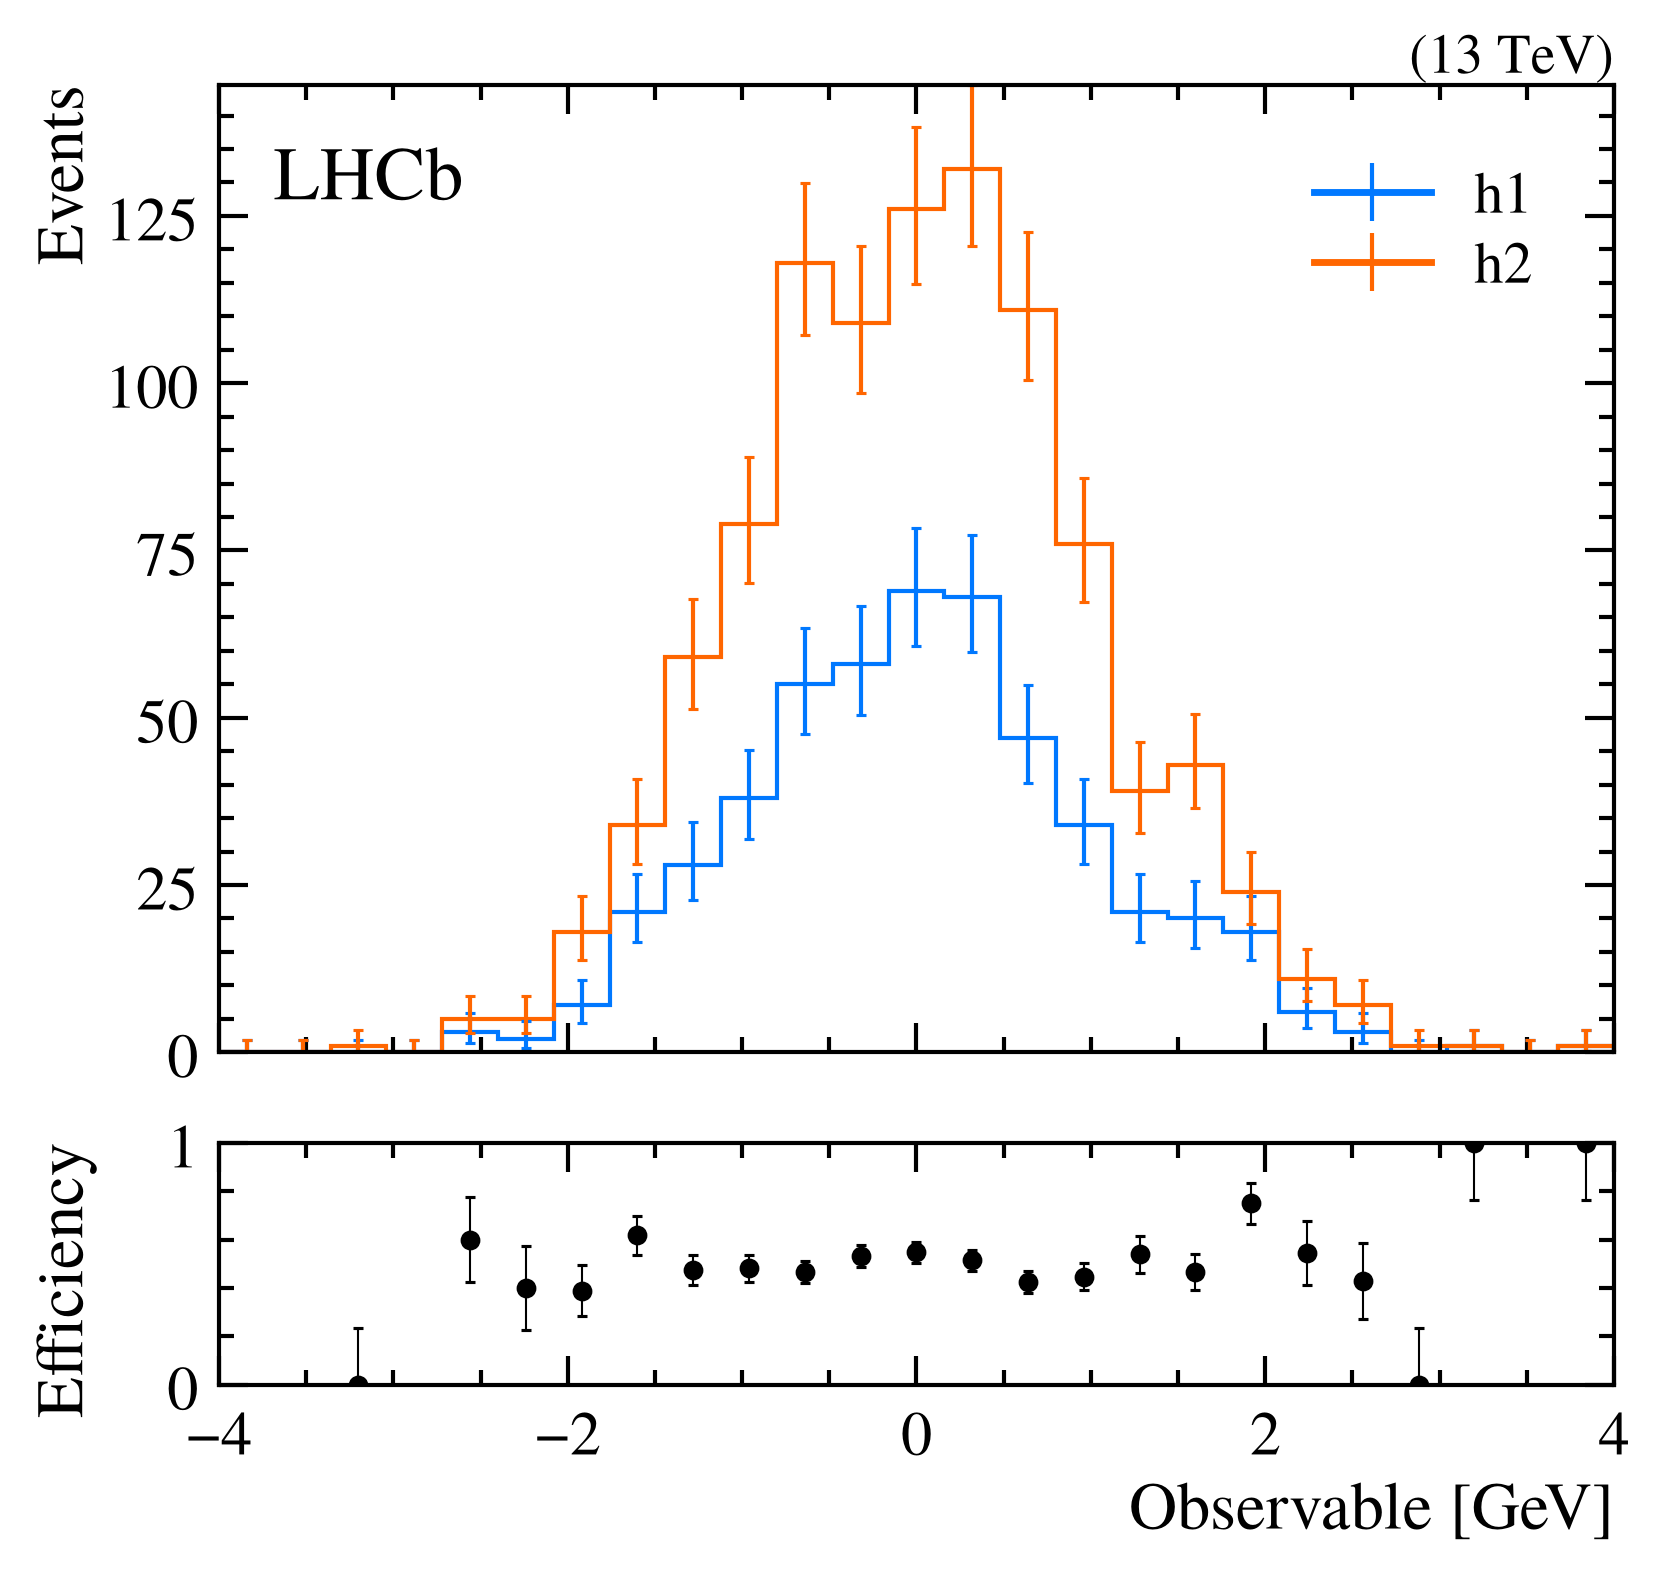
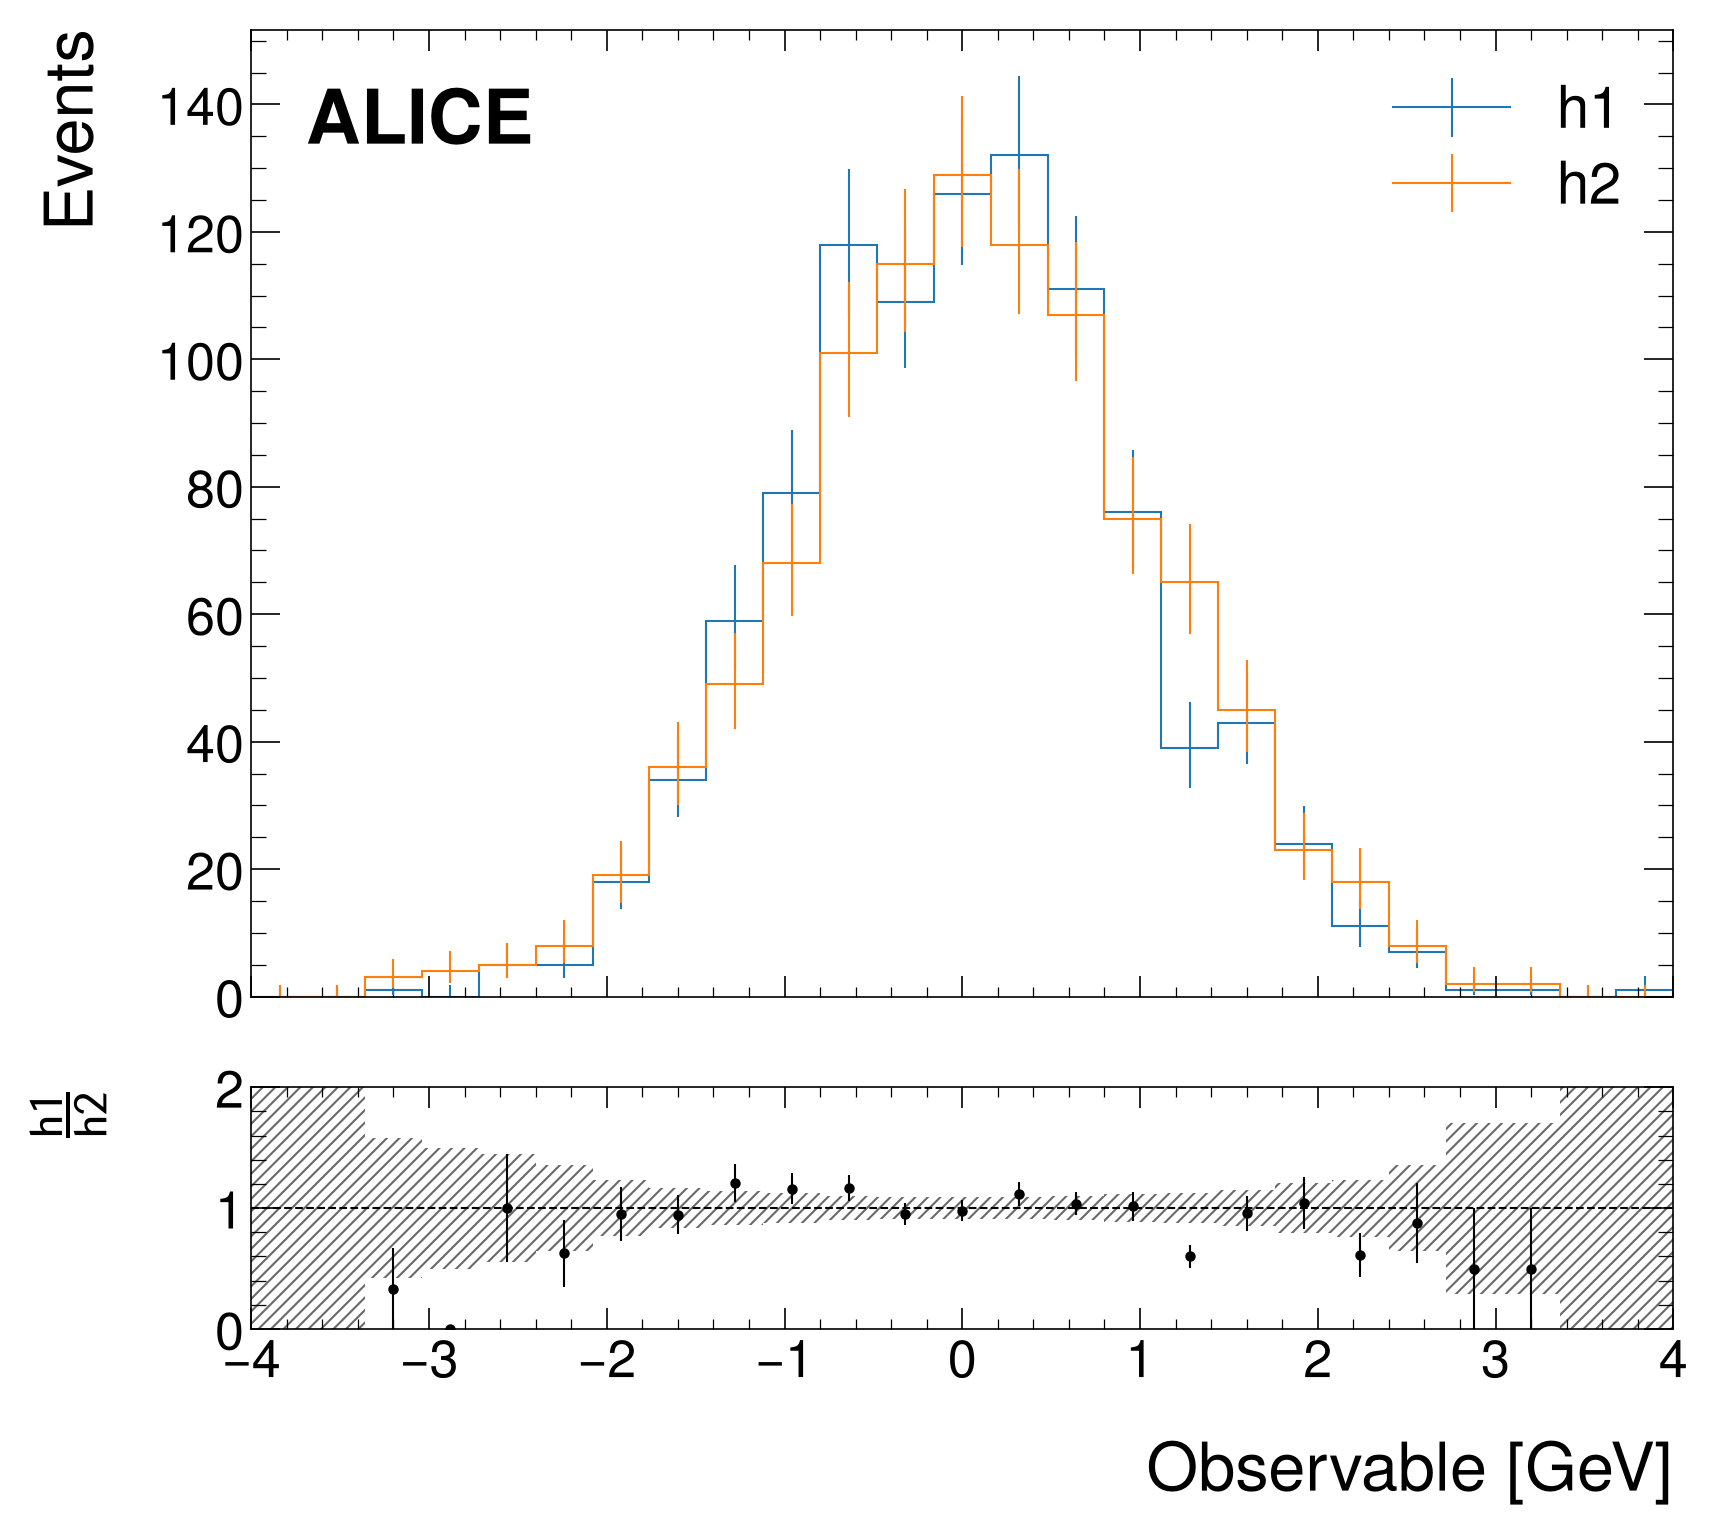
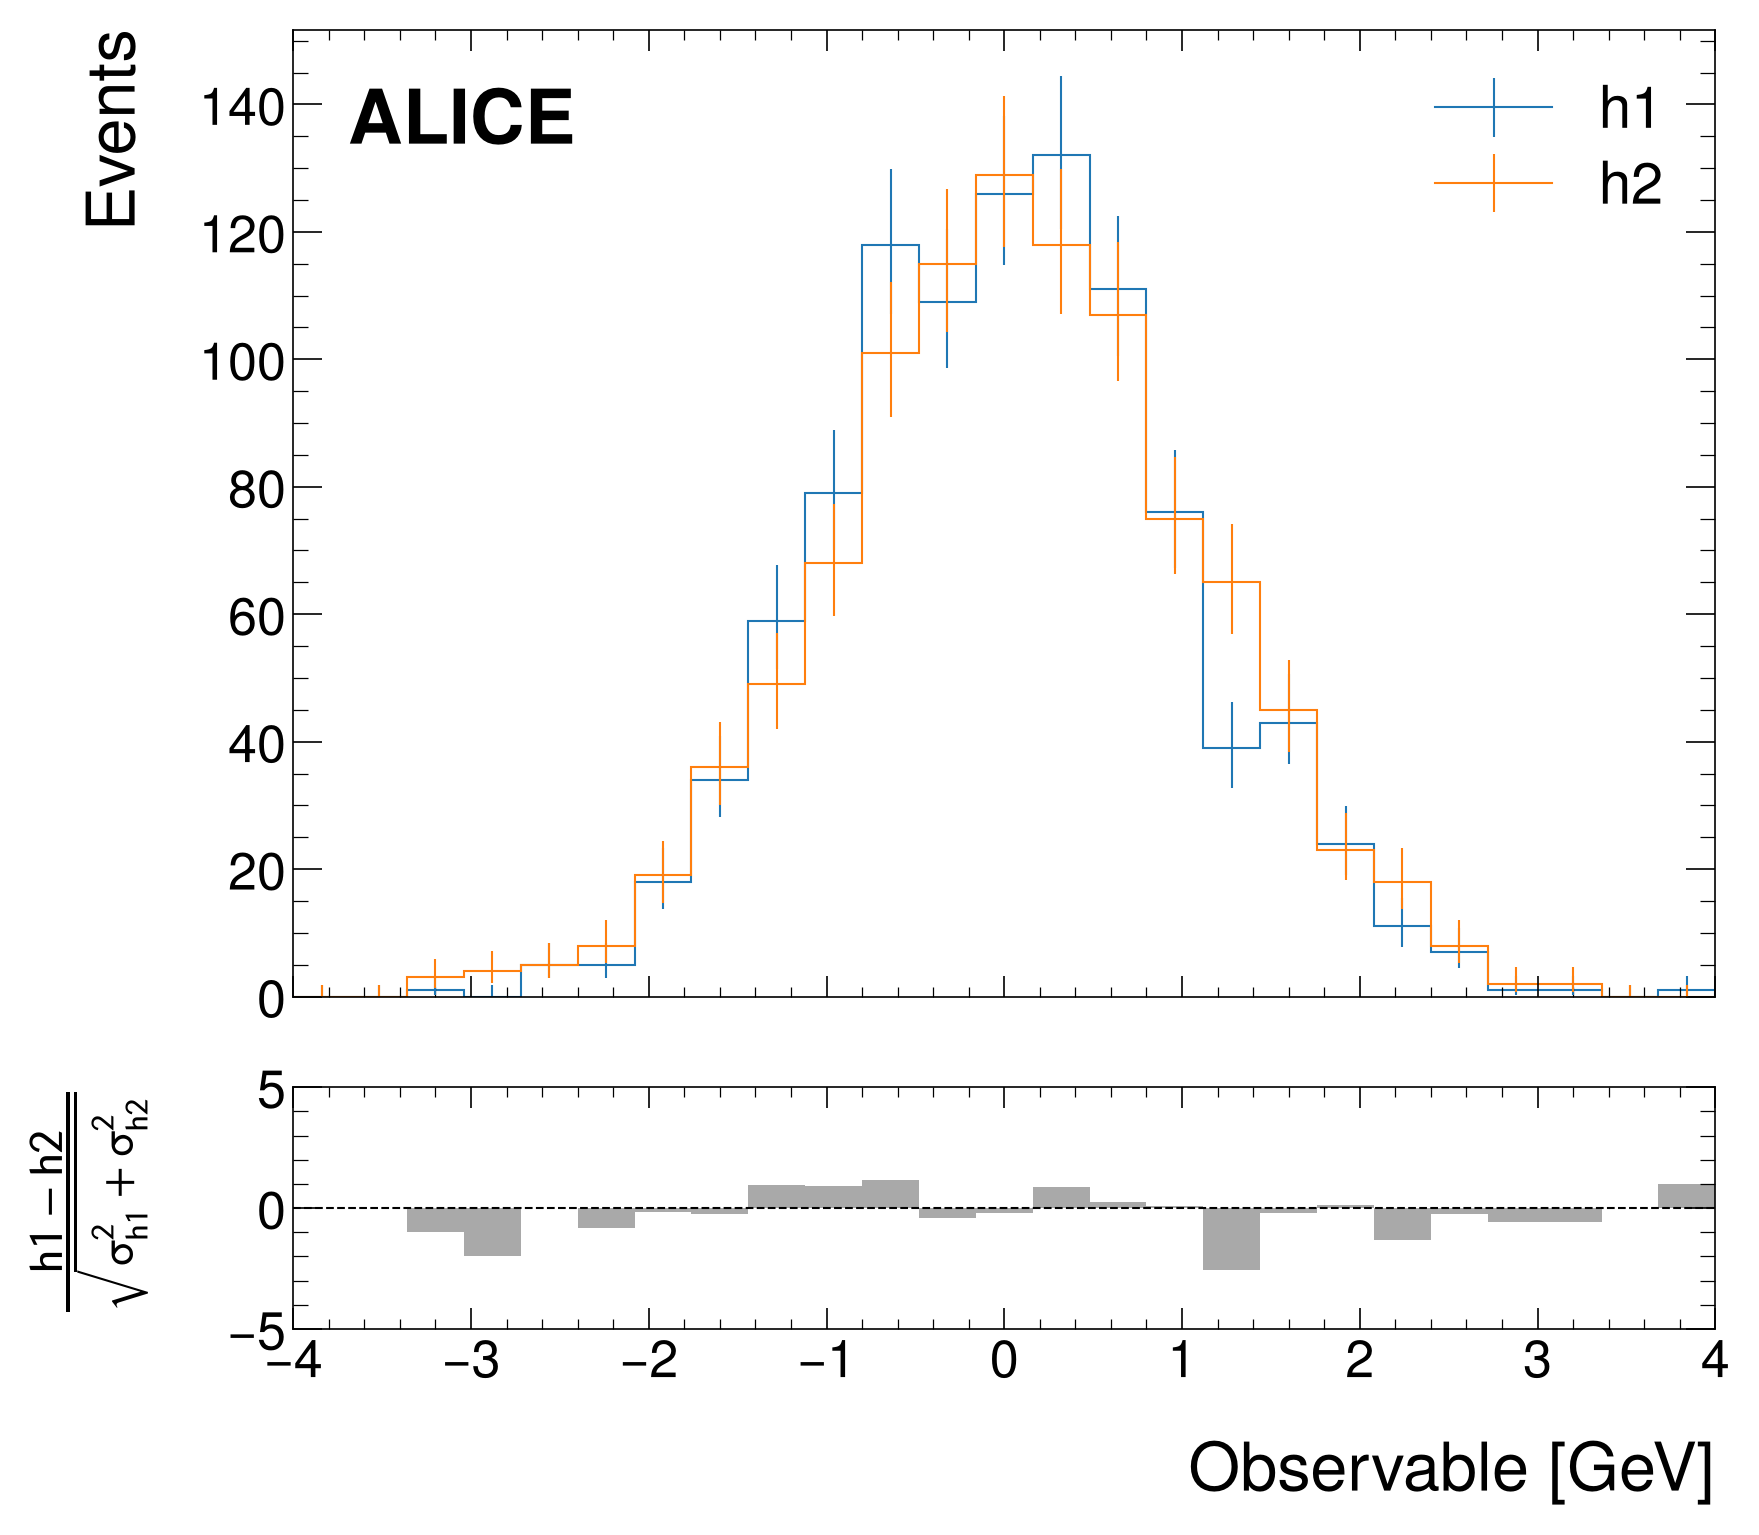
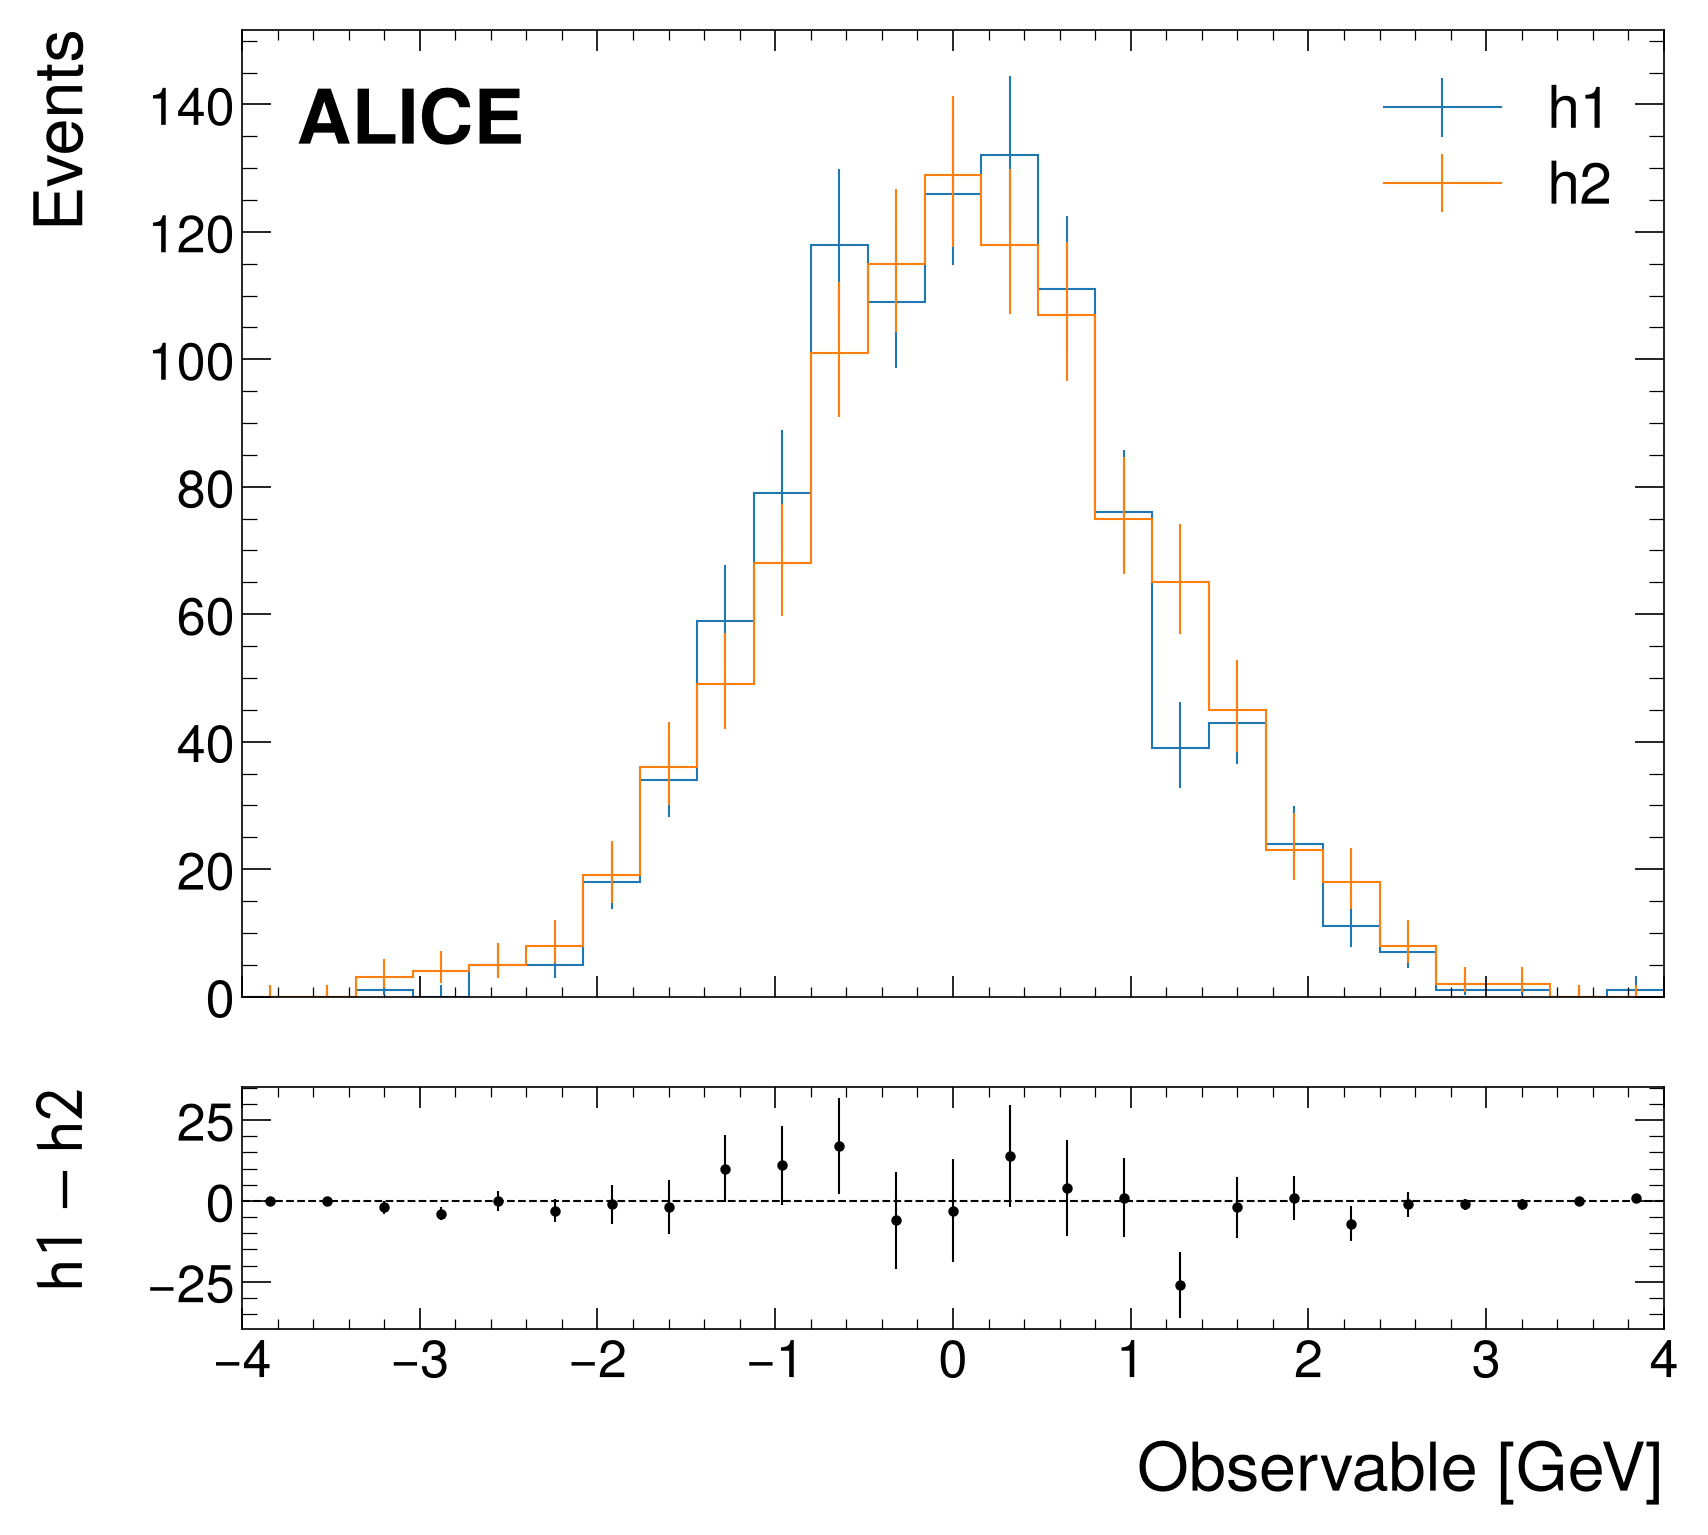
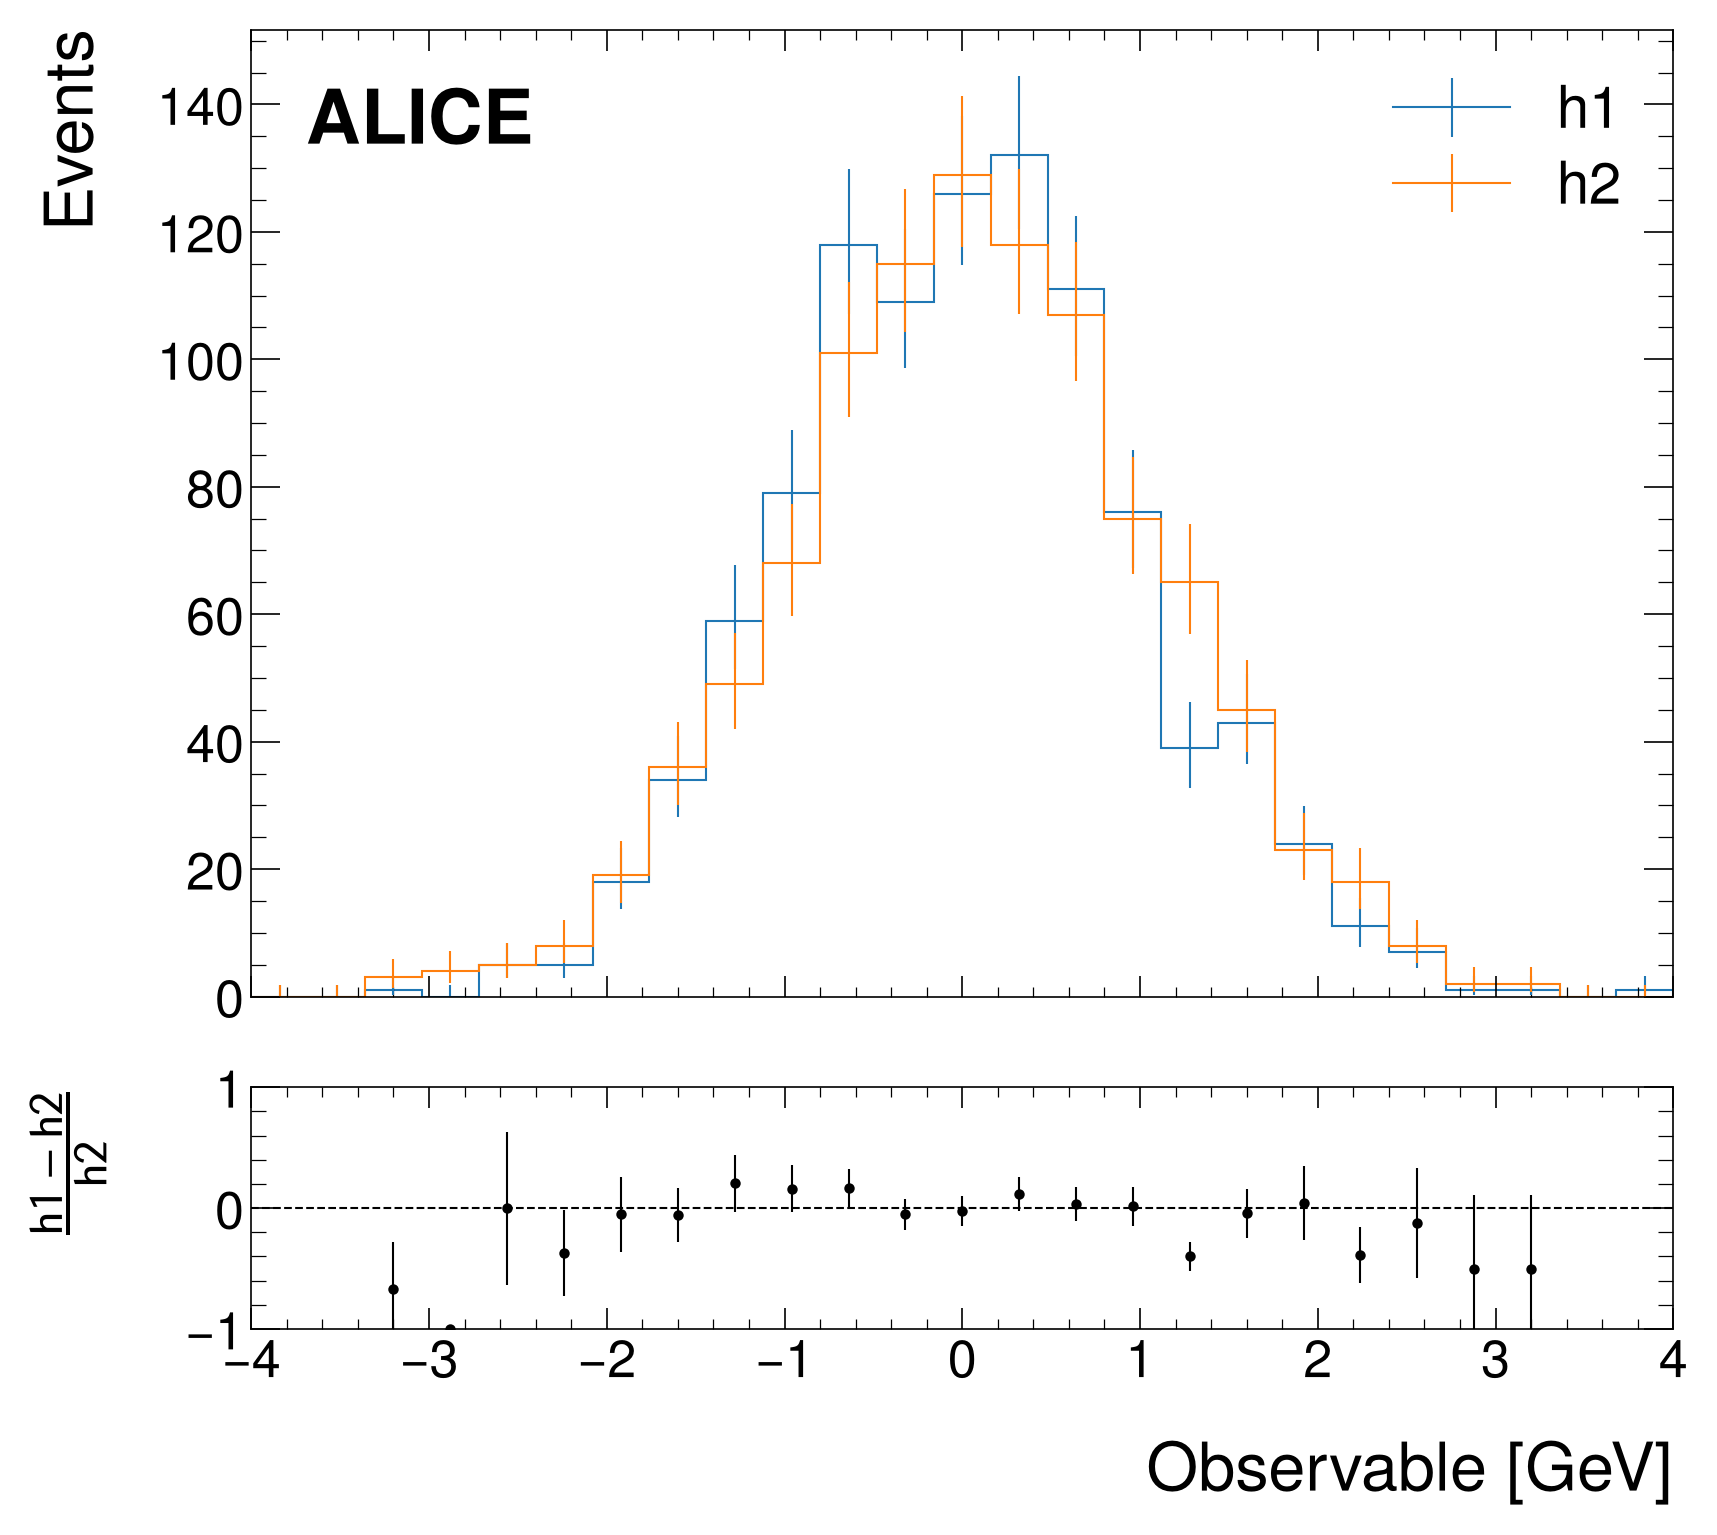
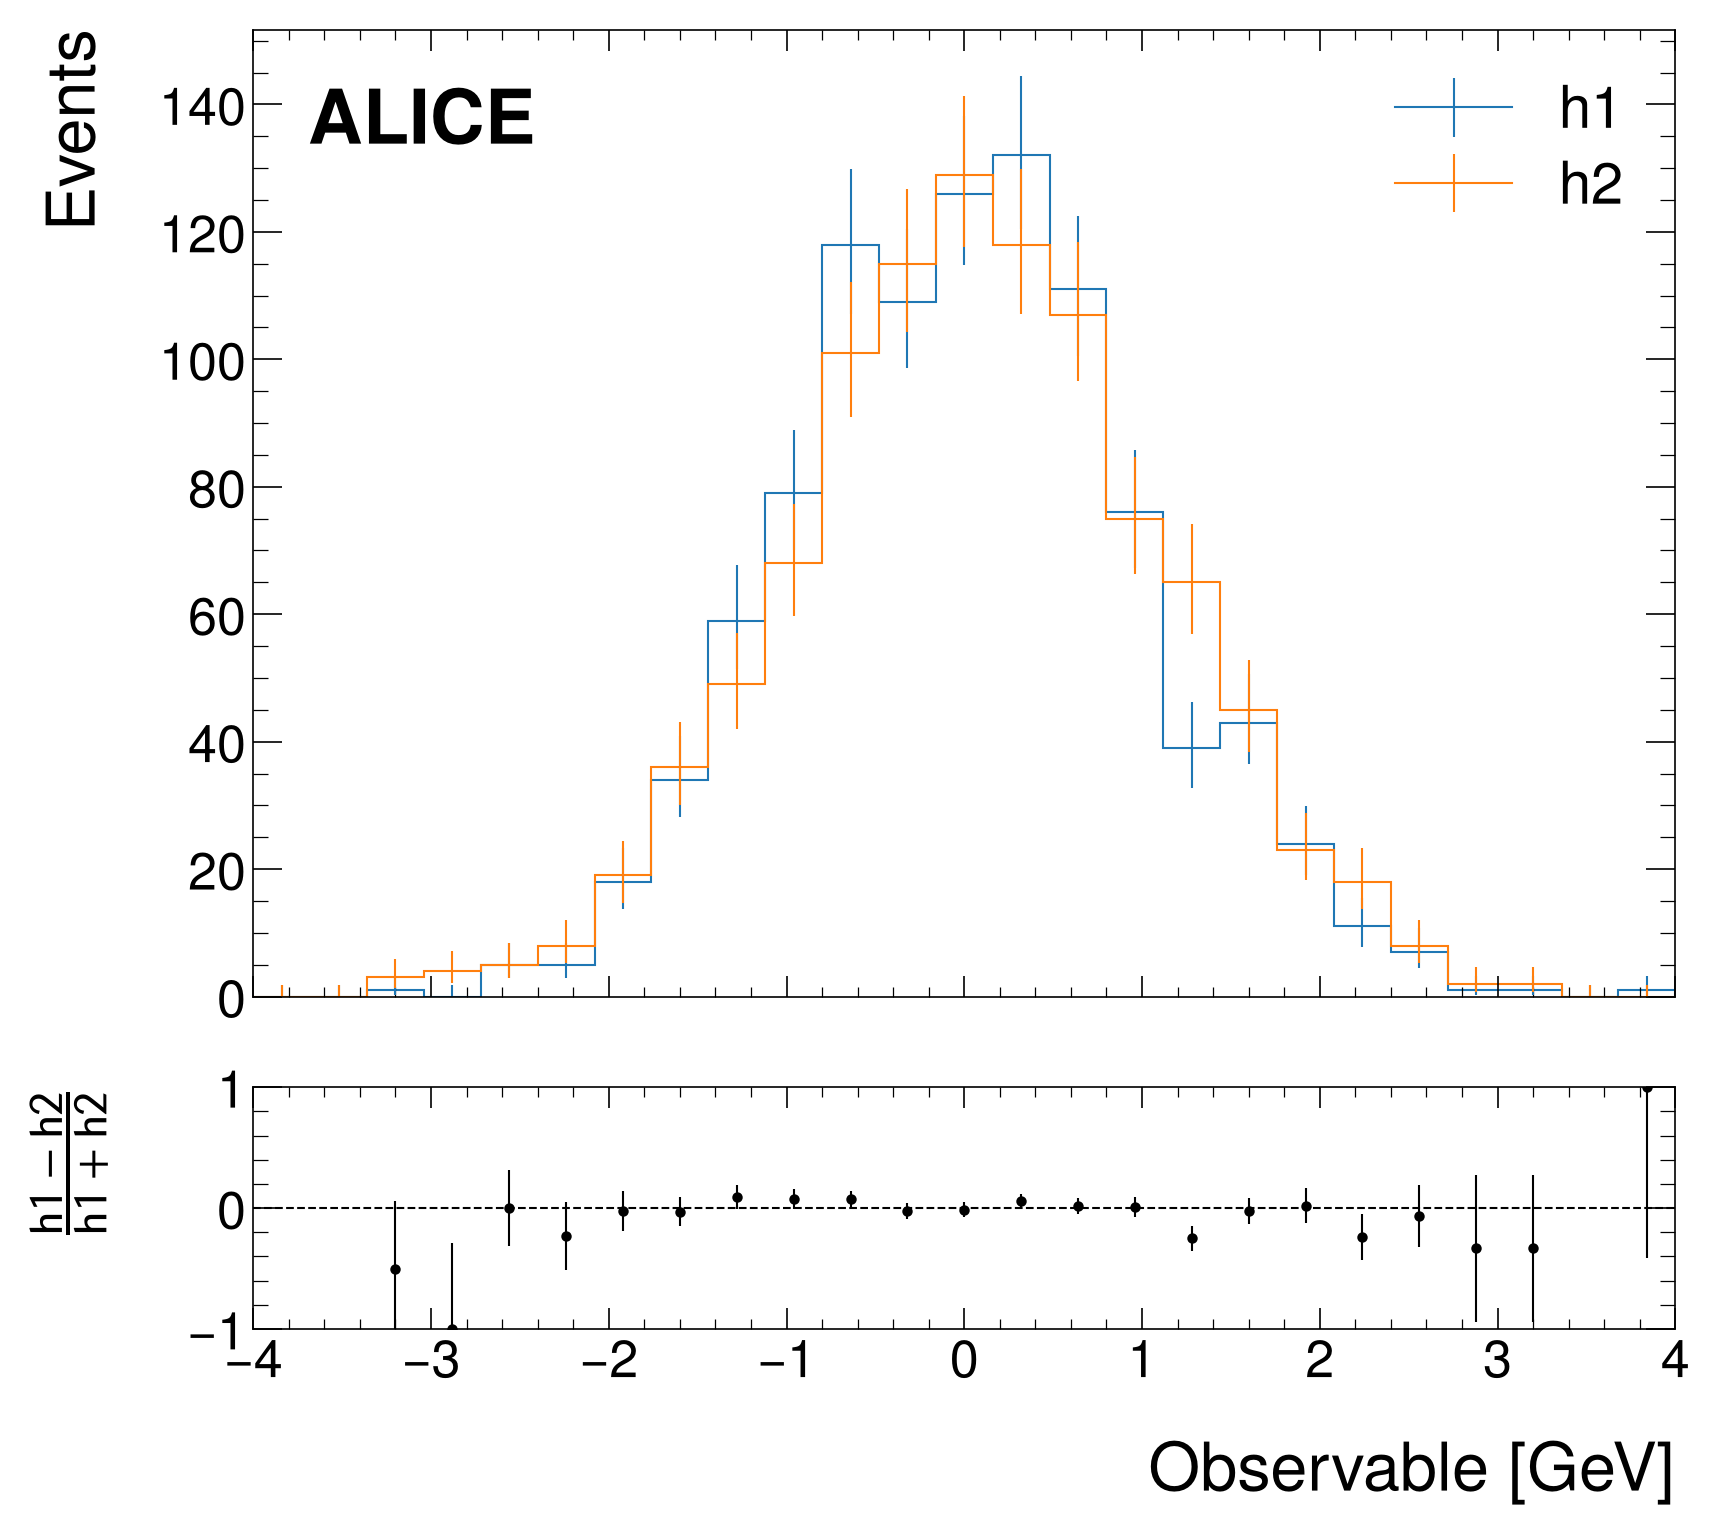
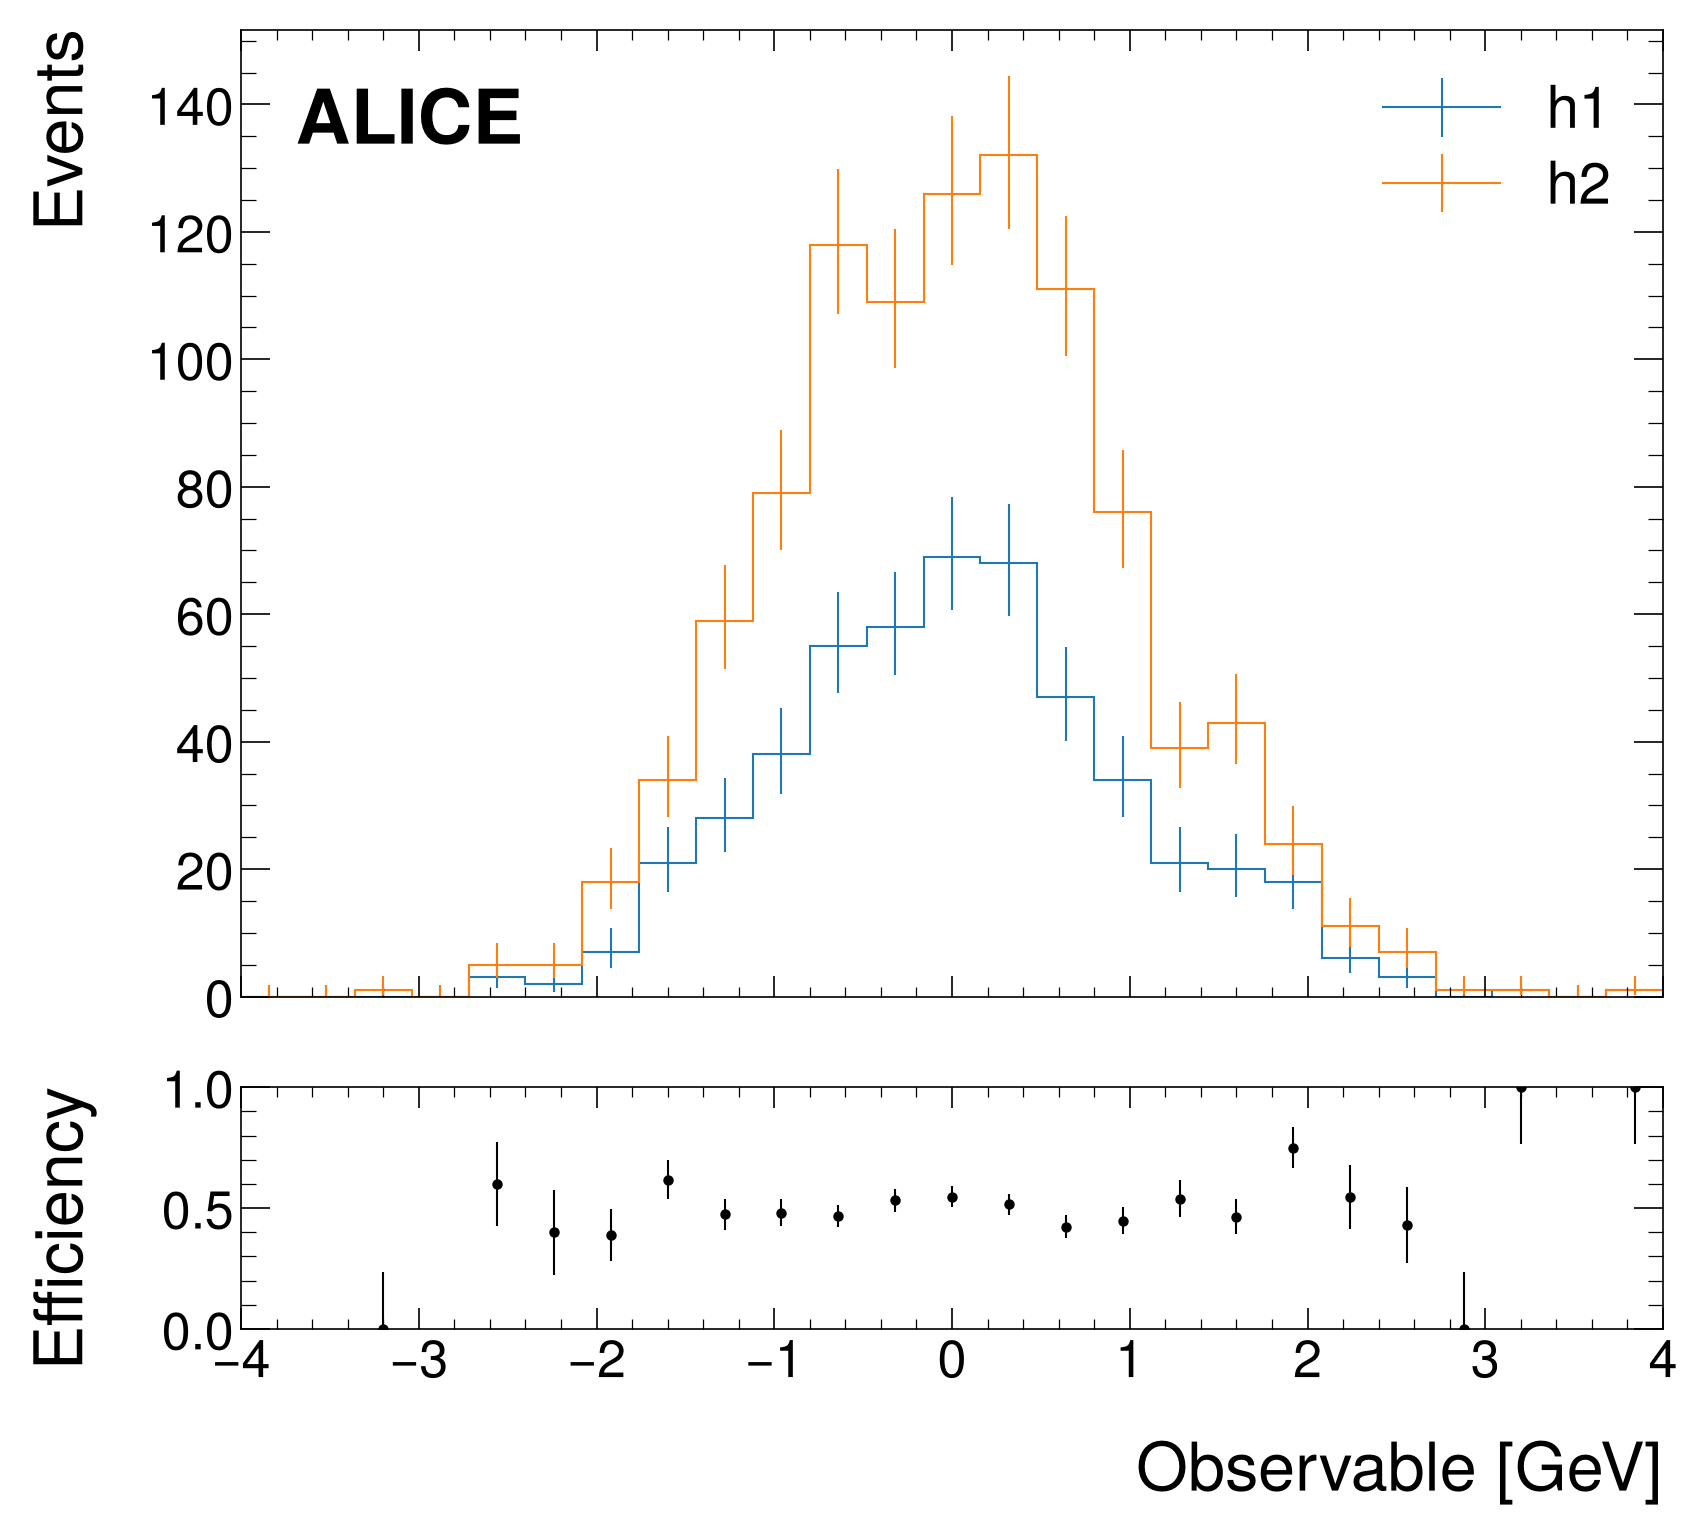
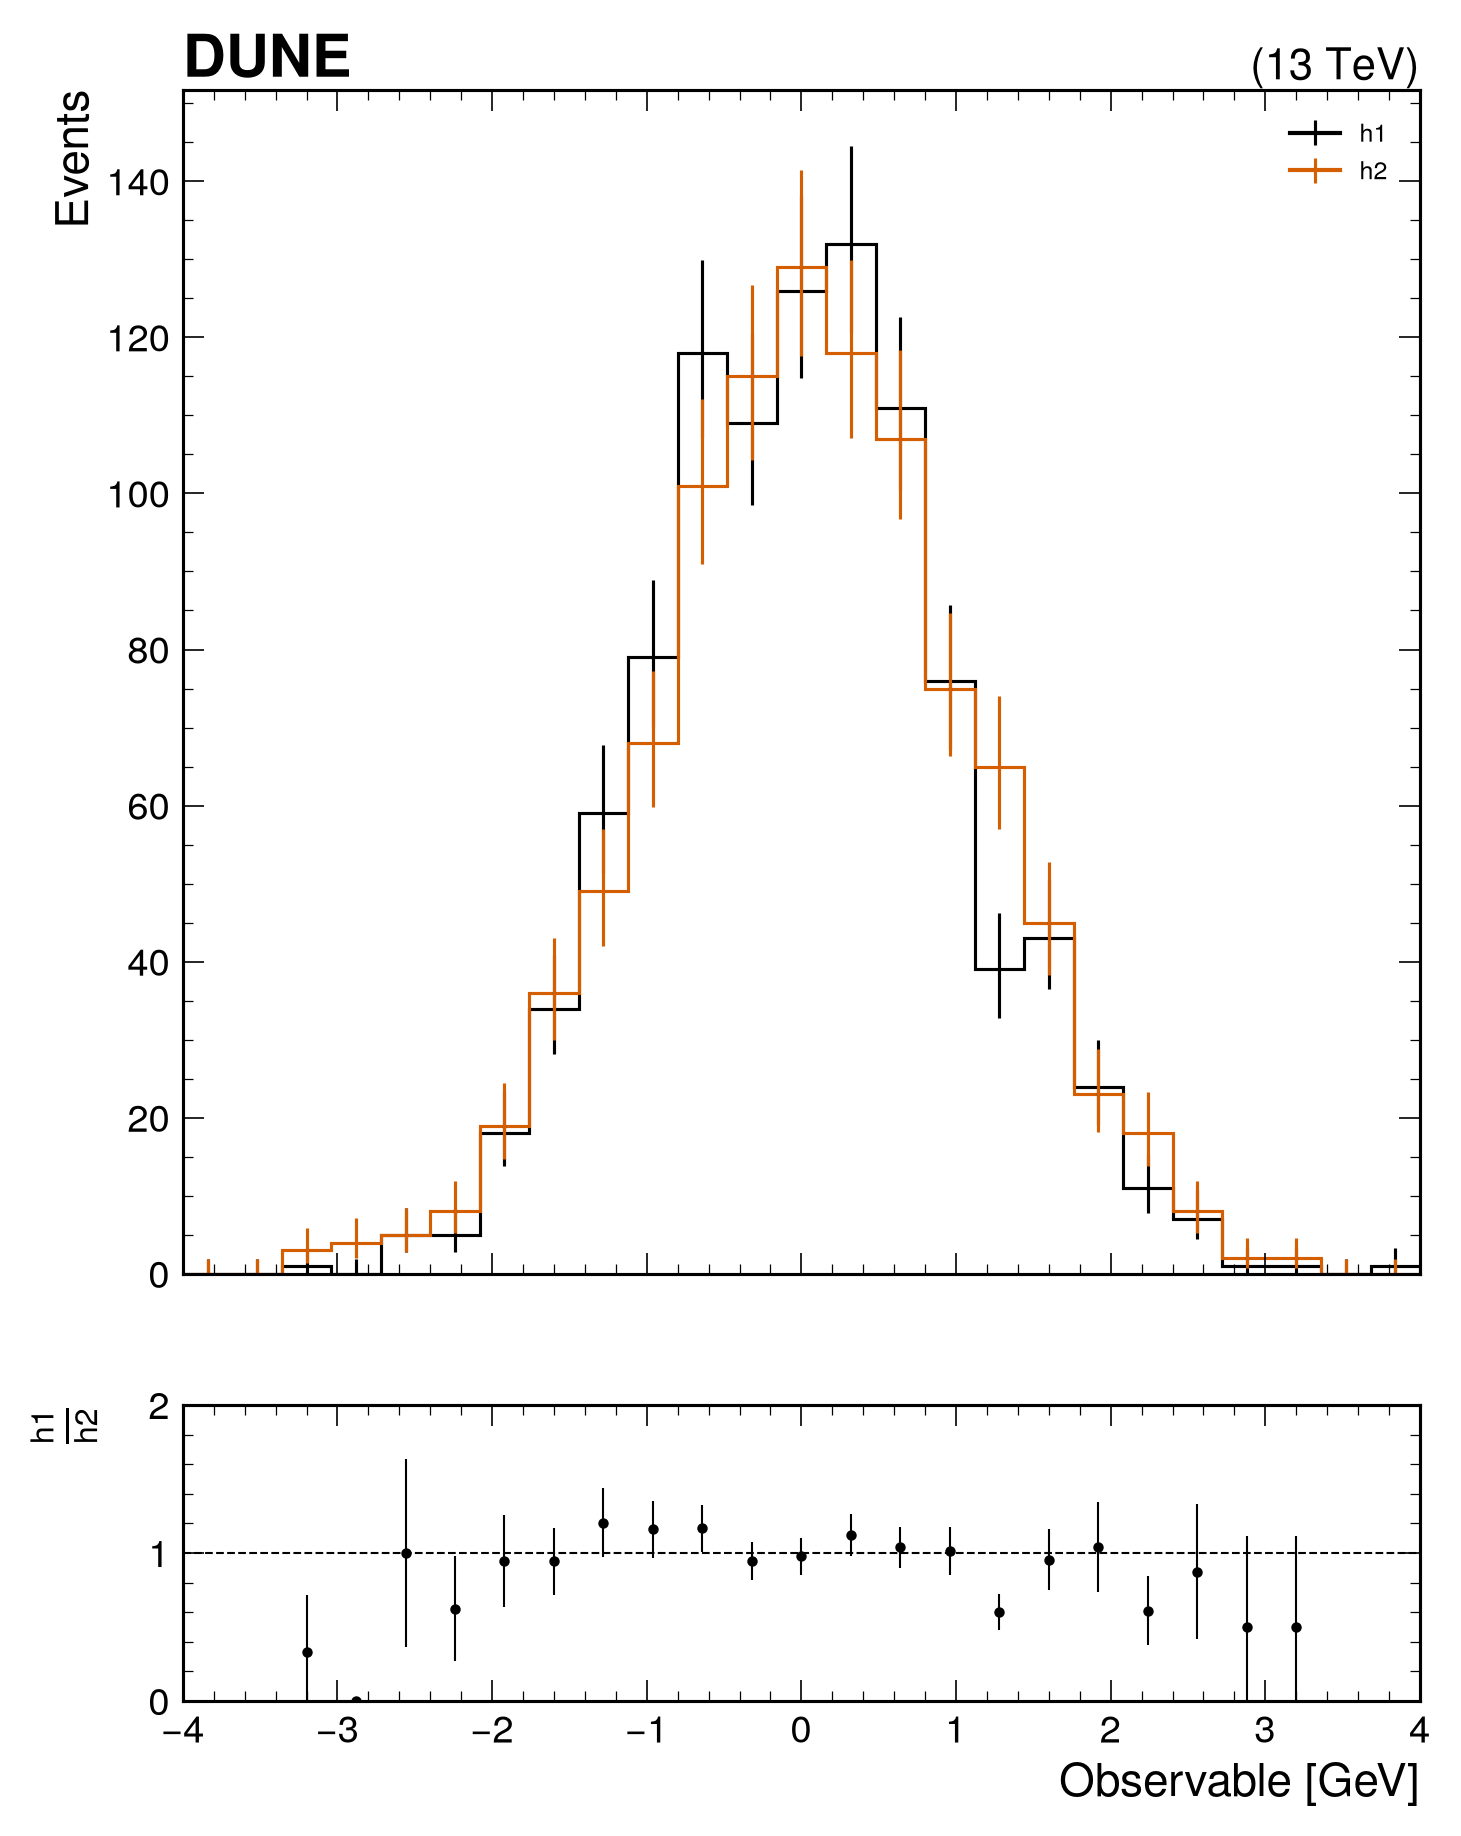
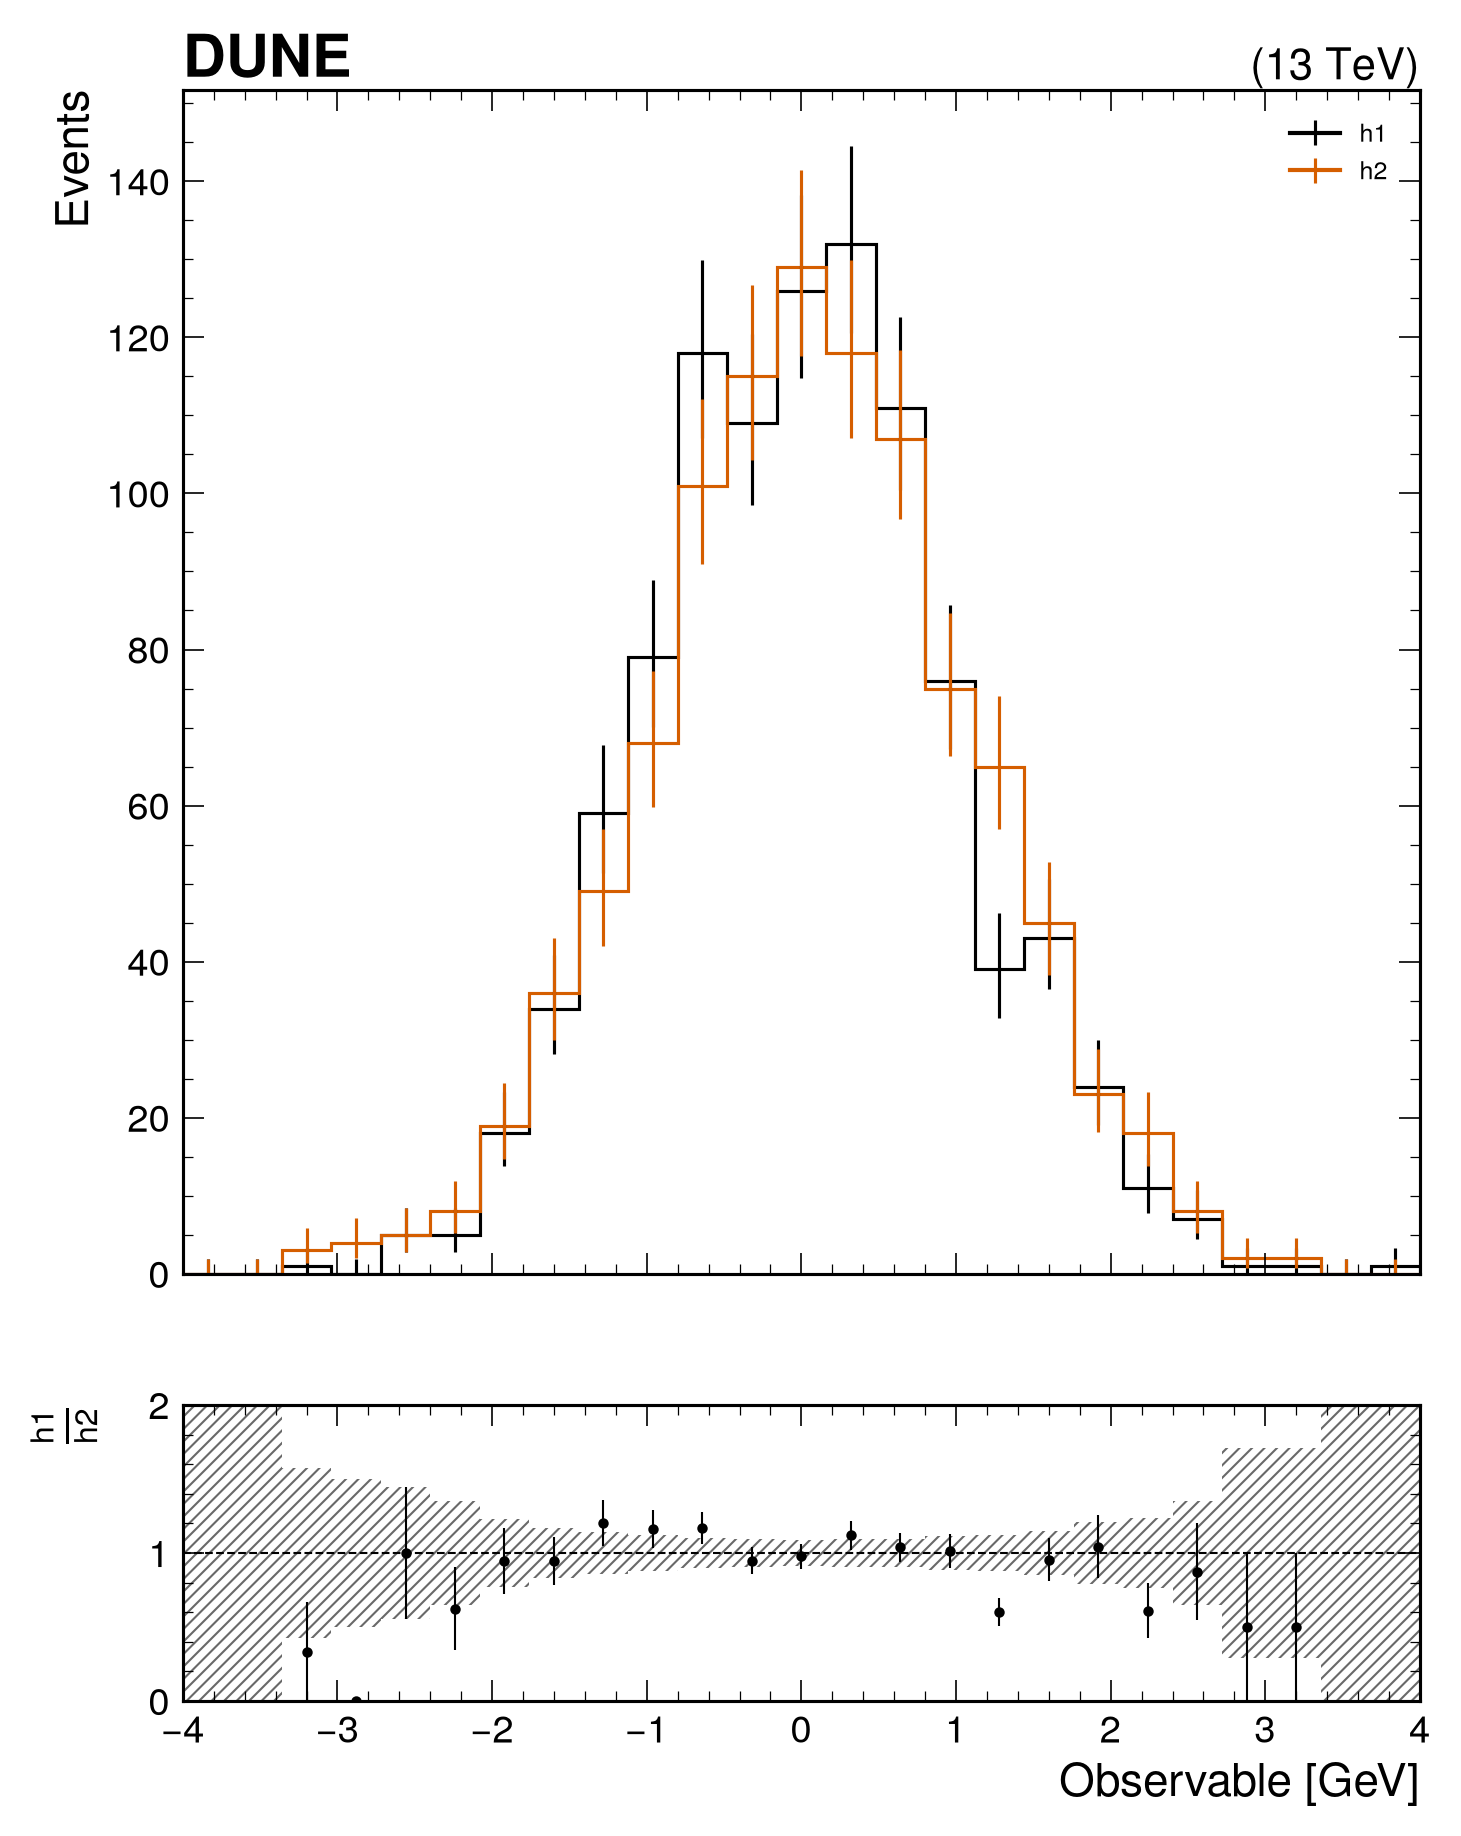
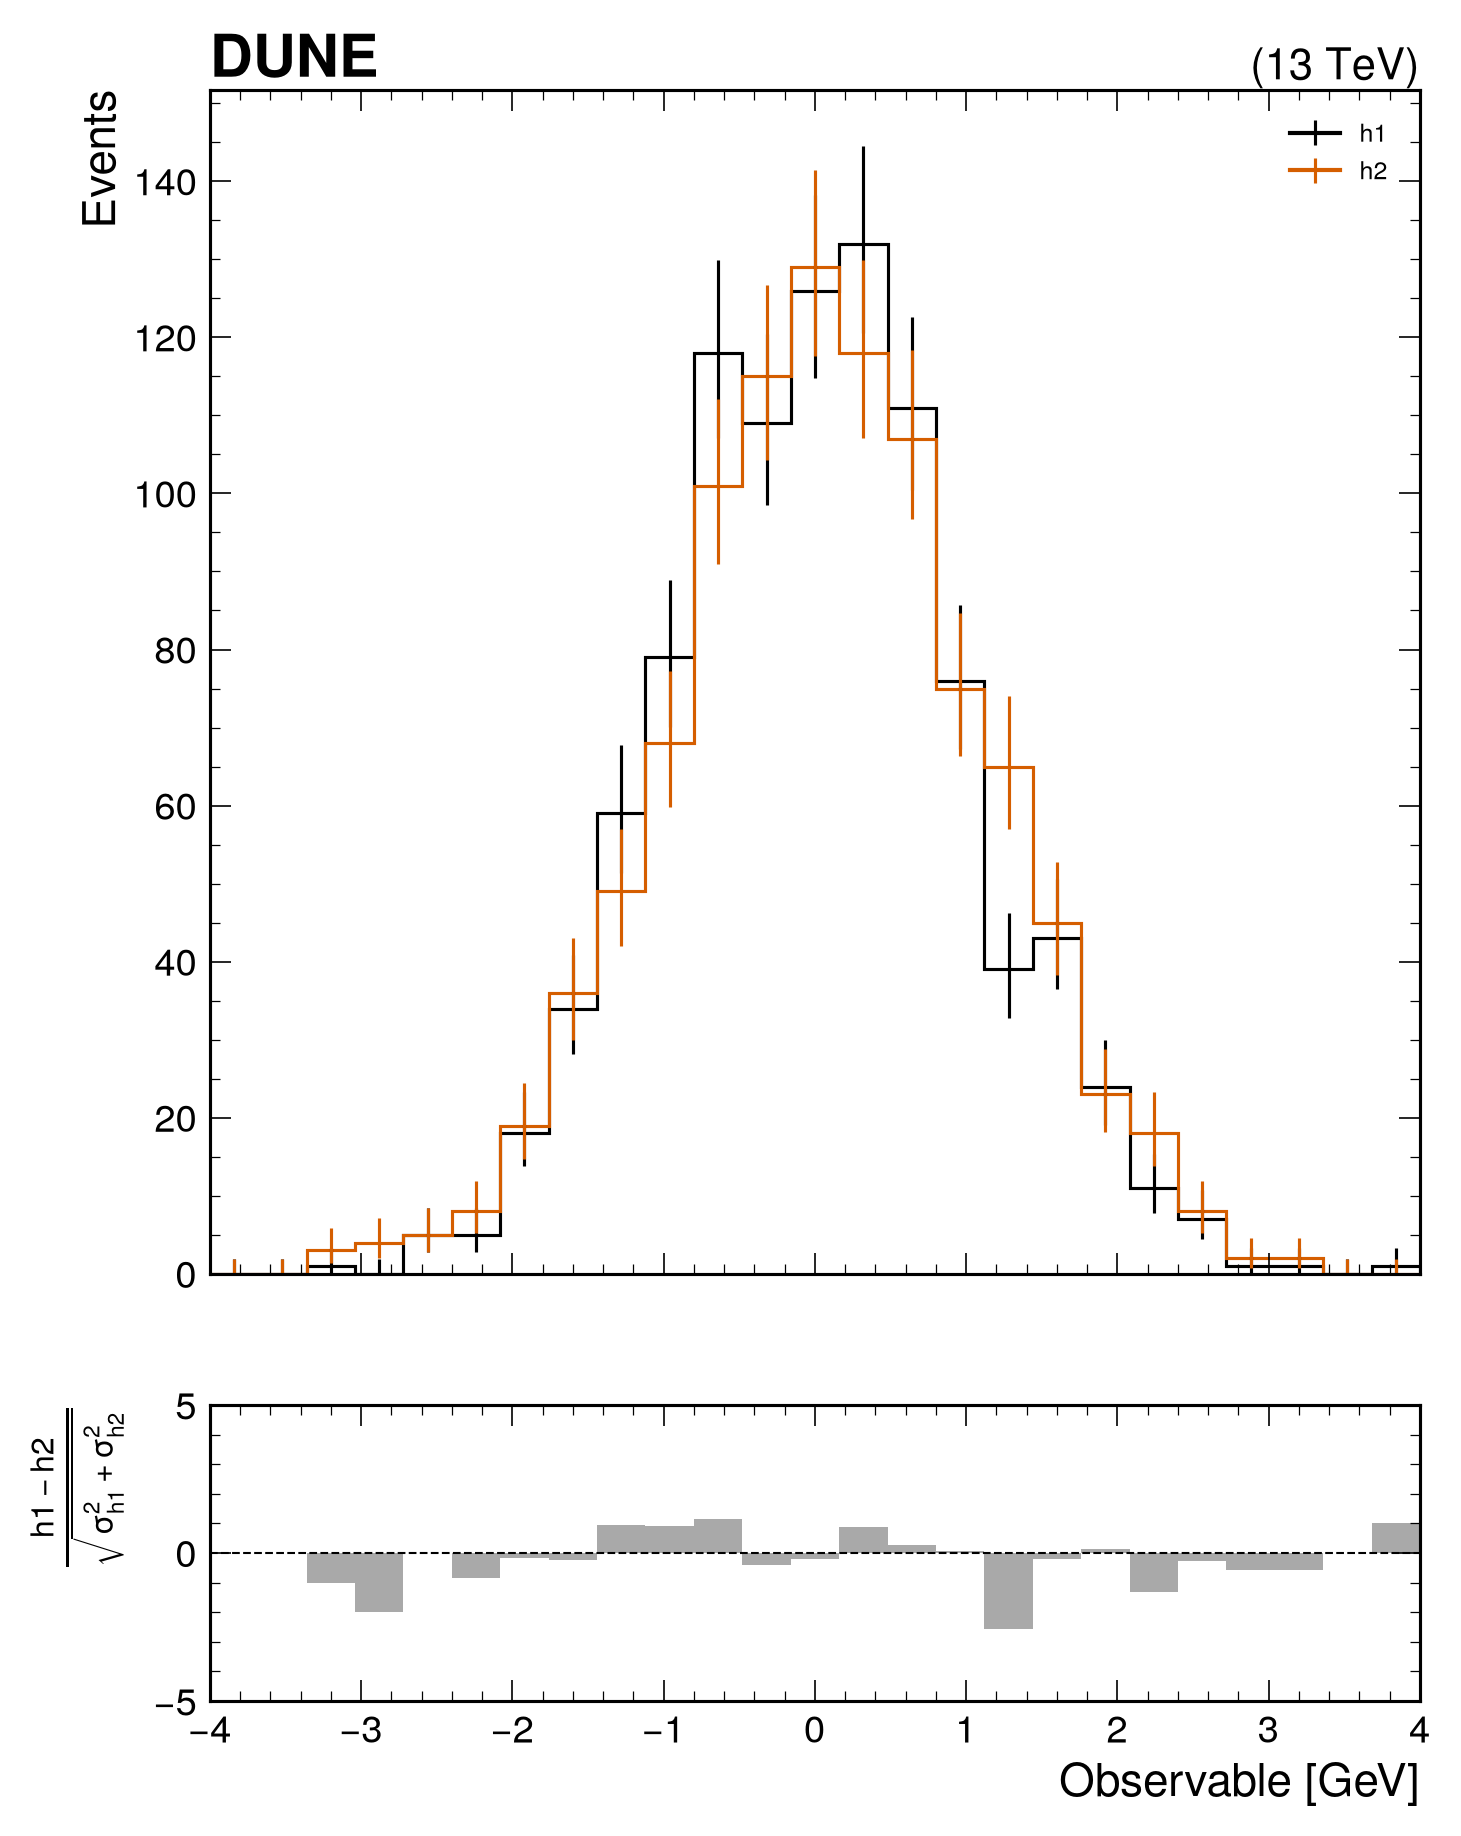
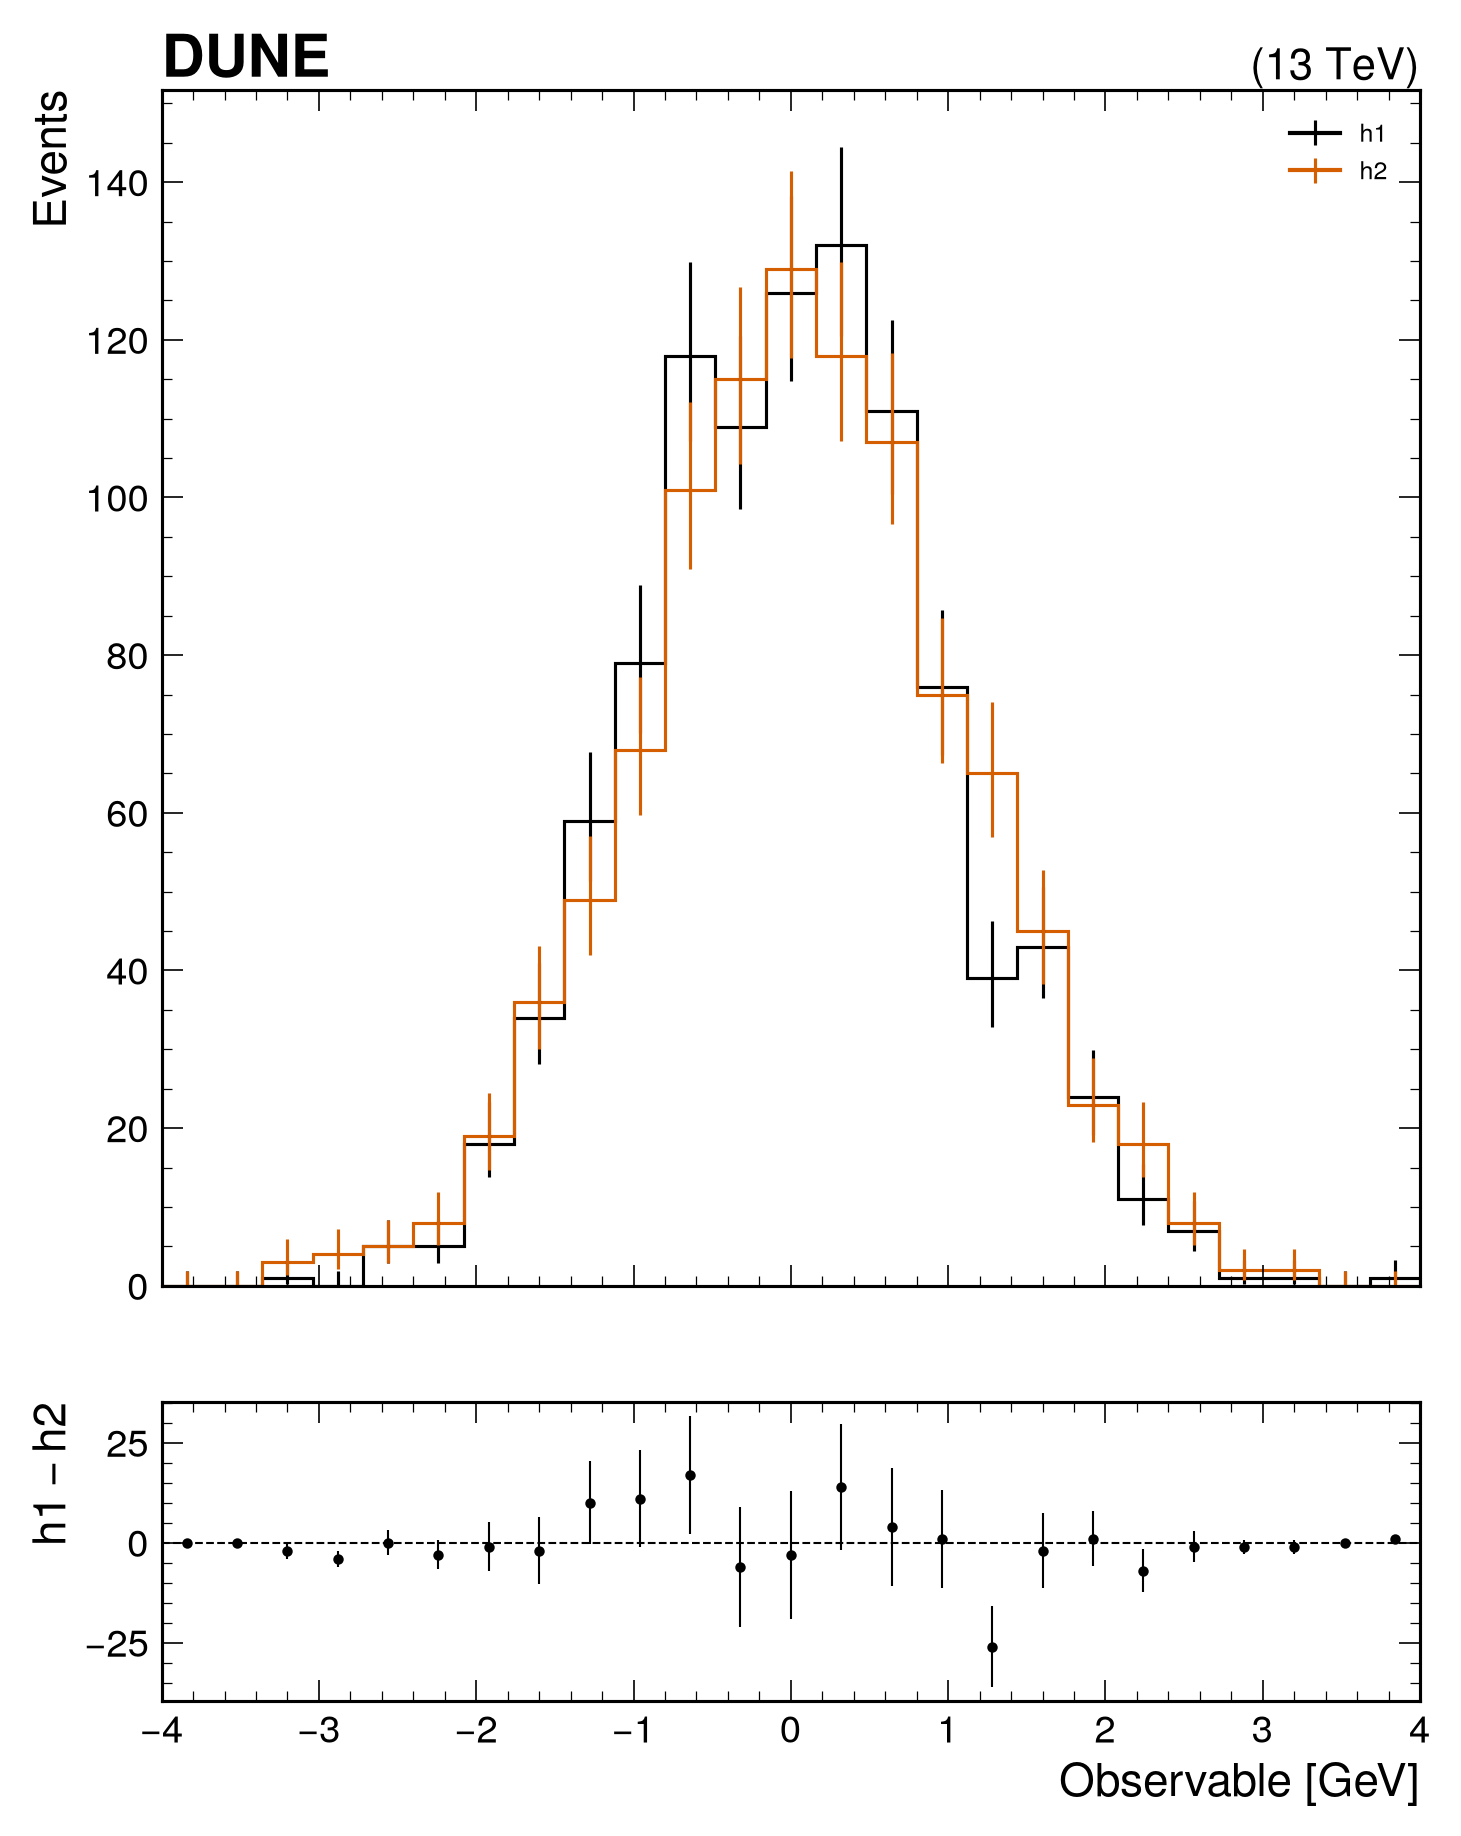
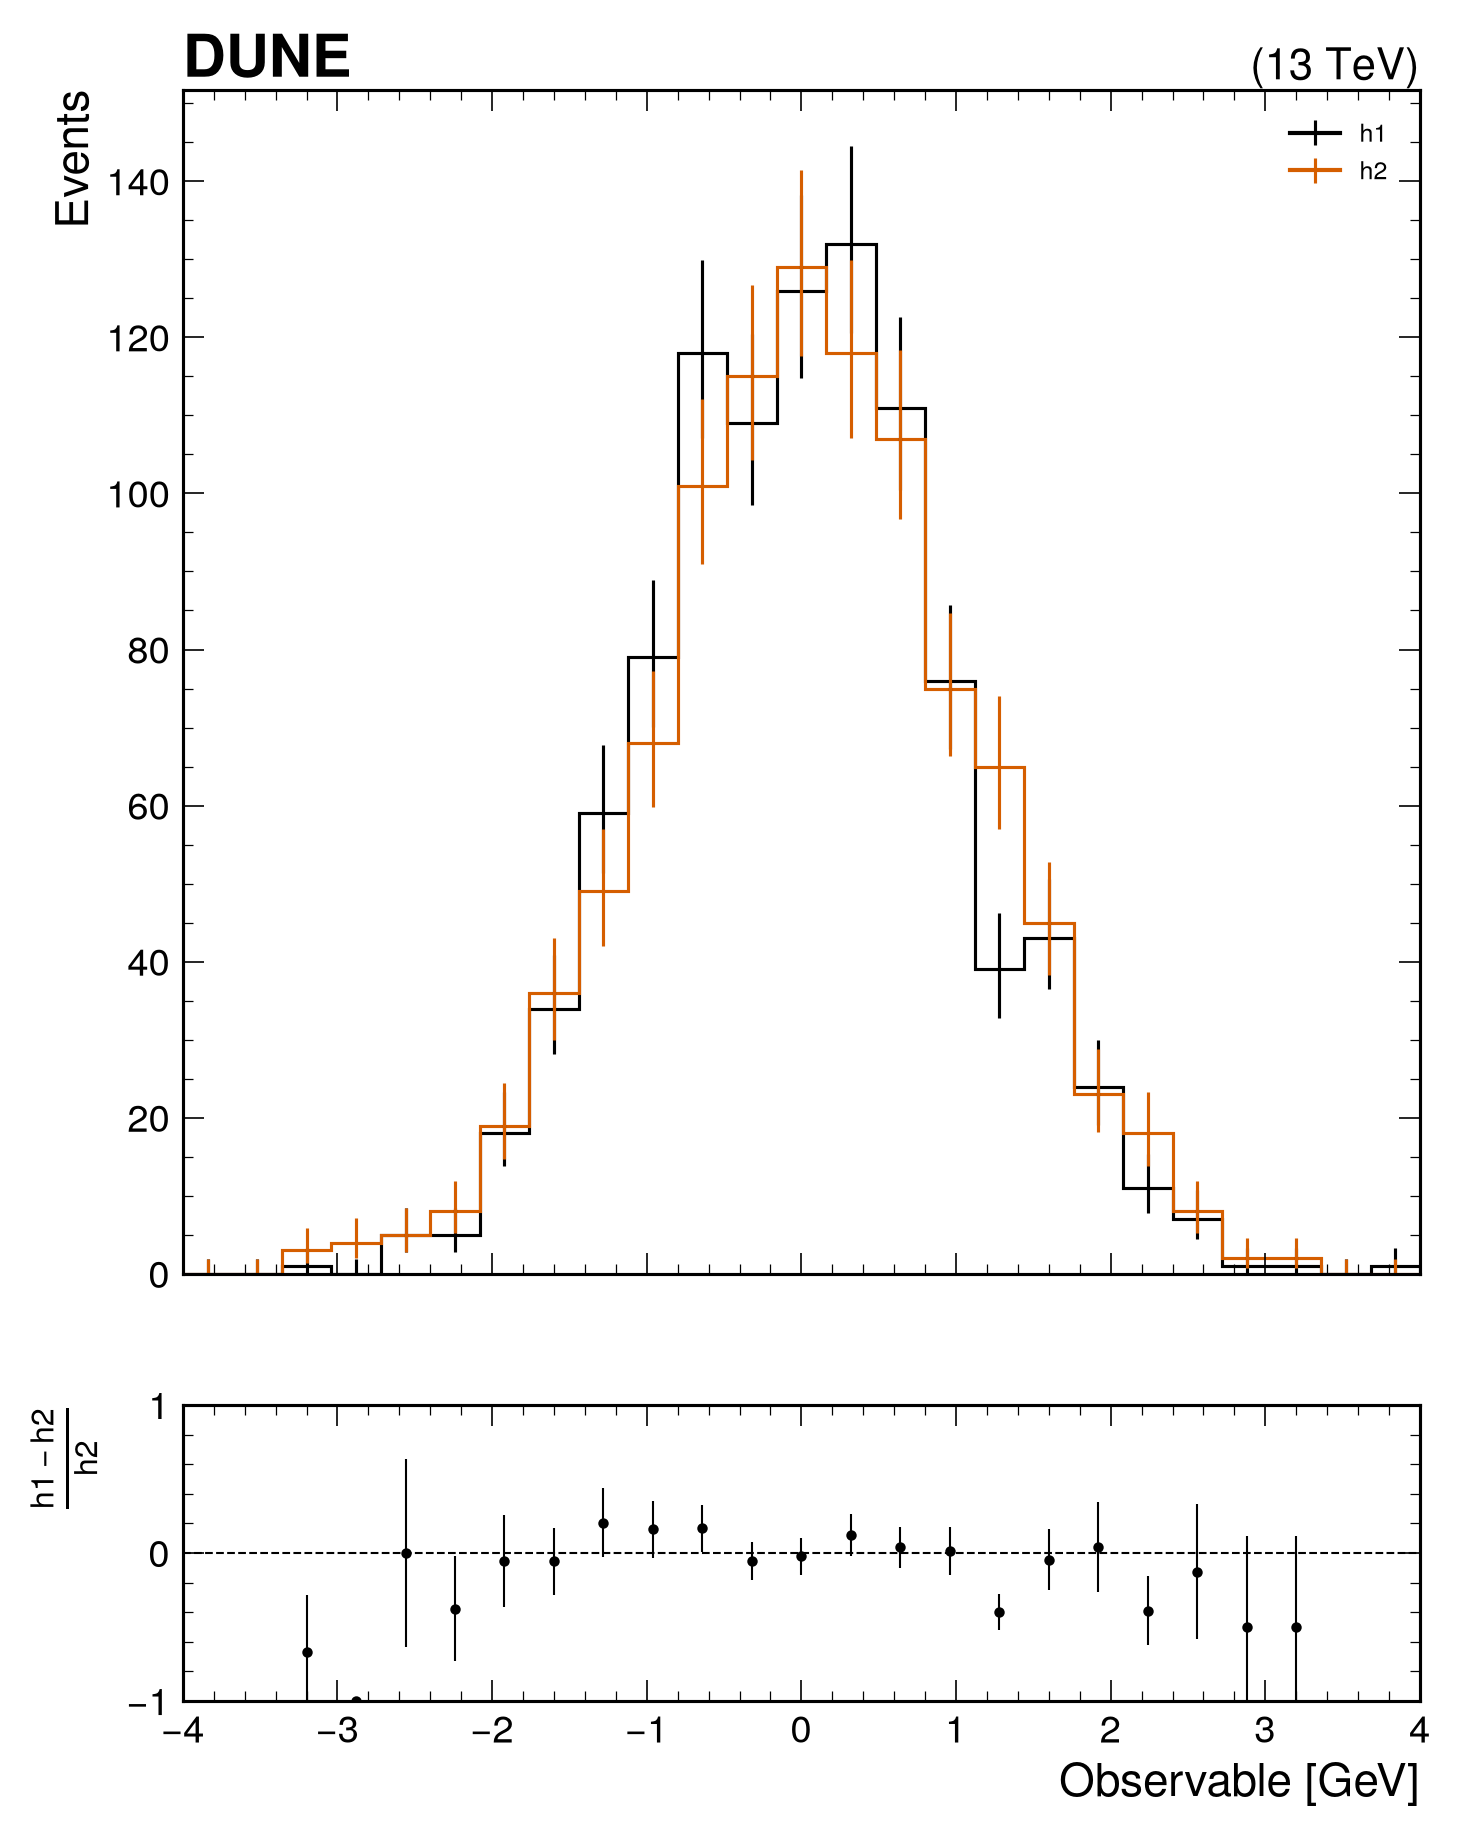
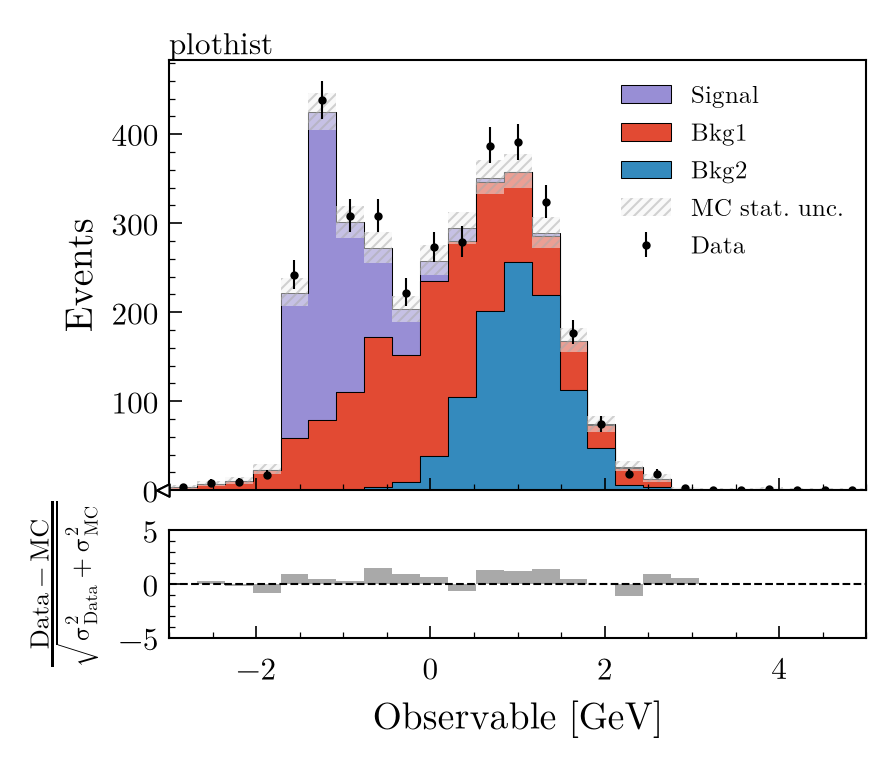
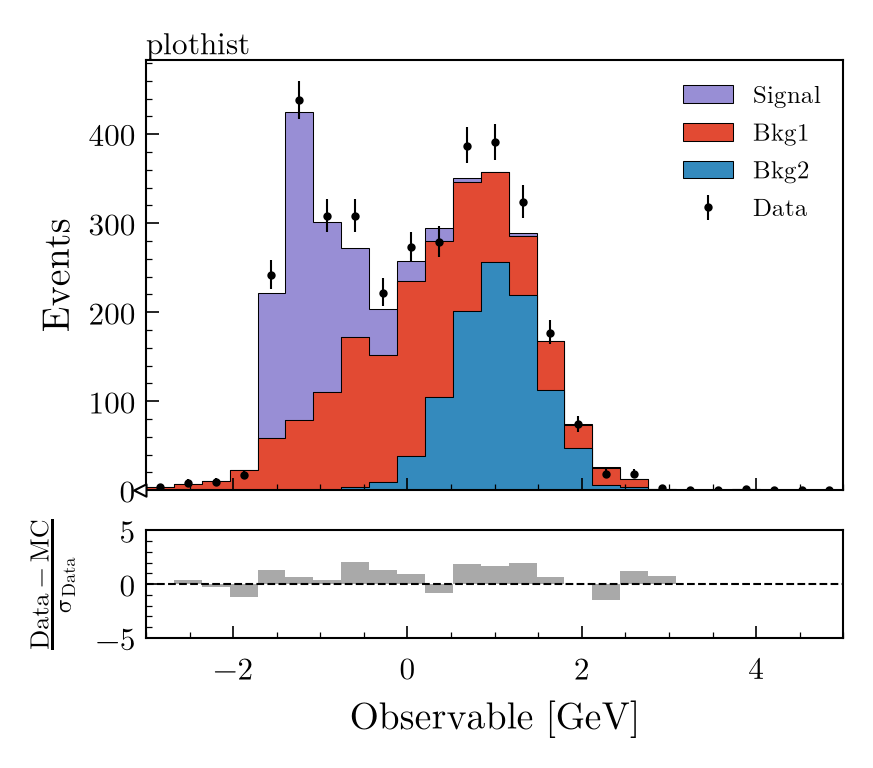
ratio: \(\frac{\text{h1}}{\text{h2}}\)split_ratio: same as ratio, but the uncertainties ofh1andh2are shown separately in the comparison panel (used extensively in data/model comparisons, see below)pull: \(\frac{\text{h1} - \text{h2}}{\sqrt{\sigma_{\text{h1}}^2 + \sigma_{\text{h2}}^2}}\)difference: \(\text{h1} - \text{h2}\)relative_difference: \(\frac{\text{h1} - \text{h2}}{\text{h2}}\)asymmetry: \(\frac{\text{h1} - \text{h2}}{\text{h1} + \text{h2}}\)efficiency: \(\frac{\text{h1}}{\text{h2}}\) (with uncertainties from eq.19 here)
# Generate sample data and model
x1 = np.random.normal(0, 1, 1000)
x2 = np.random.normal(0, 1.05, 1000)
h1 = hist.new.Reg(25, -4, 4).Weight().fill(x1)
h2 = hist.new.Reg(25, -4, 4).Weight().fill(x2)

# Create comparison plot
fig, ax_main, ax_comp = mh.comp.hists(
 h1,
 h2,
 comparison='ratio',
 xlabel='Observable [GeV]',
 ylabel='Events',
 h1_label='h1',
 h2_label='h2'
)
# Generate sample data and model
x1 = np.random.normal(0, 1, 1000)
x2 = np.random.normal(0, 1.05, 1000)
h1 = hist.new.Reg(25, -4, 4).Weight().fill(x1)
h2 = hist.new.Reg(25, -4, 4).Weight().fill(x2)

# Create comparison plot
fig, ax_main, ax_comp = mh.comp.hists(
 h1,
 h2,
 comparison='split_ratio',
 xlabel='Observable [GeV]',
 ylabel='Events',
 h1_label='h1',
 h2_label='h2'
)
# Generate sample data and model
x1 = np.random.normal(0, 1, 1000)
x2 = np.random.normal(0, 1.05, 1000)
h1 = hist.new.Reg(25, -4, 4).Weight().fill(x1)
h2 = hist.new.Reg(25, -4, 4).Weight().fill(x2)

# Create comparison plot
fig, ax_main, ax_comp = mh.comp.hists(
 h1,
 h2,
 comparison='pull',
 xlabel='Observable [GeV]',
 ylabel='Events',
 h1_label='h1',
 h2_label='h2'
)
# Generate sample data and model
x1 = np.random.normal(0, 1, 1000)
x2 = np.random.normal(0, 1.05, 1000)
h1 = hist.new.Reg(25, -4, 4).Weight().fill(x1)
h2 = hist.new.Reg(25, -4, 4).Weight().fill(x2)

# Create comparison plot
fig, ax_main, ax_comp = mh.comp.hists(
 h1,
 h2,
 comparison='difference',
 xlabel='Observable [GeV]',
 ylabel='Events',
 h1_label='h1',
 h2_label='h2'
)
# Generate sample data and model
x1 = np.random.normal(0, 1, 1000)
x2 = np.random.normal(0, 1.05, 1000)
h1 = hist.new.Reg(25, -4, 4).Weight().fill(x1)
h2 = hist.new.Reg(25, -4, 4).Weight().fill(x2)

# Create comparison plot
fig, ax_main, ax_comp = mh.comp.hists(
 h1,
 h2,
 comparison='relative_difference',
 xlabel='Observable [GeV]',
 ylabel='Events',
 h1_label='h1',
 h2_label='h2'
)
# Generate sample data and model
x1 = np.random.normal(0, 1, 1000)
x2 = np.random.normal(0, 1.05, 1000)
h1 = hist.new.Reg(25, -4, 4).Weight().fill(x1)
h2 = hist.new.Reg(25, -4, 4).Weight().fill(x2)

# Create comparison plot
fig, ax_main, ax_comp = mh.comp.hists(
 h1,
 h2,
 comparison='asymmetry',
 xlabel='Observable [GeV]',
 ylabel='Events',
 h1_label='h1',
 h2_label='h2'
)
# Generate sample data and model
x2 = np.random.normal(0, 1, 1000)
x1 = np.random.choice(x2, size=500, replace=False)
h1 = hist.new.Reg(25, -4, 4).Weight().fill(x1) # h1 needs to be a subset of h2
h2 = hist.new.Reg(25, -4, 4).Weight().fill(x2)

# Create comparison plot
fig, ax_main, ax_comp = mh.comp.hists(
 h1,
 h2,
 comparison='efficiency',
 xlabel='Observable [GeV]',
 ylabel='Events',
 h1_label='h1',
 h2_label='h2'
)
# Generate sample data and model
x1 = np.random.normal(0, 1, 1000)
x2 = np.random.normal(0, 1.05, 1000)
h1 = hist.new.Reg(25, -4, 4).Weight().fill(x1)
h2 = hist.new.Reg(25, -4, 4).Weight().fill(x2)

# Create comparison plot
fig, ax_main, ax_comp = mh.comp.hists(
 h1,
 h2,
 comparison='ratio',
 xlabel='Observable [GeV]',
 ylabel='Events',
 h1_label='h1',
 h2_label='h2'
)
txt_obj = mh.add_text('plothist', loc='over left', ax=ax_main)
# Generate sample data and model
x1 = np.random.normal(0, 1, 1000)
x2 = np.random.normal(0, 1.05, 1000)
h1 = hist.new.Reg(25, -4, 4).Weight().fill(x1)
h2 = hist.new.Reg(25, -4, 4).Weight().fill(x2)

# Create comparison plot
fig, ax_main, ax_comp = mh.comp.hists(
 h1,
 h2,
 comparison='split_ratio',
 xlabel='Observable [GeV]',
 ylabel='Events',
 h1_label='h1',
 h2_label='h2'
)
txt_obj = mh.add_text('plothist', loc='over left', ax=ax_main)
# Generate sample data and model
x1 = np.random.normal(0, 1, 1000)
x2 = np.random.normal(0, 1.05, 1000)
h1 = hist.new.Reg(25, -4, 4).Weight().fill(x1)
h2 = hist.new.Reg(25, -4, 4).Weight().fill(x2)

# Create comparison plot
fig, ax_main, ax_comp = mh.comp.hists(
 h1,
 h2,
 comparison='pull',
 xlabel='Observable [GeV]',
 ylabel='Events',
 h1_label='h1',
 h2_label='h2'
)
txt_obj = mh.add_text('plothist', loc='over left', ax=ax_main)
# Generate sample data and model
x1 = np.random.normal(0, 1, 1000)
x2 = np.random.normal(0, 1.05, 1000)
h1 = hist.new.Reg(25, -4, 4).Weight().fill(x1)
h2 = hist.new.Reg(25, -4, 4).Weight().fill(x2)

# Create comparison plot
fig, ax_main, ax_comp = mh.comp.hists(
 h1,
 h2,
 comparison='difference',
 xlabel='Observable [GeV]',
 ylabel='Events',
 h1_label='h1',
 h2_label='h2'
)
txt_obj = mh.add_text('plothist', loc='over left', ax=ax_main)
# Generate sample data and model
x1 = np.random.normal(0, 1, 1000)
x2 = np.random.normal(0, 1.05, 1000)
h1 = hist.new.Reg(25, -4, 4).Weight().fill(x1)
h2 = hist.new.Reg(25, -4, 4).Weight().fill(x2)

# Create comparison plot
fig, ax_main, ax_comp = mh.comp.hists(
 h1,
 h2,
 comparison='relative_difference',
 xlabel='Observable [GeV]',
 ylabel='Events',
 h1_label='h1',
 h2_label='h2'
)
txt_obj = mh.add_text('plothist', loc='over left', ax=ax_main)
# Generate sample data and model
x1 = np.random.normal(0, 1, 1000)
x2 = np.random.normal(0, 1.05, 1000)
h1 = hist.new.Reg(25, -4, 4).Weight().fill(x1)
h2 = hist.new.Reg(25, -4, 4).Weight().fill(x2)

# Create comparison plot
fig, ax_main, ax_comp = mh.comp.hists(
 h1,
 h2,
 comparison='asymmetry',
 xlabel='Observable [GeV]',
 ylabel='Events',
 h1_label='h1',
 h2_label='h2'
)
txt_obj = mh.add_text('plothist', loc='over left', ax=ax_main)
# Generate sample data and model
x2 = np.random.normal(0, 1, 1000)
x1 = np.random.choice(x2, size=500, replace=False)
h1 = hist.new.Reg(25, -4, 4).Weight().fill(x1) # h1 needs to be a subset of h2
h2 = hist.new.Reg(25, -4, 4).Weight().fill(x2)

# Create comparison plot
fig, ax_main, ax_comp = mh.comp.hists(
 h1,
 h2,
 comparison='efficiency',
 xlabel='Observable [GeV]',
 ylabel='Events',
 h1_label='h1',
 h2_label='h2'
)
txt_obj = mh.add_text('plothist', loc='over left', ax=ax_main)
# Generate sample data and model
x1 = np.random.normal(0, 1, 1000)
x2 = np.random.normal(0, 1.05, 1000)
h1 = hist.new.Reg(25, -4, 4).Weight().fill(x1)
h2 = hist.new.Reg(25, -4, 4).Weight().fill(x2)

# Create comparison plot
fig, ax_main, ax_comp = mh.comp.hists(
 h1,
 h2,
 comparison='ratio',
 xlabel='Observable [GeV]',
 ylabel='Events',
 h1_label='h1',
 h2_label='h2'
)
mh.cms.label(data=True, ax=ax_main)
# Generate sample data and model
x1 = np.random.normal(0, 1, 1000)
x2 = np.random.normal(0, 1.05, 1000)
h1 = hist.new.Reg(25, -4, 4).Weight().fill(x1)
h2 = hist.new.Reg(25, -4, 4).Weight().fill(x2)

# Create comparison plot
fig, ax_main, ax_comp = mh.comp.hists(
 h1,
 h2,
 comparison='split_ratio',
 xlabel='Observable [GeV]',
 ylabel='Events',
 h1_label='h1',
 h2_label='h2'
)
mh.cms.label(data=True, ax=ax_main)
# Generate sample data and model
x1 = np.random.normal(0, 1, 1000)
x2 = np.random.normal(0, 1.05, 1000)
h1 = hist.new.Reg(25, -4, 4).Weight().fill(x1)
h2 = hist.new.Reg(25, -4, 4).Weight().fill(x2)

# Create comparison plot
fig, ax_main, ax_comp = mh.comp.hists(
 h1,
 h2,
 comparison='pull',
 xlabel='Observable [GeV]',
 ylabel='Events',
 h1_label='h1',
 h2_label='h2'
)
mh.cms.label(data=True, ax=ax_main)
# Generate sample data and model
x1 = np.random.normal(0, 1, 1000)
x2 = np.random.normal(0, 1.05, 1000)
h1 = hist.new.Reg(25, -4, 4).Weight().fill(x1)
h2 = hist.new.Reg(25, -4, 4).Weight().fill(x2)

# Create comparison plot
fig, ax_main, ax_comp = mh.comp.hists(
 h1,
 h2,
 comparison='difference',
 xlabel='Observable [GeV]',
 ylabel='Events',
 h1_label='h1',
 h2_label='h2'
)
mh.cms.label(data=True, ax=ax_main)
# Generate sample data and model
x1 = np.random.normal(0, 1, 1000)
x2 = np.random.normal(0, 1.05, 1000)
h1 = hist.new.Reg(25, -4, 4).Weight().fill(x1)
h2 = hist.new.Reg(25, -4, 4).Weight().fill(x2)

# Create comparison plot
fig, ax_main, ax_comp = mh.comp.hists(
 h1,
 h2,
 comparison='relative_difference',
 xlabel='Observable [GeV]',
 ylabel='Events',
 h1_label='h1',
 h2_label='h2'
)
mh.cms.label(data=True, ax=ax_main)
# Generate sample data and model
x1 = np.random.normal(0, 1, 1000)
x2 = np.random.normal(0, 1.05, 1000)
h1 = hist.new.Reg(25, -4, 4).Weight().fill(x1)
h2 = hist.new.Reg(25, -4, 4).Weight().fill(x2)

# Create comparison plot
fig, ax_main, ax_comp = mh.comp.hists(
 h1,
 h2,
 comparison='asymmetry',
 xlabel='Observable [GeV]',
 ylabel='Events',
 h1_label='h1',
 h2_label='h2'
)
mh.cms.label(data=True, ax=ax_main)
# Generate sample data and model
x2 = np.random.normal(0, 1, 1000)
x1 = np.random.choice(x2, size=500, replace=False)
h1 = hist.new.Reg(25, -4, 4).Weight().fill(x1) # h1 needs to be a subset of h2
h2 = hist.new.Reg(25, -4, 4).Weight().fill(x2)

# Create comparison plot
fig, ax_main, ax_comp = mh.comp.hists(
 h1,
 h2,
 comparison='efficiency',
 xlabel='Observable [GeV]',
 ylabel='Events',
 h1_label='h1',
 h2_label='h2'
)
mh.cms.label(data=True, ax=ax_main)
# Generate sample data and model
x1 = np.random.normal(0, 1, 1000)
x2 = np.random.normal(0, 1.05, 1000)
h1 = hist.new.Reg(25, -4, 4).Weight().fill(x1)
h2 = hist.new.Reg(25, -4, 4).Weight().fill(x2)

# Create comparison plot
fig, ax_main, ax_comp = mh.comp.hists(
 h1,
 h2,
 comparison='ratio',
 xlabel='Observable [GeV]',
 ylabel='Events',
 h1_label='h1',
 h2_label='h2'
)
mh.atlas.label(data=True, ax=ax_main)
mh.mpl_magic(soft_fail=True)
# Generate sample data and model
x1 = np.random.normal(0, 1, 1000)
x2 = np.random.normal(0, 1.05, 1000)
h1 = hist.new.Reg(25, -4, 4).Weight().fill(x1)
h2 = hist.new.Reg(25, -4, 4).Weight().fill(x2)

# Create comparison plot
fig, ax_main, ax_comp = mh.comp.hists(
 h1,
 h2,
 comparison='split_ratio',
 xlabel='Observable [GeV]',
 ylabel='Events',
 h1_label='h1',
 h2_label='h2'
)
mh.atlas.label(data=True, ax=ax_main)
mh.mpl_magic(soft_fail=True)
# Generate sample data and model
x1 = np.random.normal(0, 1, 1000)
x2 = np.random.normal(0, 1.05, 1000)
h1 = hist.new.Reg(25, -4, 4).Weight().fill(x1)
h2 = hist.new.Reg(25, -4, 4).Weight().fill(x2)

# Create comparison plot
fig, ax_main, ax_comp = mh.comp.hists(
 h1,
 h2,
 comparison='pull',
 xlabel='Observable [GeV]',
 ylabel='Events',
 h1_label='h1',
 h2_label='h2'
)
mh.atlas.label(data=True, ax=ax_main)
mh.mpl_magic(soft_fail=True)
# Generate sample data and model
x1 = np.random.normal(0, 1, 1000)
x2 = np.random.normal(0, 1.05, 1000)
h1 = hist.new.Reg(25, -4, 4).Weight().fill(x1)
h2 = hist.new.Reg(25, -4, 4).Weight().fill(x2)

# Create comparison plot
fig, ax_main, ax_comp = mh.comp.hists(
 h1,
 h2,
 comparison='difference',
 xlabel='Observable [GeV]',
 ylabel='Events',
 h1_label='h1',
 h2_label='h2'
)
mh.atlas.label(data=True, ax=ax_main)
mh.mpl_magic(soft_fail=True)
# Generate sample data and model
x1 = np.random.normal(0, 1, 1000)
x2 = np.random.normal(0, 1.05, 1000)
h1 = hist.new.Reg(25, -4, 4).Weight().fill(x1)
h2 = hist.new.Reg(25, -4, 4).Weight().fill(x2)

# Create comparison plot
fig, ax_main, ax_comp = mh.comp.hists(
 h1,
 h2,
 comparison='relative_difference',
 xlabel='Observable [GeV]',
 ylabel='Events',
 h1_label='h1',
 h2_label='h2'
)
mh.atlas.label(data=True, ax=ax_main)
mh.mpl_magic(soft_fail=True)
# Generate sample data and model
x1 = np.random.normal(0, 1, 1000)
x2 = np.random.normal(0, 1.05, 1000)
h1 = hist.new.Reg(25, -4, 4).Weight().fill(x1)
h2 = hist.new.Reg(25, -4, 4).Weight().fill(x2)

# Create comparison plot
fig, ax_main, ax_comp = mh.comp.hists(
 h1,
 h2,
 comparison='asymmetry',
 xlabel='Observable [GeV]',
 ylabel='Events',
 h1_label='h1',
 h2_label='h2'
)
mh.atlas.label(data=True, ax=ax_main)
mh.mpl_magic(soft_fail=True)
# Generate sample data and model
x2 = np.random.normal(0, 1, 1000)
x1 = np.random.choice(x2, size=500, replace=False)
h1 = hist.new.Reg(25, -4, 4).Weight().fill(x1) # h1 needs to be a subset of h2
h2 = hist.new.Reg(25, -4, 4).Weight().fill(x2)

# Create comparison plot
fig, ax_main, ax_comp = mh.comp.hists(
 h1,
 h2,
 comparison='efficiency',
 xlabel='Observable [GeV]',
 ylabel='Events',
 h1_label='h1',
 h2_label='h2'
)
mh.atlas.label(data=True, ax=ax_main)
mh.mpl_magic(soft_fail=True)
# Generate sample data and model
x1 = np.random.normal(0, 1, 1000)
x2 = np.random.normal(0, 1.05, 1000)
h1 = hist.new.Reg(25, -4, 4).Weight().fill(x1)
h2 = hist.new.Reg(25, -4, 4).Weight().fill(x2)

# Create comparison plot
fig, ax_main, ax_comp = mh.comp.hists(
 h1,
 h2,
 comparison='ratio',
 xlabel='Observable [GeV]',
 ylabel='Events',
 h1_label='h1',
 h2_label='h2'
)
mh.lhcb.label(data=True, ax=ax_main)
# Generate sample data and model
x1 = np.random.normal(0, 1, 1000)
x2 = np.random.normal(0, 1.05, 1000)
h1 = hist.new.Reg(25, -4, 4).Weight().fill(x1)
h2 = hist.new.Reg(25, -4, 4).Weight().fill(x2)

# Create comparison plot
fig, ax_main, ax_comp = mh.comp.hists(
 h1,
 h2,
 comparison='split_ratio',
 xlabel='Observable [GeV]',
 ylabel='Events',
 h1_label='h1',
 h2_label='h2'
)
mh.lhcb.label(data=True, ax=ax_main)
# Generate sample data and model
x1 = np.random.normal(0, 1, 1000)
x2 = np.random.normal(0, 1.05, 1000)
h1 = hist.new.Reg(25, -4, 4).Weight().fill(x1)
h2 = hist.new.Reg(25, -4, 4).Weight().fill(x2)

# Create comparison plot
fig, ax_main, ax_comp = mh.comp.hists(
 h1,
 h2,
 comparison='pull',
 xlabel='Observable [GeV]',
 ylabel='Events',
 h1_label='h1',
 h2_label='h2'
)
mh.lhcb.label(data=True, ax=ax_main)
# Generate sample data and model
x1 = np.random.normal(0, 1, 1000)
x2 = np.random.normal(0, 1.05, 1000)
h1 = hist.new.Reg(25, -4, 4).Weight().fill(x1)
h2 = hist.new.Reg(25, -4, 4).Weight().fill(x2)

# Create comparison plot
fig, ax_main, ax_comp = mh.comp.hists(
 h1,
 h2,
 comparison='difference',
 xlabel='Observable [GeV]',
 ylabel='Events',
 h1_label='h1',
 h2_label='h2'
)
mh.lhcb.label(data=True, ax=ax_main)
# Generate sample data and model
x1 = np.random.normal(0, 1, 1000)
x2 = np.random.normal(0, 1.05, 1000)
h1 = hist.new.Reg(25, -4, 4).Weight().fill(x1)
h2 = hist.new.Reg(25, -4, 4).Weight().fill(x2)

# Create comparison plot
fig, ax_main, ax_comp = mh.comp.hists(
 h1,
 h2,
 comparison='relative_difference',
 xlabel='Observable [GeV]',
 ylabel='Events',
 h1_label='h1',
 h2_label='h2'
)
mh.lhcb.label(data=True, ax=ax_main)
# Generate sample data and model
x1 = np.random.normal(0, 1, 1000)
x2 = np.random.normal(0, 1.05, 1000)
h1 = hist.new.Reg(25, -4, 4).Weight().fill(x1)
h2 = hist.new.Reg(25, -4, 4).Weight().fill(x2)

# Create comparison plot
fig, ax_main, ax_comp = mh.comp.hists(
 h1,
 h2,
 comparison='asymmetry',
 xlabel='Observable [GeV]',
 ylabel='Events',
 h1_label='h1',
 h2_label='h2'
)
mh.lhcb.label(data=True, ax=ax_main)
# Generate sample data and model
x2 = np.random.normal(0, 1, 1000)
x1 = np.random.choice(x2, size=500, replace=False)
h1 = hist.new.Reg(25, -4, 4).Weight().fill(x1) # h1 needs to be a subset of h2
h2 = hist.new.Reg(25, -4, 4).Weight().fill(x2)

# Create comparison plot
fig, ax_main, ax_comp = mh.comp.hists(
 h1,
 h2,
 comparison='efficiency',
 xlabel='Observable [GeV]',
 ylabel='Events',
 h1_label='h1',
 h2_label='h2'
)
mh.lhcb.label(data=True, ax=ax_main)
# Generate sample data and model
x1 = np.random.normal(0, 1, 1000)
x2 = np.random.normal(0, 1.05, 1000)
h1 = hist.new.Reg(25, -4, 4).Weight().fill(x1)
h2 = hist.new.Reg(25, -4, 4).Weight().fill(x2)

# Create comparison plot
fig, ax_main, ax_comp = mh.comp.hists(
 h1,
 h2,
 comparison='ratio',
 xlabel='Observable [GeV]',
 ylabel='Events',
 h1_label='h1',
 h2_label='h2'
)
mh.alice.label(data=True, ax=ax_main)
mh.mpl_magic(soft_fail=True)
# Generate sample data and model
x1 = np.random.normal(0, 1, 1000)
x2 = np.random.normal(0, 1.05, 1000)
h1 = hist.new.Reg(25, -4, 4).Weight().fill(x1)
h2 = hist.new.Reg(25, -4, 4).Weight().fill(x2)

# Create comparison plot
fig, ax_main, ax_comp = mh.comp.hists(
 h1,
 h2,
 comparison='split_ratio',
 xlabel='Observable [GeV]',
 ylabel='Events',
 h1_label='h1',
 h2_label='h2'
)
mh.alice.label(data=True, ax=ax_main)
mh.mpl_magic(soft_fail=True)
# Generate sample data and model
x1 = np.random.normal(0, 1, 1000)
x2 = np.random.normal(0, 1.05, 1000)
h1 = hist.new.Reg(25, -4, 4).Weight().fill(x1)
h2 = hist.new.Reg(25, -4, 4).Weight().fill(x2)

# Create comparison plot
fig, ax_main, ax_comp = mh.comp.hists(
 h1,
 h2,
 comparison='pull',
 xlabel='Observable [GeV]',
 ylabel='Events',
 h1_label='h1',
 h2_label='h2'
)
mh.alice.label(data=True, ax=ax_main)
mh.mpl_magic(soft_fail=True)
# Generate sample data and model
x1 = np.random.normal(0, 1, 1000)
x2 = np.random.normal(0, 1.05, 1000)
h1 = hist.new.Reg(25, -4, 4).Weight().fill(x1)
h2 = hist.new.Reg(25, -4, 4).Weight().fill(x2)

# Create comparison plot
fig, ax_main, ax_comp = mh.comp.hists(
 h1,
 h2,
 comparison='difference',
 xlabel='Observable [GeV]',
 ylabel='Events',
 h1_label='h1',
 h2_label='h2'
)
mh.alice.label(data=True, ax=ax_main)
mh.mpl_magic(soft_fail=True)
# Generate sample data and model
x1 = np.random.normal(0, 1, 1000)
x2 = np.random.normal(0, 1.05, 1000)
h1 = hist.new.Reg(25, -4, 4).Weight().fill(x1)
h2 = hist.new.Reg(25, -4, 4).Weight().fill(x2)

# Create comparison plot
fig, ax_main, ax_comp = mh.comp.hists(
 h1,
 h2,
 comparison='relative_difference',
 xlabel='Observable [GeV]',
 ylabel='Events',
 h1_label='h1',
 h2_label='h2'
)
mh.alice.label(data=True, ax=ax_main)
mh.mpl_magic(soft_fail=True)
# Generate sample data and model
x1 = np.random.normal(0, 1, 1000)
x2 = np.random.normal(0, 1.05, 1000)
h1 = hist.new.Reg(25, -4, 4).Weight().fill(x1)
h2 = hist.new.Reg(25, -4, 4).Weight().fill(x2)

# Create comparison plot
fig, ax_main, ax_comp = mh.comp.hists(
 h1,
 h2,
 comparison='asymmetry',
 xlabel='Observable [GeV]',
 ylabel='Events',
 h1_label='h1',
 h2_label='h2'
)
mh.alice.label(data=True, ax=ax_main)
mh.mpl_magic(soft_fail=True)
# Generate sample data and model
x2 = np.random.normal(0, 1, 1000)
x1 = np.random.choice(x2, size=500, replace=False)
h1 = hist.new.Reg(25, -4, 4).Weight().fill(x1) # h1 needs to be a subset of h2
h2 = hist.new.Reg(25, -4, 4).Weight().fill(x2)

# Create comparison plot
fig, ax_main, ax_comp = mh.comp.hists(
 h1,
 h2,
 comparison='efficiency',
 xlabel='Observable [GeV]',
 ylabel='Events',
 h1_label='h1',
 h2_label='h2'
)
mh.alice.label(data=True, ax=ax_main)
mh.mpl_magic(soft_fail=True)
# Generate sample data and model
x1 = np.random.normal(0, 1, 1000)
x2 = np.random.normal(0, 1.05, 1000)
h1 = hist.new.Reg(25, -4, 4).Weight().fill(x1)
h2 = hist.new.Reg(25, -4, 4).Weight().fill(x2)

# Create comparison plot
fig, ax_main, ax_comp = mh.comp.hists(
 h1,
 h2,
 comparison='ratio',
 xlabel='Observable [GeV]',
 ylabel='Events',
 h1_label='h1',
 h2_label='h2'
)
mh.dune.label(data=True, ax=ax_main)
# Generate sample data and model
x1 = np.random.normal(0, 1, 1000)
x2 = np.random.normal(0, 1.05, 1000)
h1 = hist.new.Reg(25, -4, 4).Weight().fill(x1)
h2 = hist.new.Reg(25, -4, 4).Weight().fill(x2)

# Create comparison plot
fig, ax_main, ax_comp = mh.comp.hists(
 h1,
 h2,
 comparison='split_ratio',
 xlabel='Observable [GeV]',
 ylabel='Events',
 h1_label='h1',
 h2_label='h2'
)
mh.dune.label(data=True, ax=ax_main)
# Generate sample data and model
x1 = np.random.normal(0, 1, 1000)
x2 = np.random.normal(0, 1.05, 1000)
h1 = hist.new.Reg(25, -4, 4).Weight().fill(x1)
h2 = hist.new.Reg(25, -4, 4).Weight().fill(x2)

# Create comparison plot
fig, ax_main, ax_comp = mh.comp.hists(
 h1,
 h2,
 comparison='pull',
 xlabel='Observable [GeV]',
 ylabel='Events',
 h1_label='h1',
 h2_label='h2'
)
mh.dune.label(data=True, ax=ax_main)
# Generate sample data and model
x1 = np.random.normal(0, 1, 1000)
x2 = np.random.normal(0, 1.05, 1000)
h1 = hist.new.Reg(25, -4, 4).Weight().fill(x1)
h2 = hist.new.Reg(25, -4, 4).Weight().fill(x2)

# Create comparison plot
fig, ax_main, ax_comp = mh.comp.hists(
 h1,
 h2,
 comparison='difference',
 xlabel='Observable [GeV]',
 ylabel='Events',
 h1_label='h1',
 h2_label='h2'
)
mh.dune.label(data=True, ax=ax_main)
# Generate sample data and model
x1 = np.random.normal(0, 1, 1000)
x2 = np.random.normal(0, 1.05, 1000)
h1 = hist.new.Reg(25, -4, 4).Weight().fill(x1)
h2 = hist.new.Reg(25, -4, 4).Weight().fill(x2)

# Create comparison plot
fig, ax_main, ax_comp = mh.comp.hists(
 h1,
 h2,
 comparison='relative_difference',
 xlabel='Observable [GeV]',
 ylabel='Events',
 h1_label='h1',
 h2_label='h2'
)
mh.dune.label(data=True, ax=ax_main)
# Generate sample data and model
x1 = np.random.normal(0, 1, 1000)
x2 = np.random.normal(0, 1.05, 1000)
h1 = hist.new.Reg(25, -4, 4).Weight().fill(x1)
h2 = hist.new.Reg(25, -4, 4).Weight().fill(x2)

# Create comparison plot
fig, ax_main, ax_comp = mh.comp.hists(
 h1,
 h2,
 comparison='asymmetry',
 xlabel='Observable [GeV]',
 ylabel='Events',
 h1_label='h1',
 h2_label='h2'
)
mh.dune.label(data=True, ax=ax_main)
# Generate sample data and model
x2 = np.random.normal(0, 1, 1000)
x1 = np.random.choice(x2, size=500, replace=False)
h1 = hist.new.Reg(25, -4, 4).Weight().fill(x1) # h1 needs to be a subset of h2
h2 = hist.new.Reg(25, -4, 4).Weight().fill(x2)

# Create comparison plot
fig, ax_main, ax_comp = mh.comp.hists(
 h1,
 h2,
 comparison='efficiency',
 xlabel='Observable [GeV]',
 ylabel='Events',
 h1_label='h1',
 h2_label='h2'
)
mh.dune.label(data=True, ax=ax_main)
Only plot the comparison panel¤
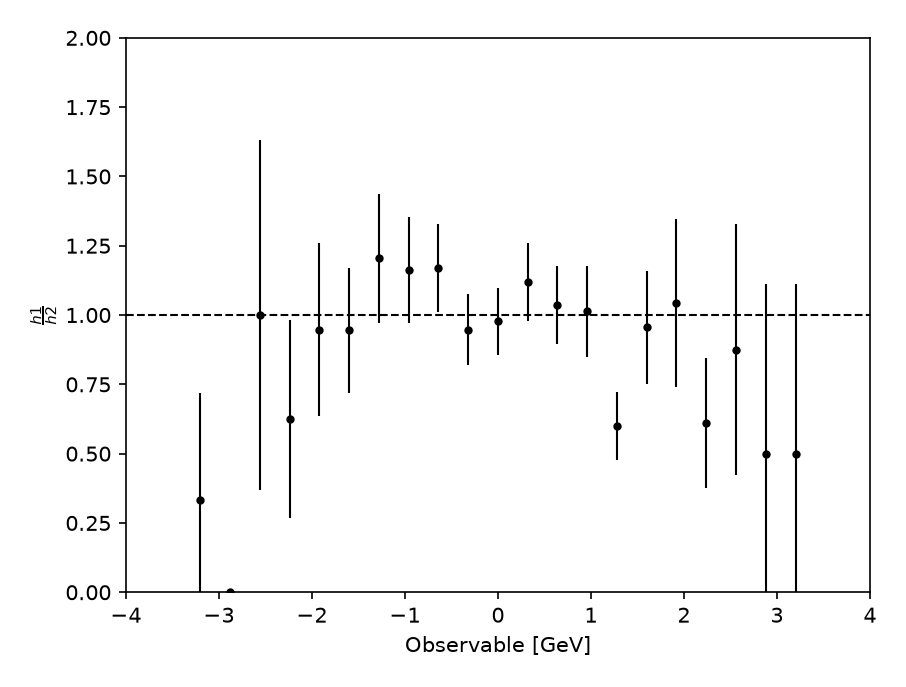
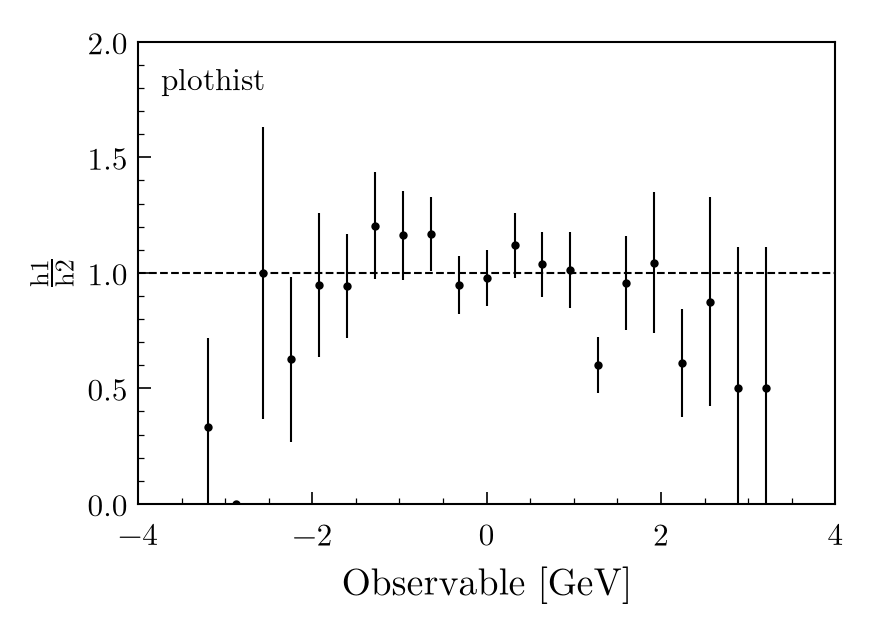
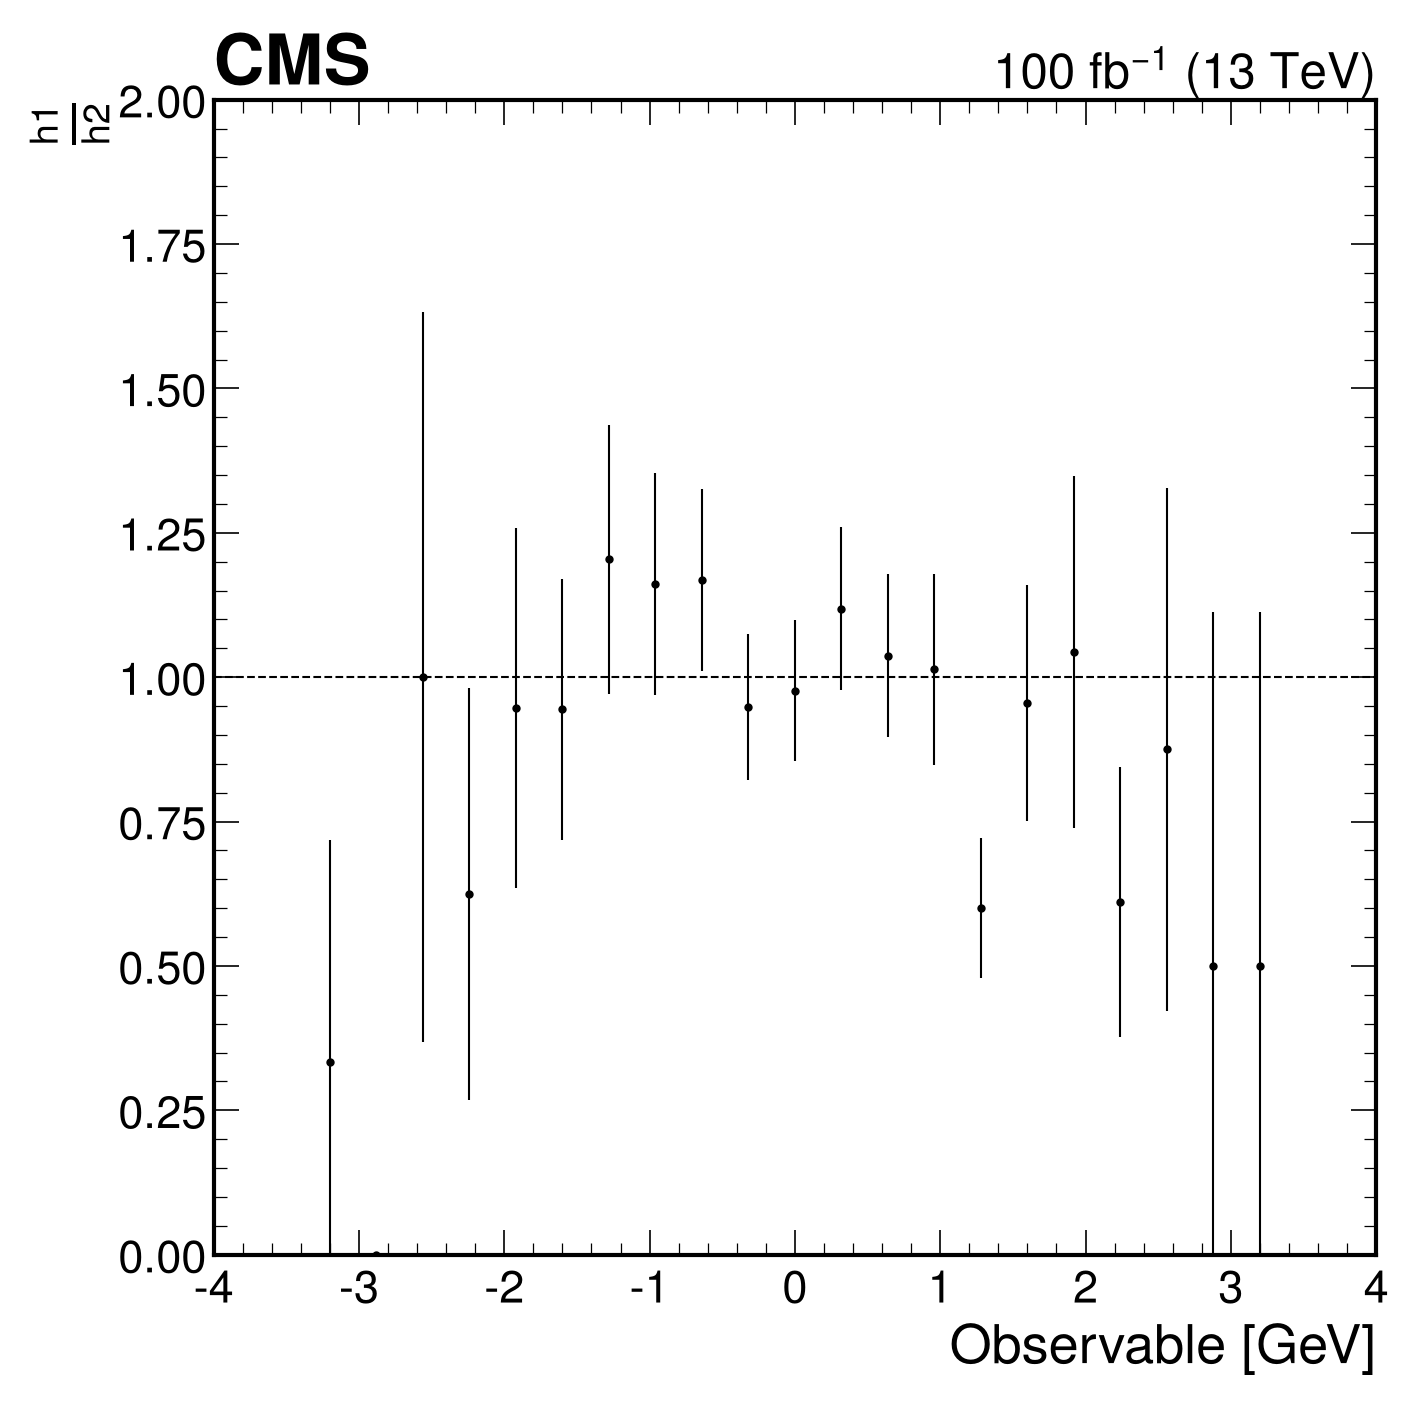
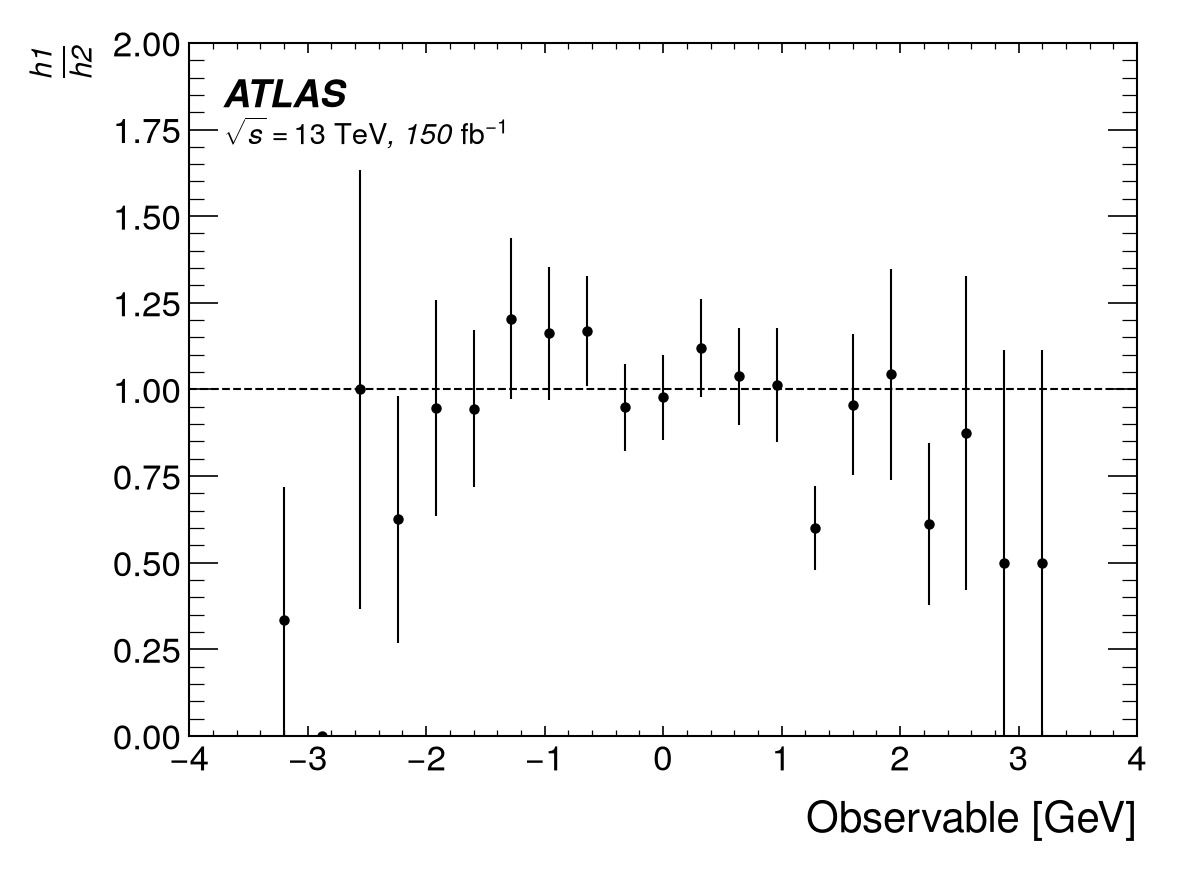
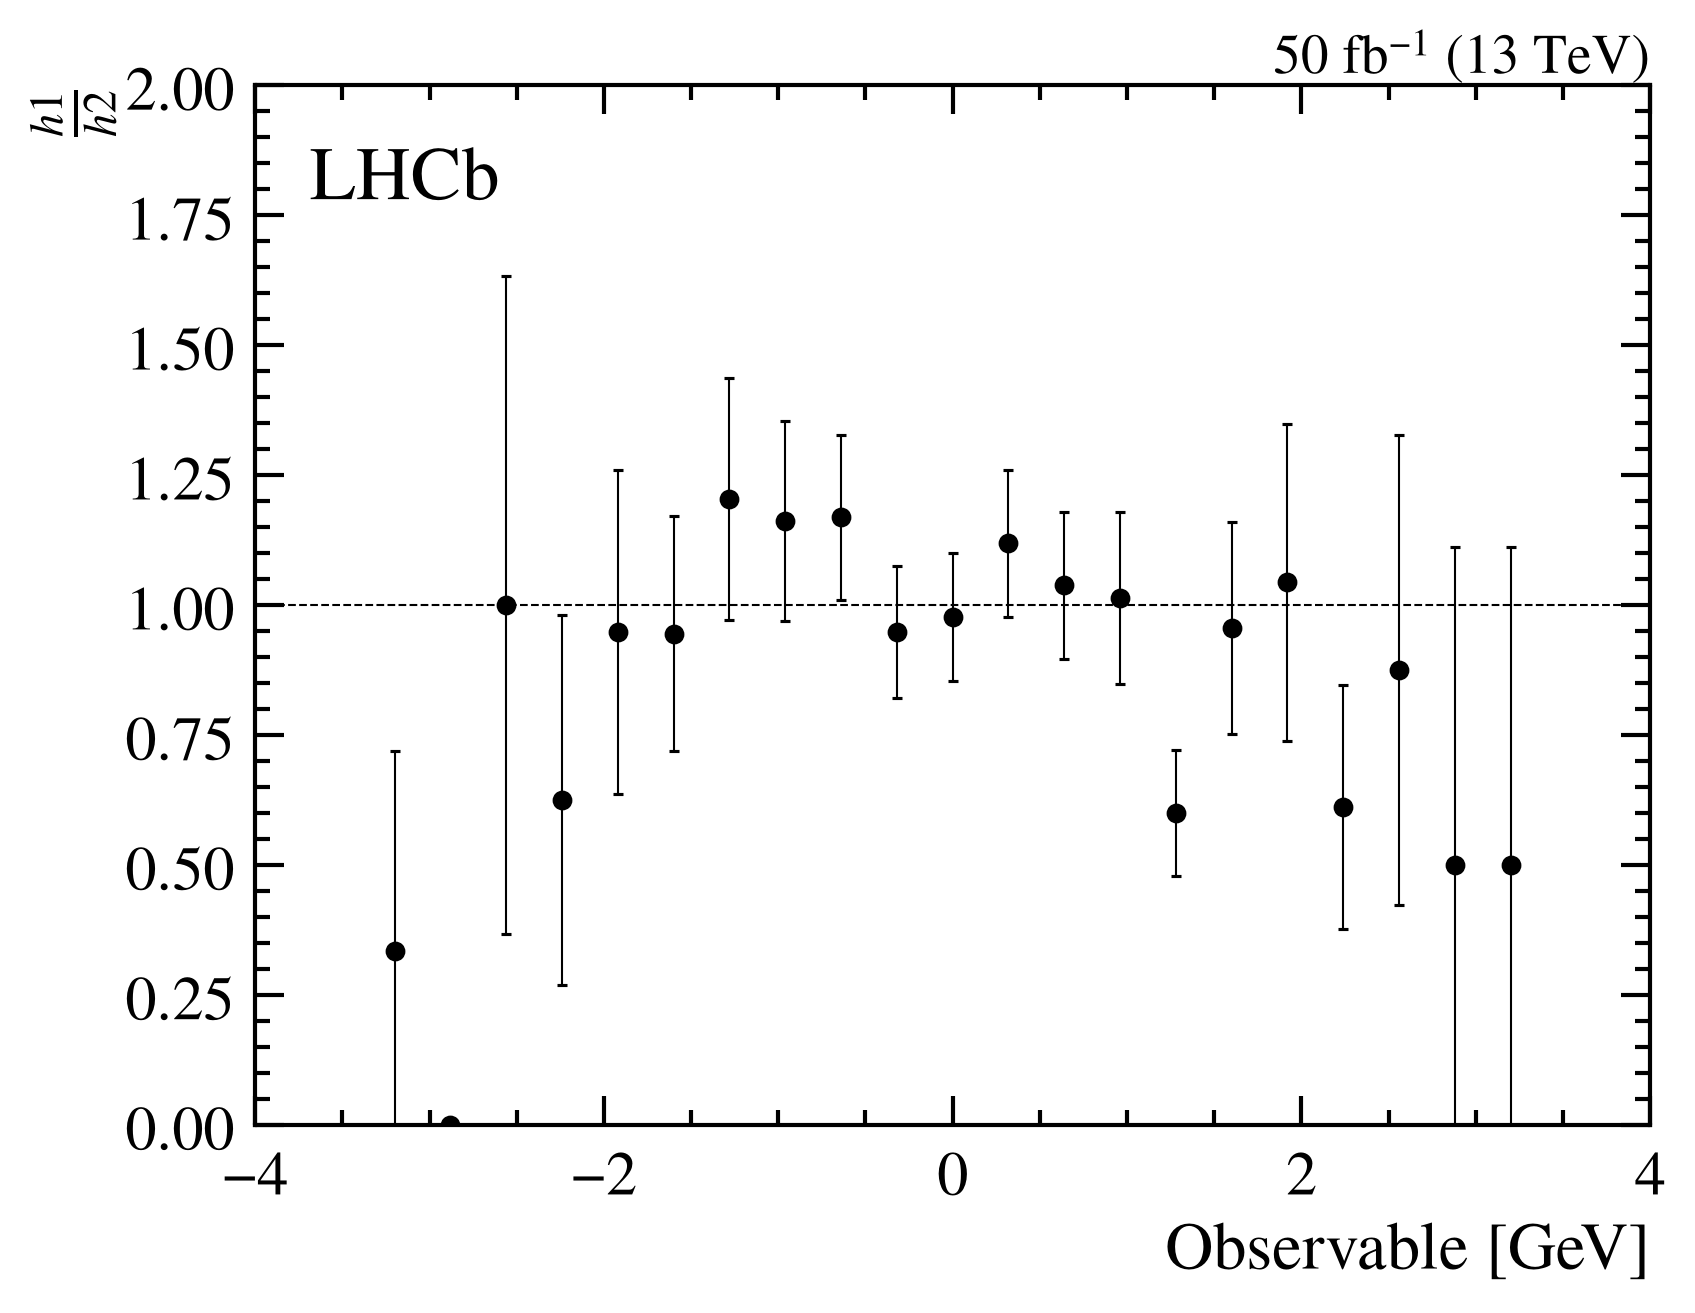
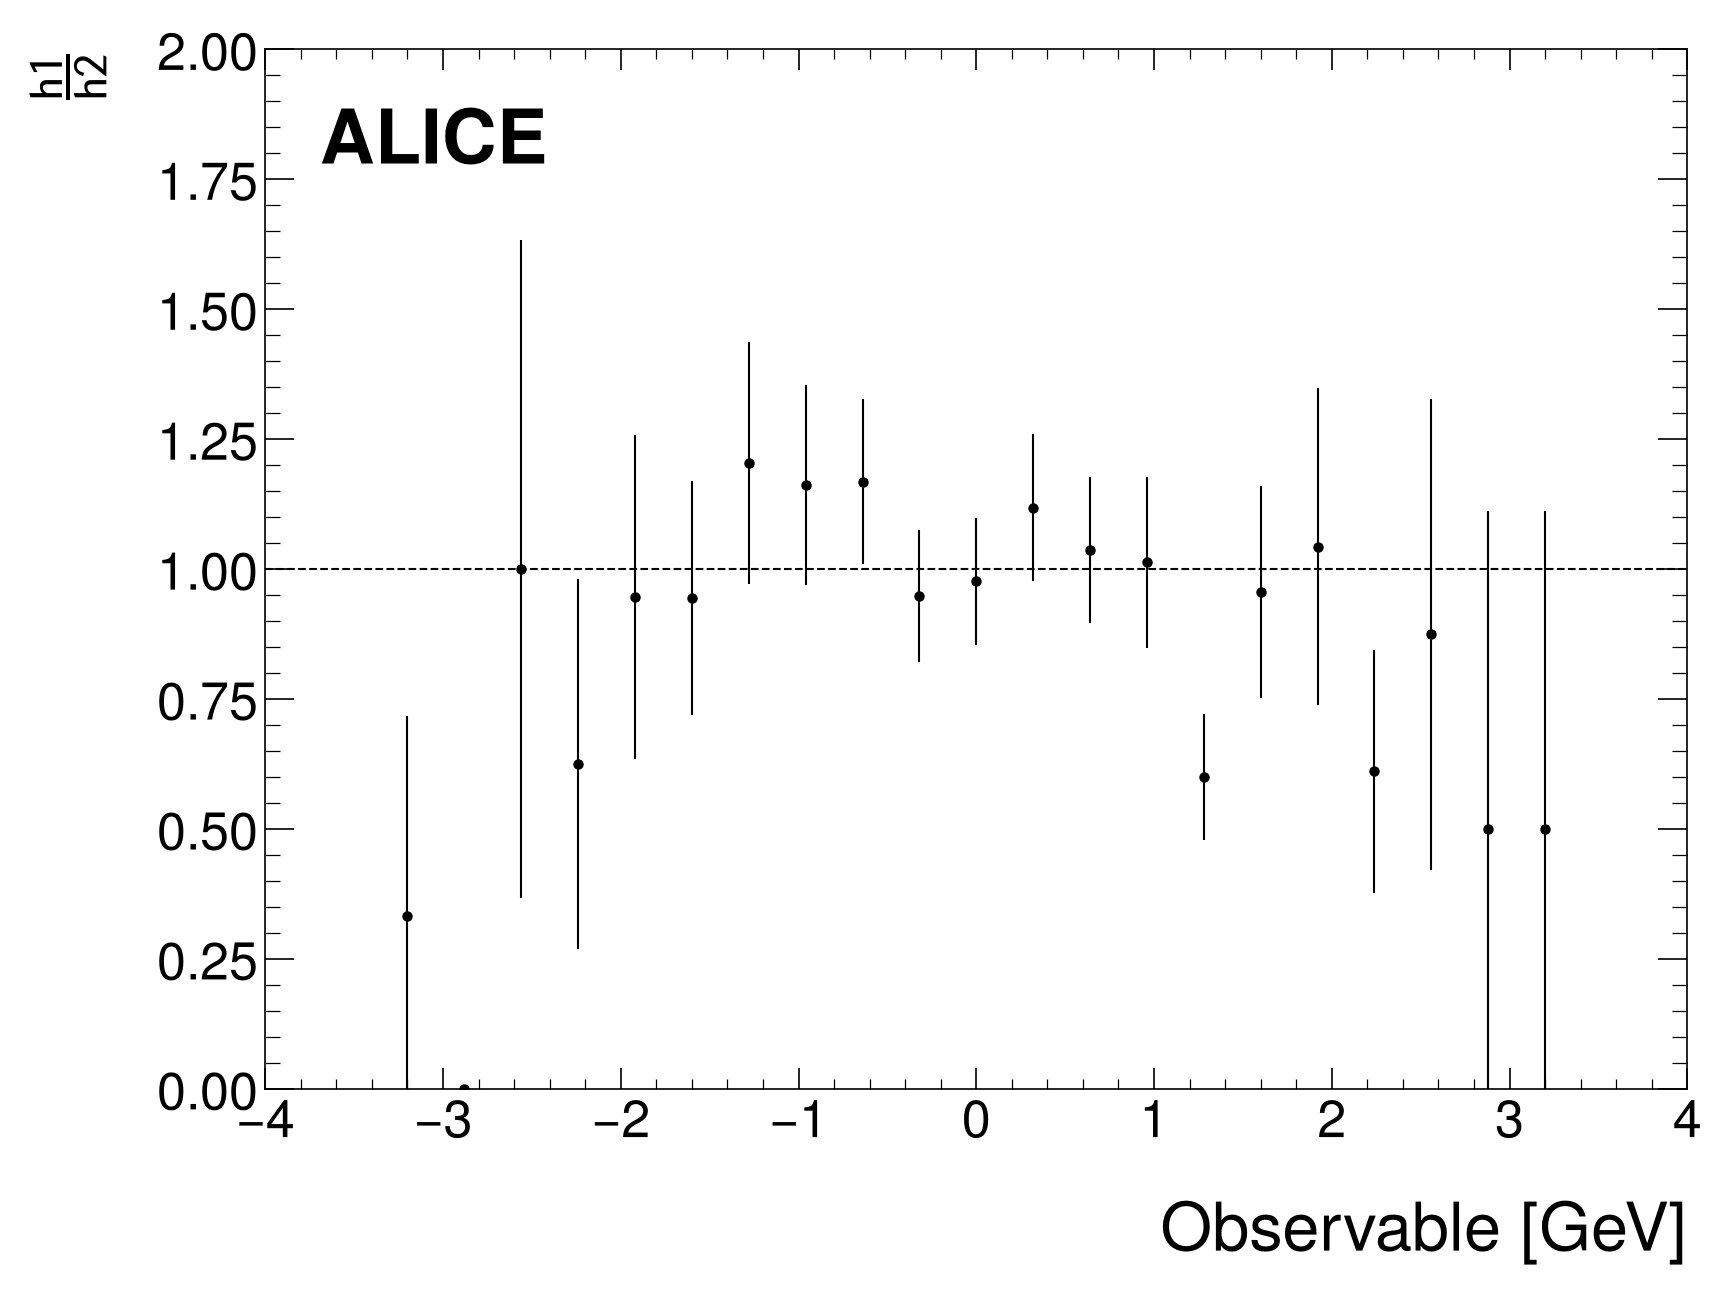
To only plot the comparison panel given two histograms, use mh.comp.comparison(). This function takes two histograms as input and creates a figure with only the comparison panel.
# Generate sample data and model
x1 = np.random.normal(0, 1, 1000)
x2 = np.random.normal(0, 1.05, 1000)
h1 = hist.new.Reg(25, -4, 4).Weight().fill(x1)
h2 = hist.new.Reg(25, -4, 4).Weight().fill(x2)

# Create comparison panel only
fig, ax = plt.subplots()

mh.comp.comparison(
 h1,
 h2,
 comparison='ratio',
 xlabel='Observable [GeV]',
 h1_label='h1',
 h2_label='h2',
 ax=ax
)
# Generate sample data and model
x1 = np.random.normal(0, 1, 1000)
x2 = np.random.normal(0, 1.05, 1000)
h1 = hist.new.Reg(25, -4, 4).Weight().fill(x1)
h2 = hist.new.Reg(25, -4, 4).Weight().fill(x2)

# Create comparison panel only
fig, ax = plt.subplots()

mh.comp.comparison(
 h1,
 h2,
 comparison='ratio',
 xlabel='Observable [GeV]',
 h1_label='h1',
 h2_label='h2',
 ax=ax
)
txt_obj = mh.add_text('plothist', ax=ax)
# Generate sample data and model
x1 = np.random.normal(0, 1, 1000)
x2 = np.random.normal(0, 1.05, 1000)
h1 = hist.new.Reg(25, -4, 4).Weight().fill(x1)
h2 = hist.new.Reg(25, -4, 4).Weight().fill(x2)

# Create comparison panel only
fig, ax = plt.subplots()

mh.comp.comparison(
 h1,
 h2,
 comparison='ratio',
 xlabel='Observable [GeV]',
 h1_label='h1',
 h2_label='h2',
 ax=ax
)
mh.cms.label(data=True, lumi=100, ax=ax)
# Generate sample data and model
x1 = np.random.normal(0, 1, 1000)
x2 = np.random.normal(0, 1.05, 1000)
h1 = hist.new.Reg(25, -4, 4).Weight().fill(x1)
h2 = hist.new.Reg(25, -4, 4).Weight().fill(x2)

# Create comparison panel only
fig, ax = plt.subplots()

mh.comp.comparison(
 h1,
 h2,
 comparison='ratio',
 xlabel='Observable [GeV]',
 h1_label='h1',
 h2_label='h2',
 ax=ax
)
mh.atlas.label(data=True, lumi=150, ax=ax)
mh.mpl_magic(soft_fail=True)
# Generate sample data and model
x1 = np.random.normal(0, 1, 1000)
x2 = np.random.normal(0, 1.05, 1000)
h1 = hist.new.Reg(25, -4, 4).Weight().fill(x1)
h2 = hist.new.Reg(25, -4, 4).Weight().fill(x2)

# Create comparison panel only
fig, ax = plt.subplots()

mh.comp.comparison(
 h1,
 h2,
 comparison='ratio',
 xlabel='Observable [GeV]',
 h1_label='h1',
 h2_label='h2',
 ax=ax
)
mh.lhcb.label(data=True, lumi=50, ax=ax)
# Generate sample data and model
x1 = np.random.normal(0, 1, 1000)
x2 = np.random.normal(0, 1.05, 1000)
h1 = hist.new.Reg(25, -4, 4).Weight().fill(x1)
h2 = hist.new.Reg(25, -4, 4).Weight().fill(x2)

# Create comparison panel only
fig, ax = plt.subplots()

mh.comp.comparison(
 h1,
 h2,
 comparison='ratio',
 xlabel='Observable [GeV]',
 h1_label='h1',
 h2_label='h2',
 ax=ax
)
mh.alice.label(data=True, lumi=100, ax=ax)
mh.mpl_magic(soft_fail=True)
# Generate sample data and model
x1 = np.random.normal(0, 1, 1000)
x2 = np.random.normal(0, 1.05, 1000)
h1 = hist.new.Reg(25, -4, 4).Weight().fill(x1)
h2 = hist.new.Reg(25, -4, 4).Weight().fill(x2)

# Create comparison panel only
fig, ax = plt.subplots()

mh.comp.comparison(
 h1,
 h2,
 comparison='ratio',
 xlabel='Observable [GeV]',
 h1_label='h1',
 h2_label='h2',
 ax=ax
)
mh.dune.label(data=True, lumi=100, ax=ax)
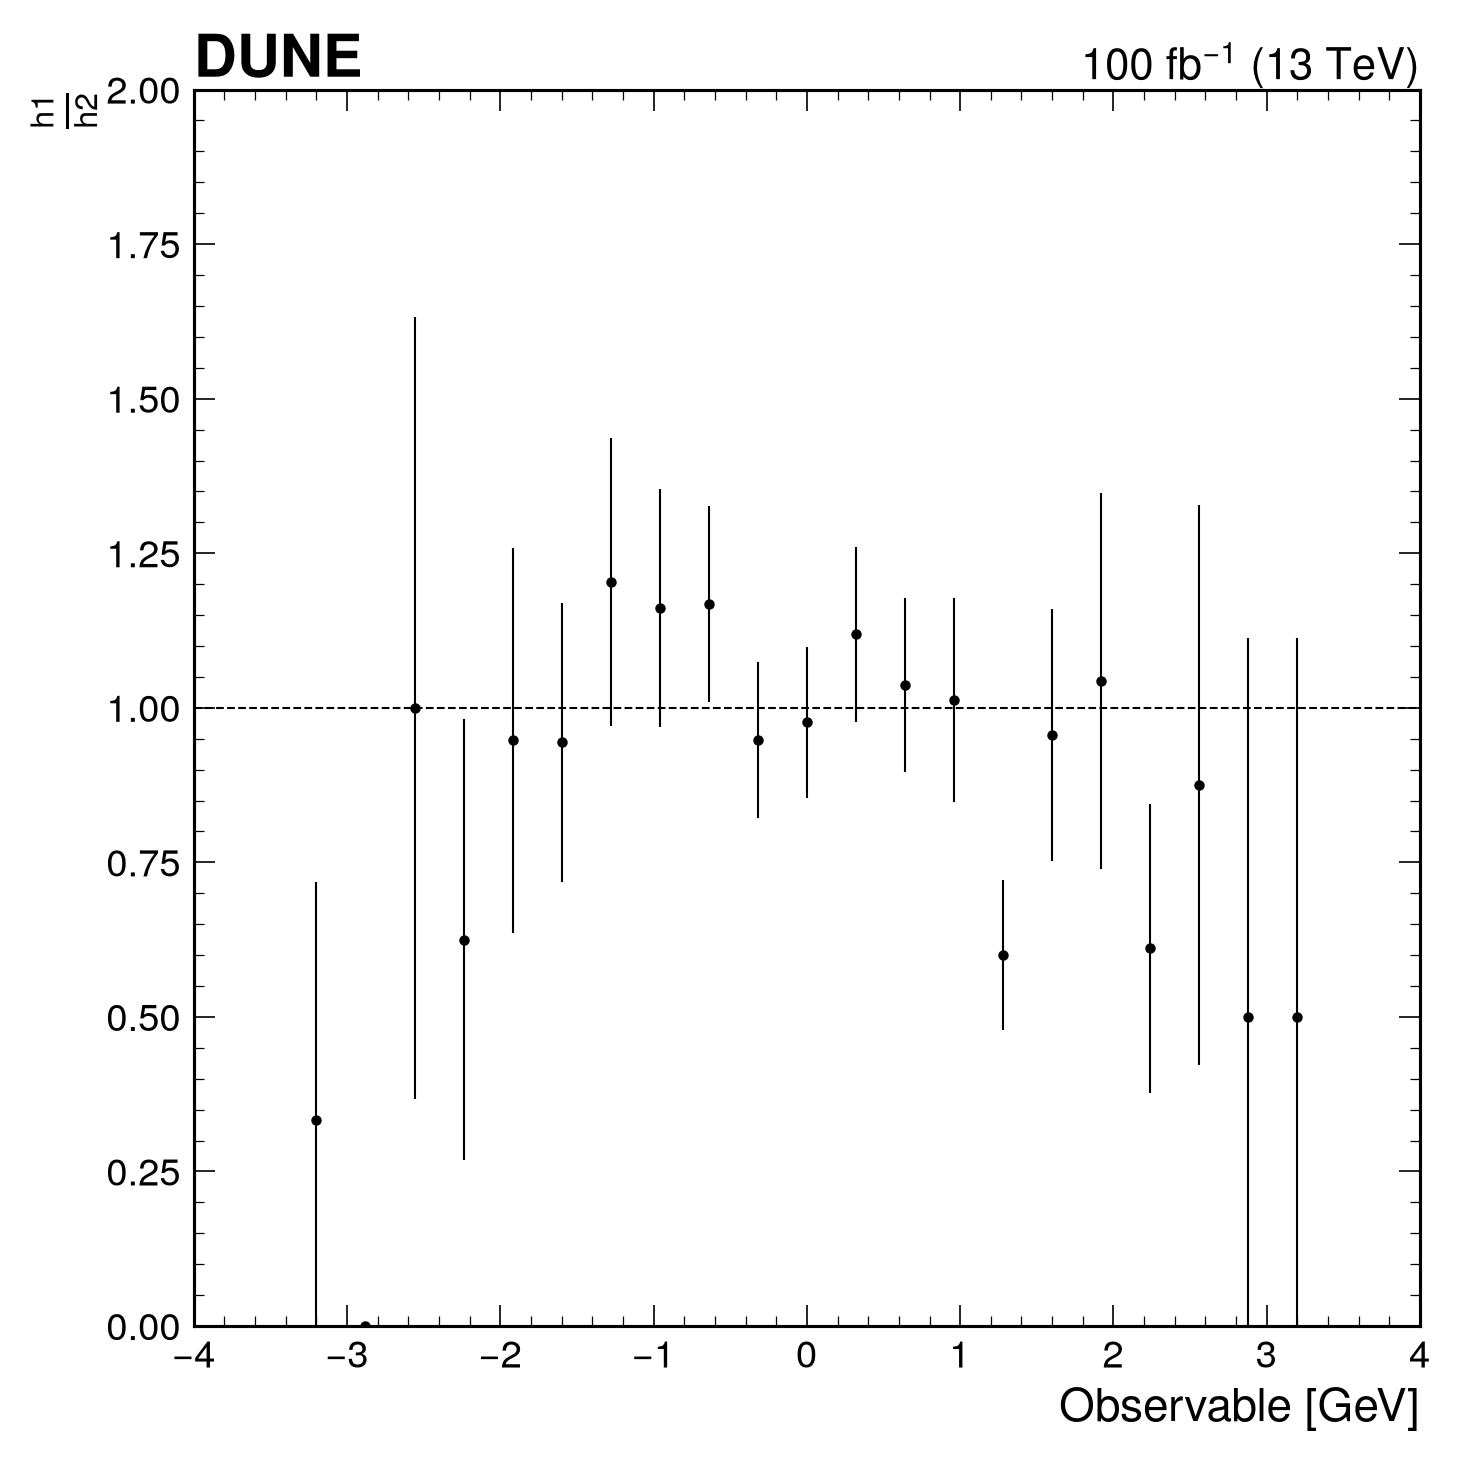
To get the [values, lower_uncertainties, upper_uncertainties] for a given comparison type without plotting, use mh.comp.get_comparison():
values, lower_uncertainties, upper_uncertainties = mh.comp.get_comparison(
    h1,
    h2,
    comparison='ratio'
)
Data-MC comparison¤
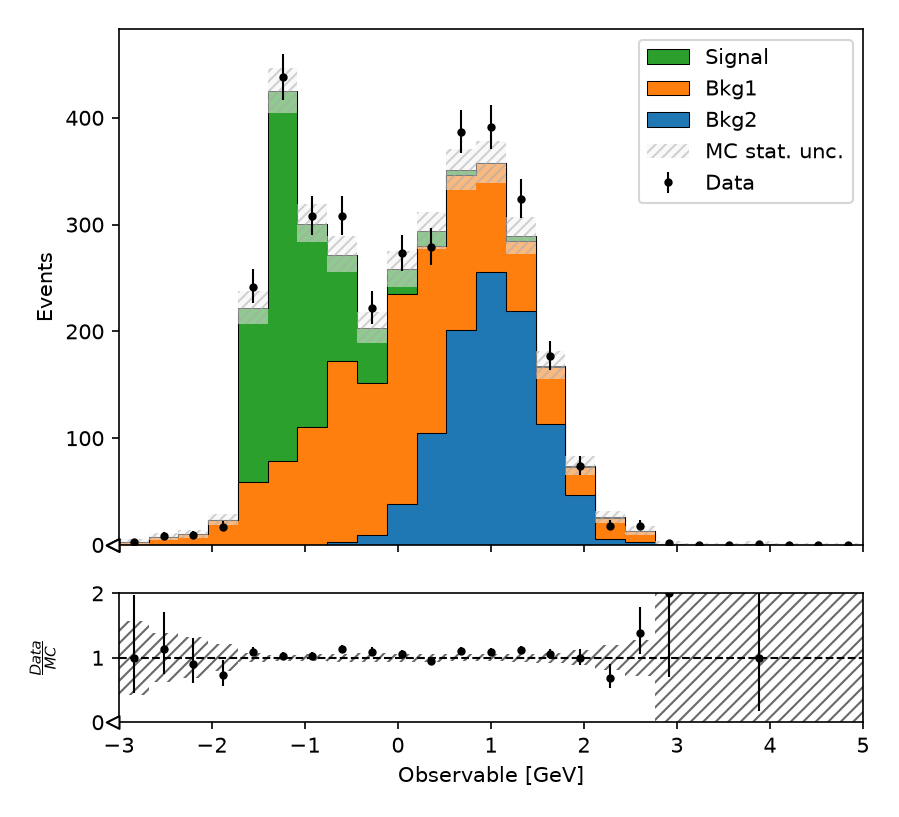
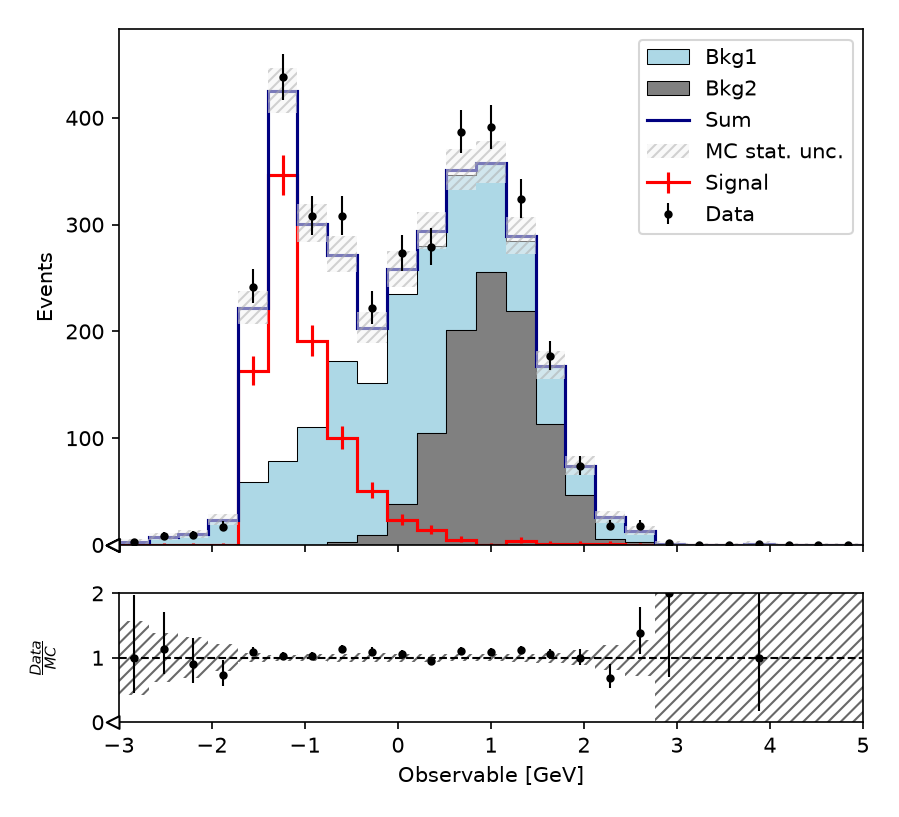
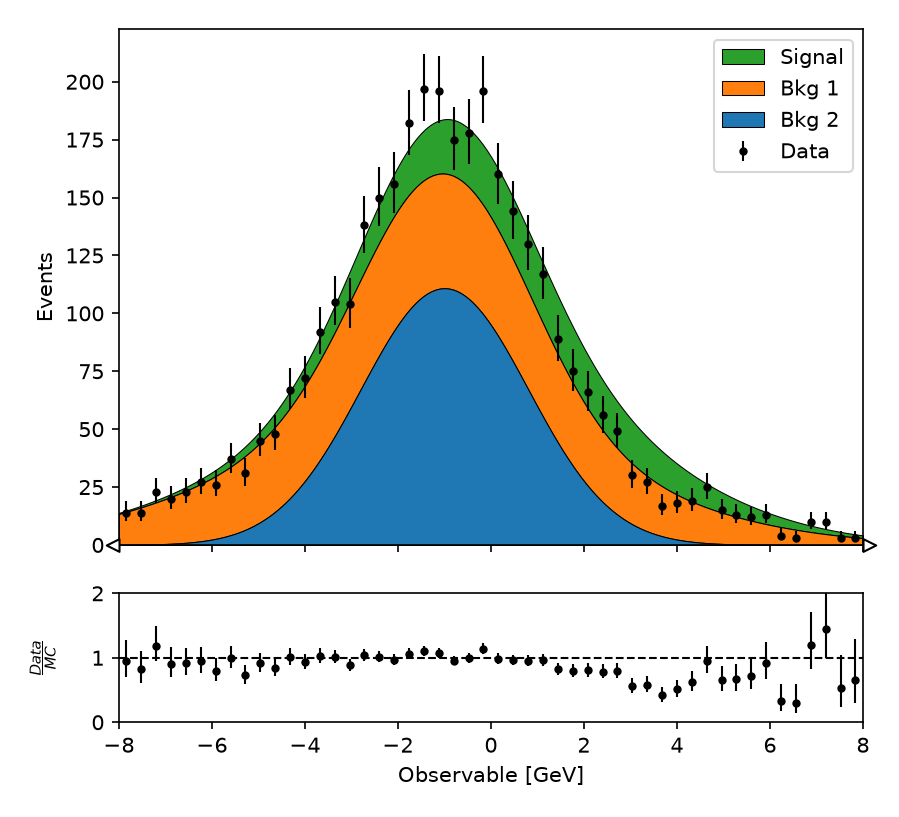
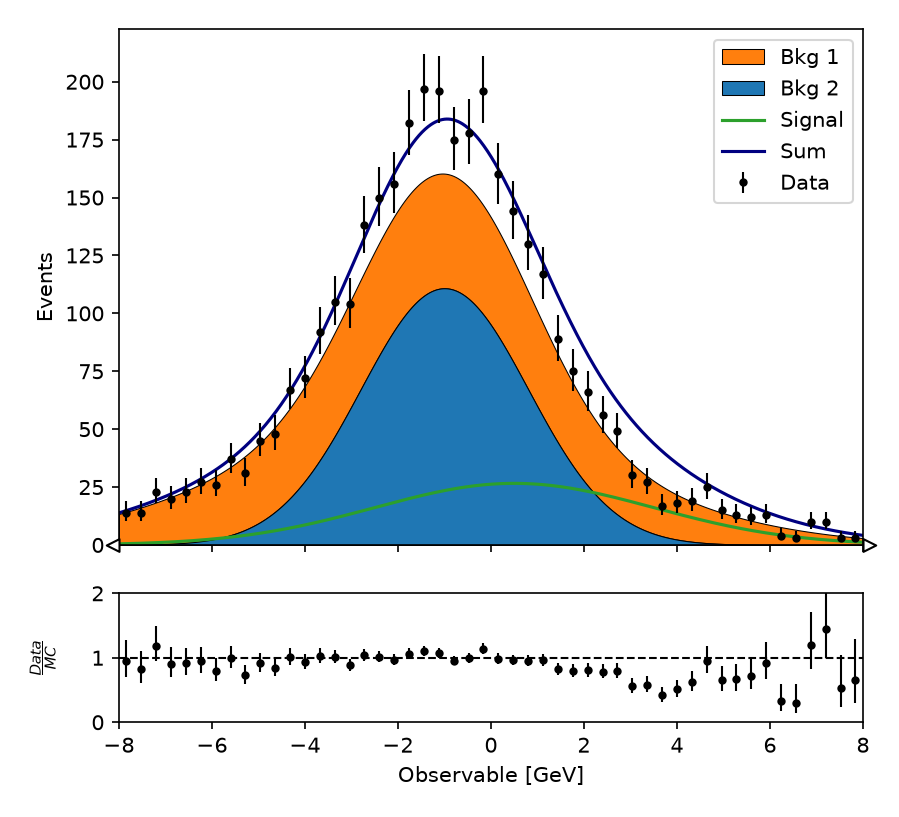
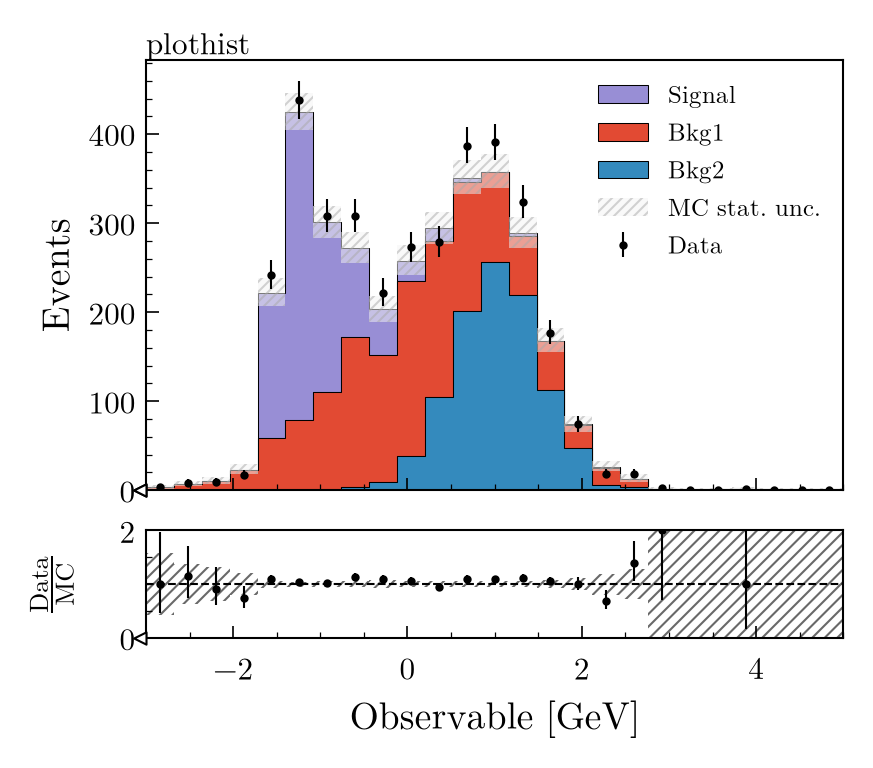
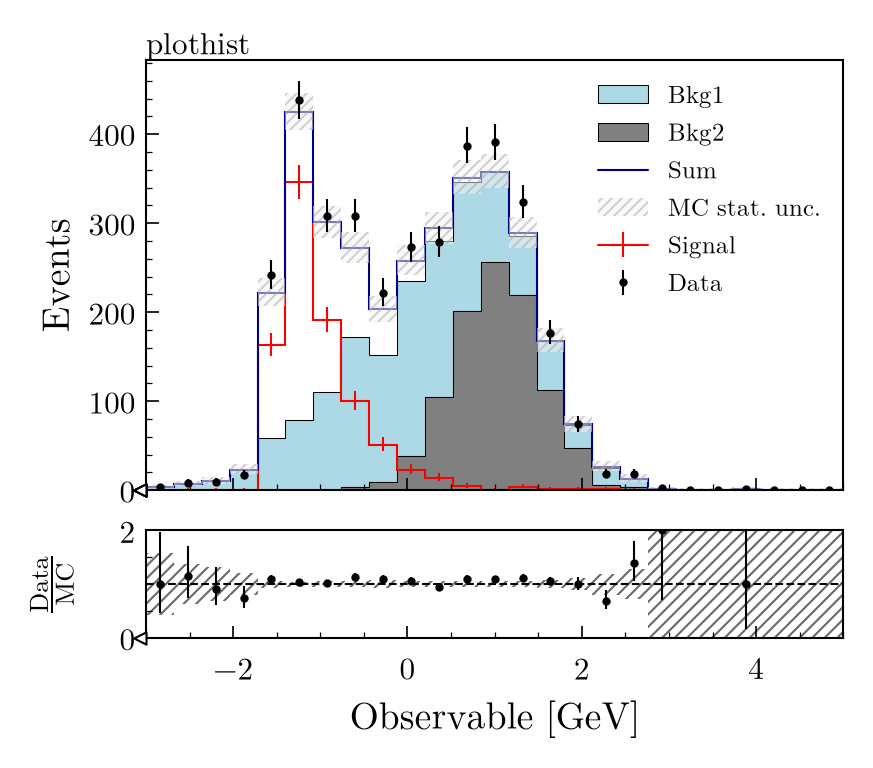
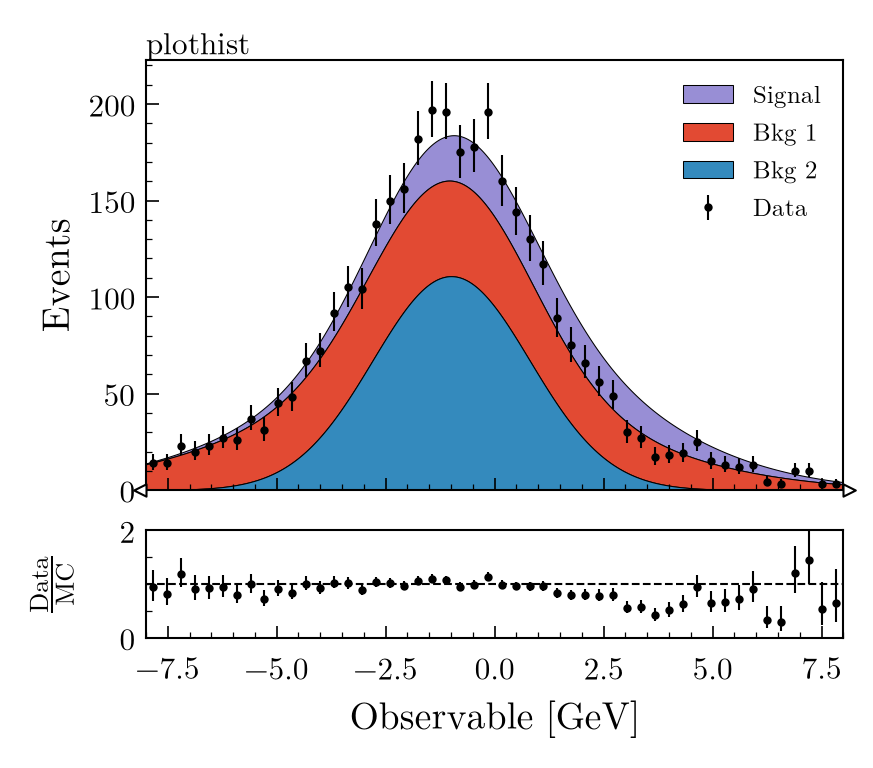
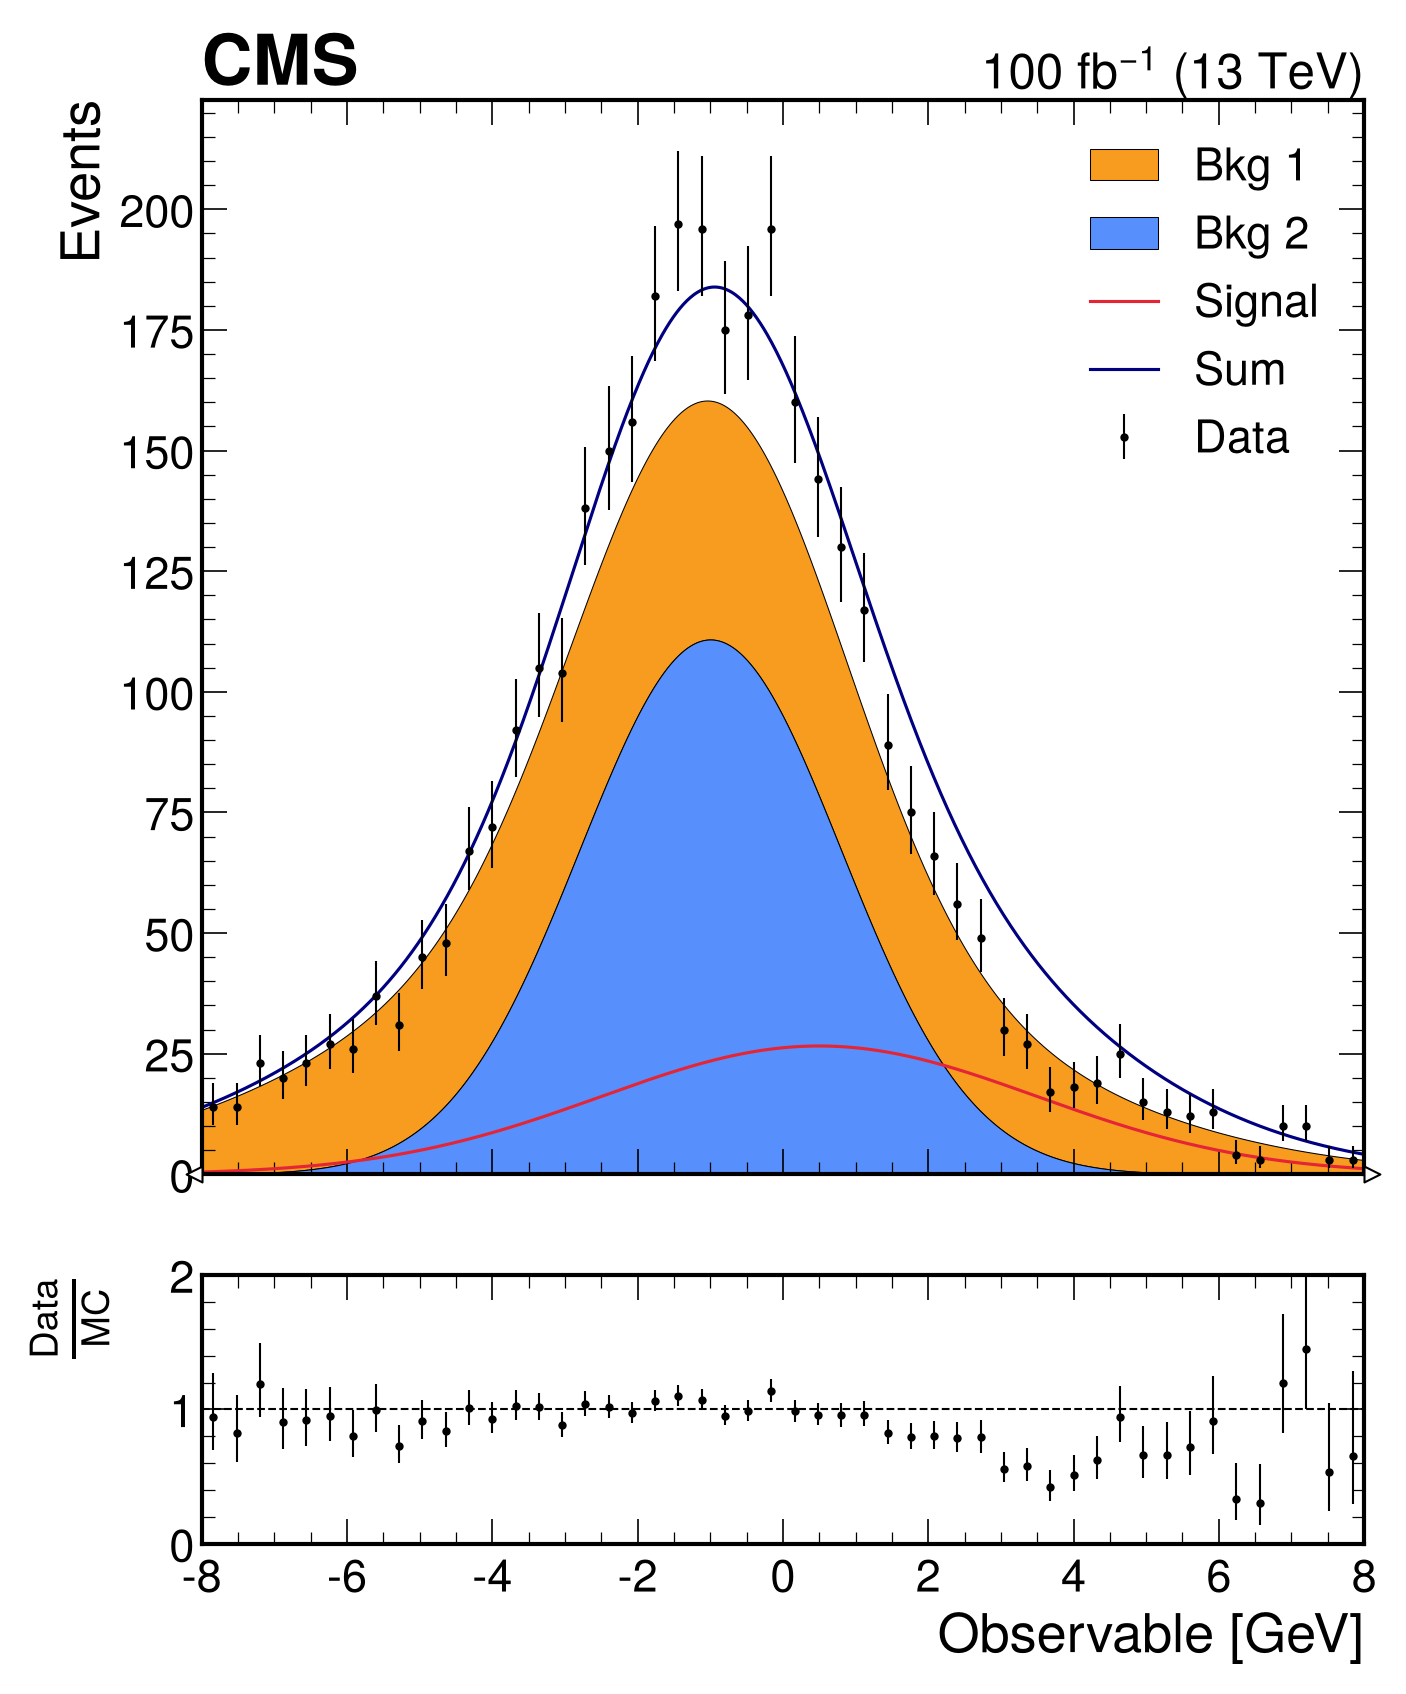
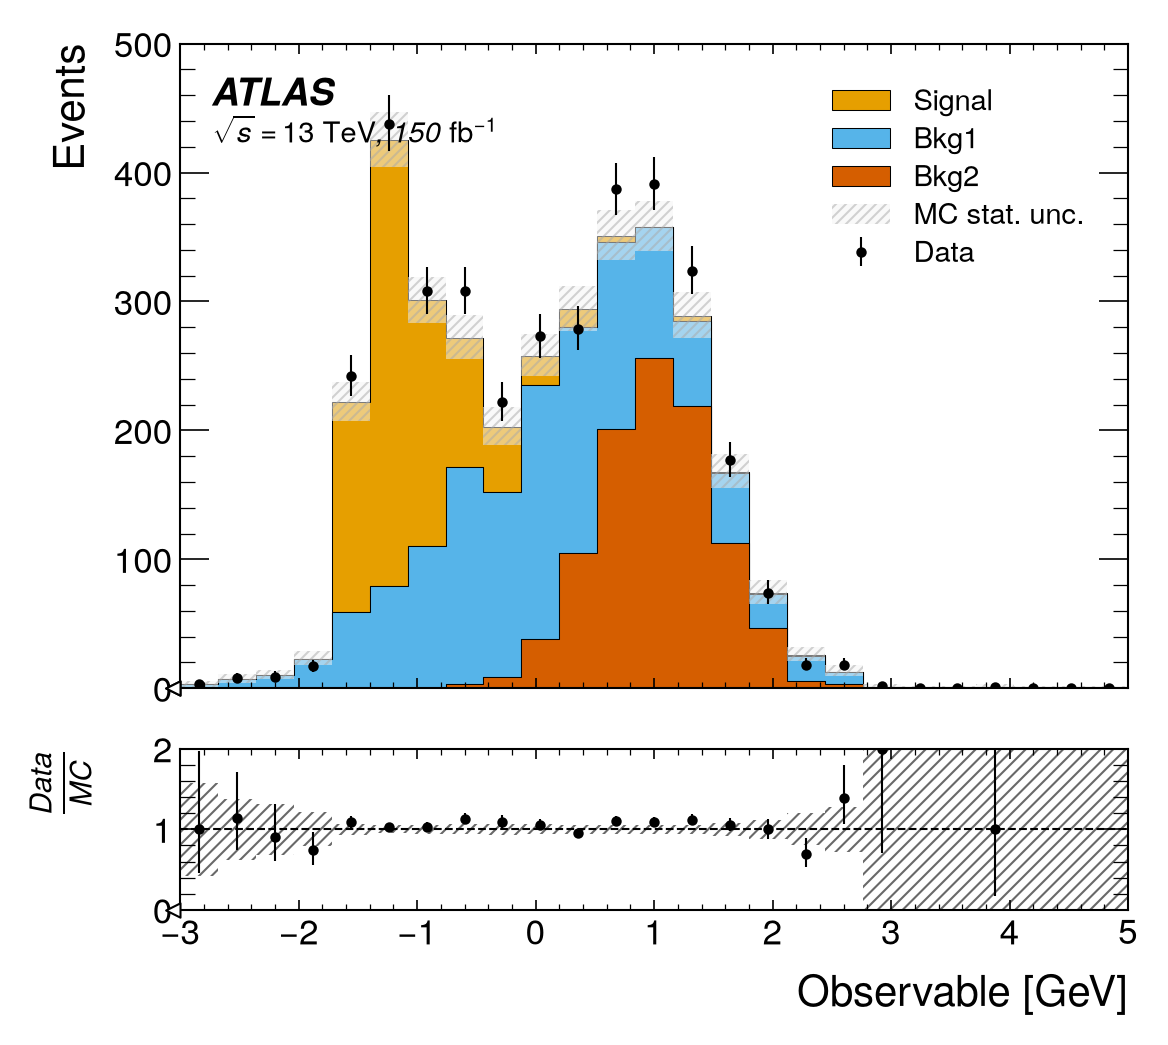
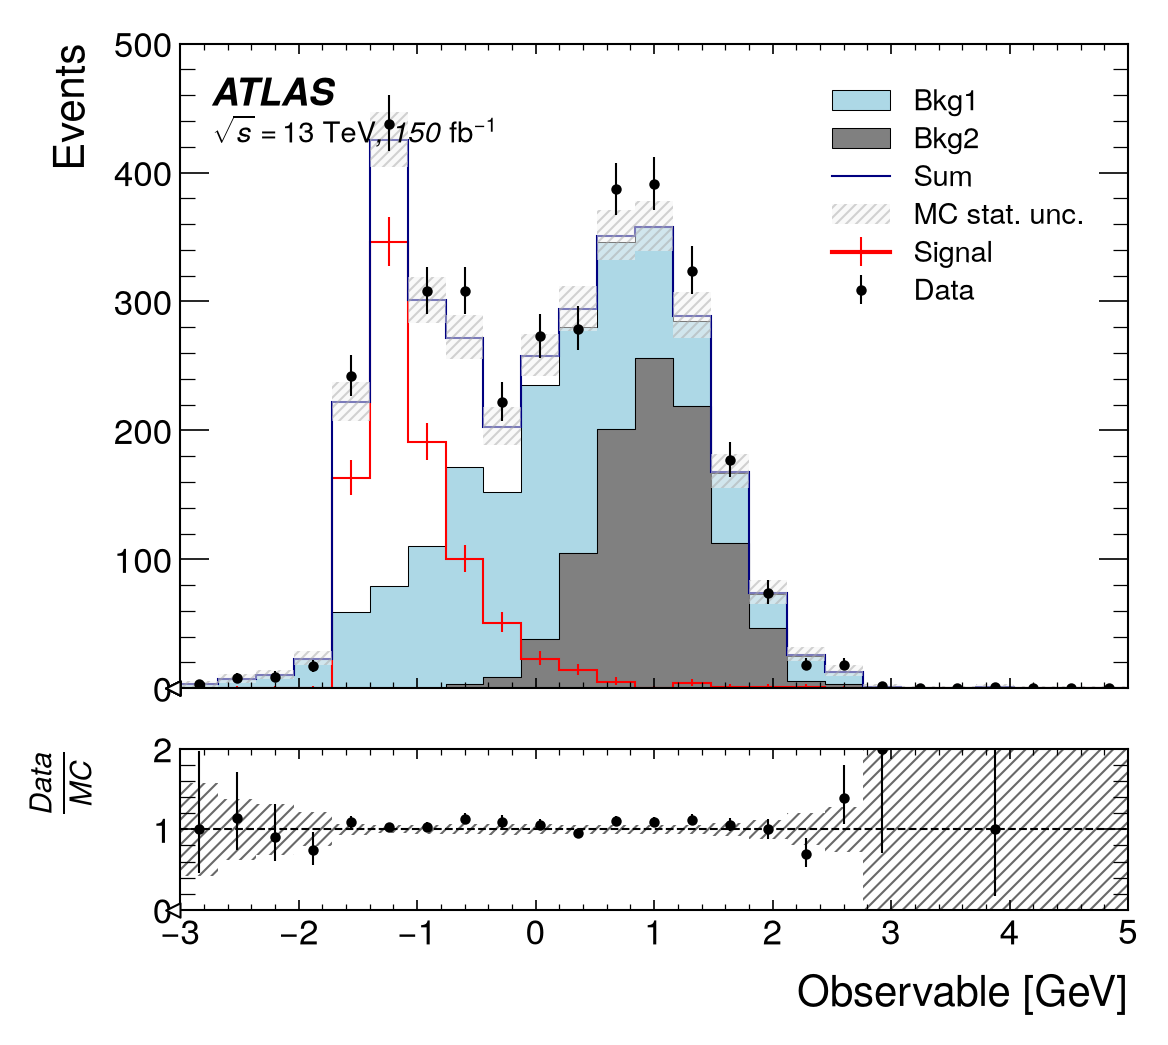
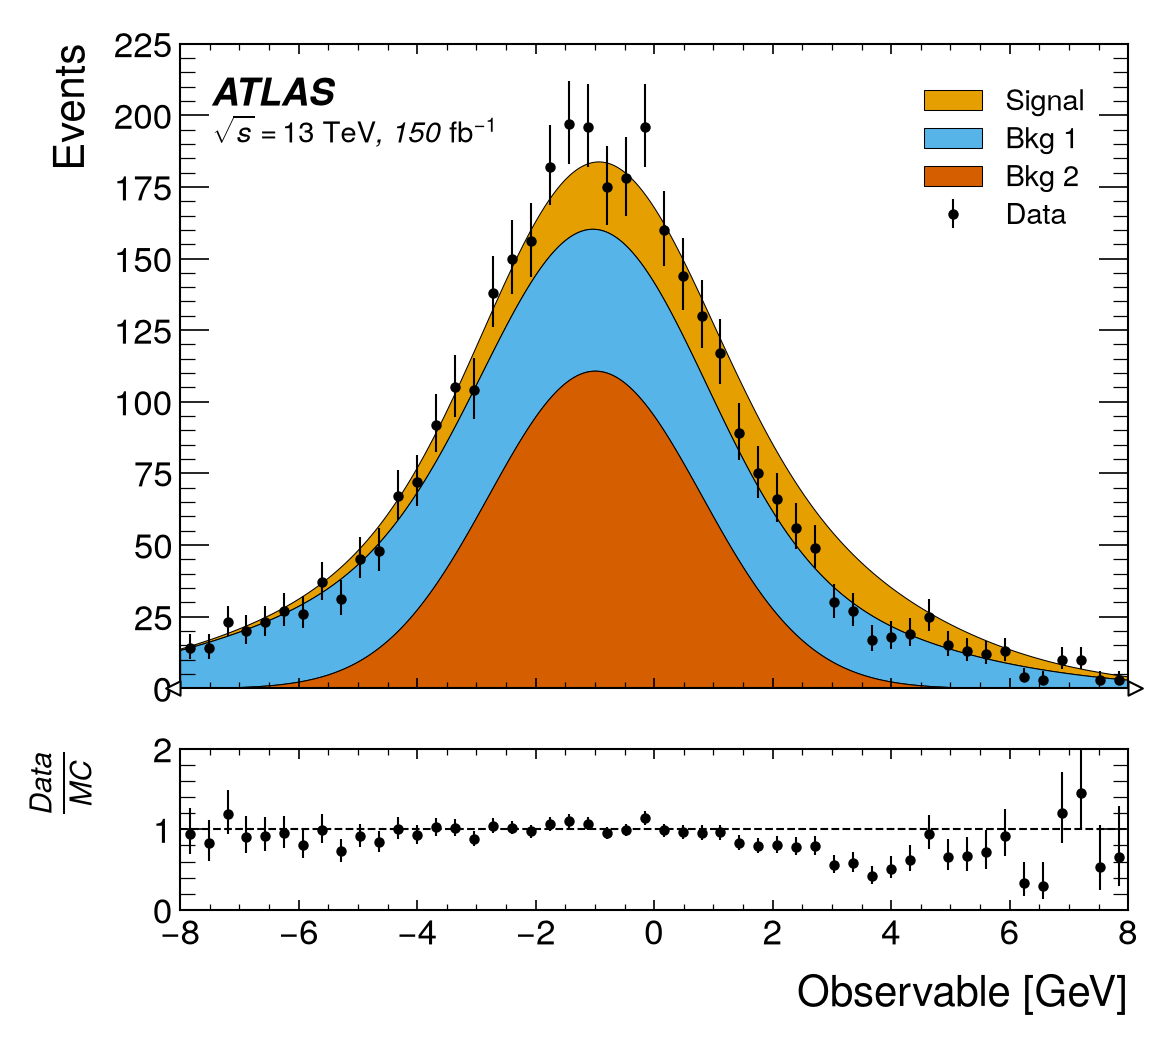
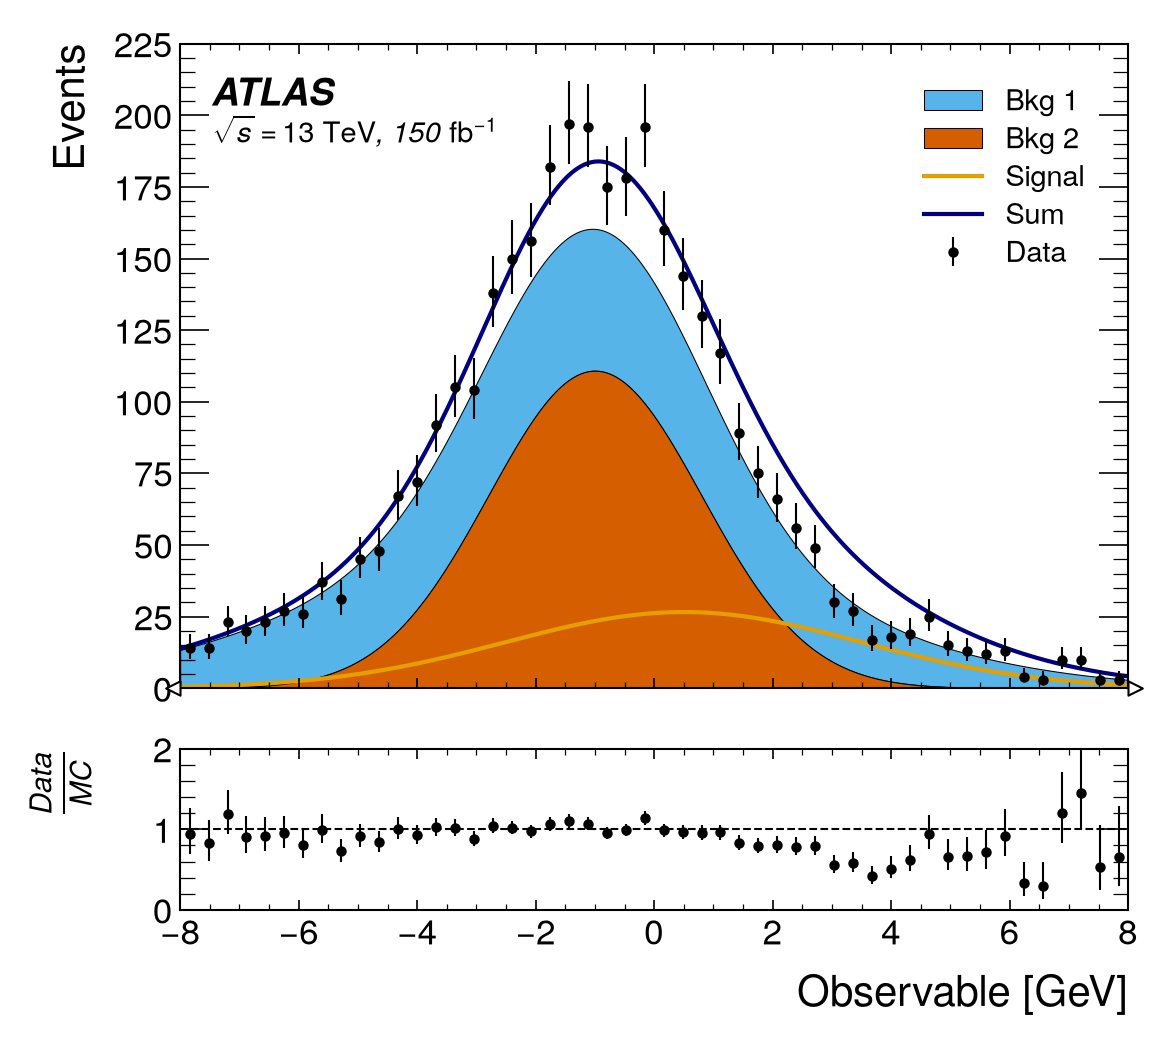
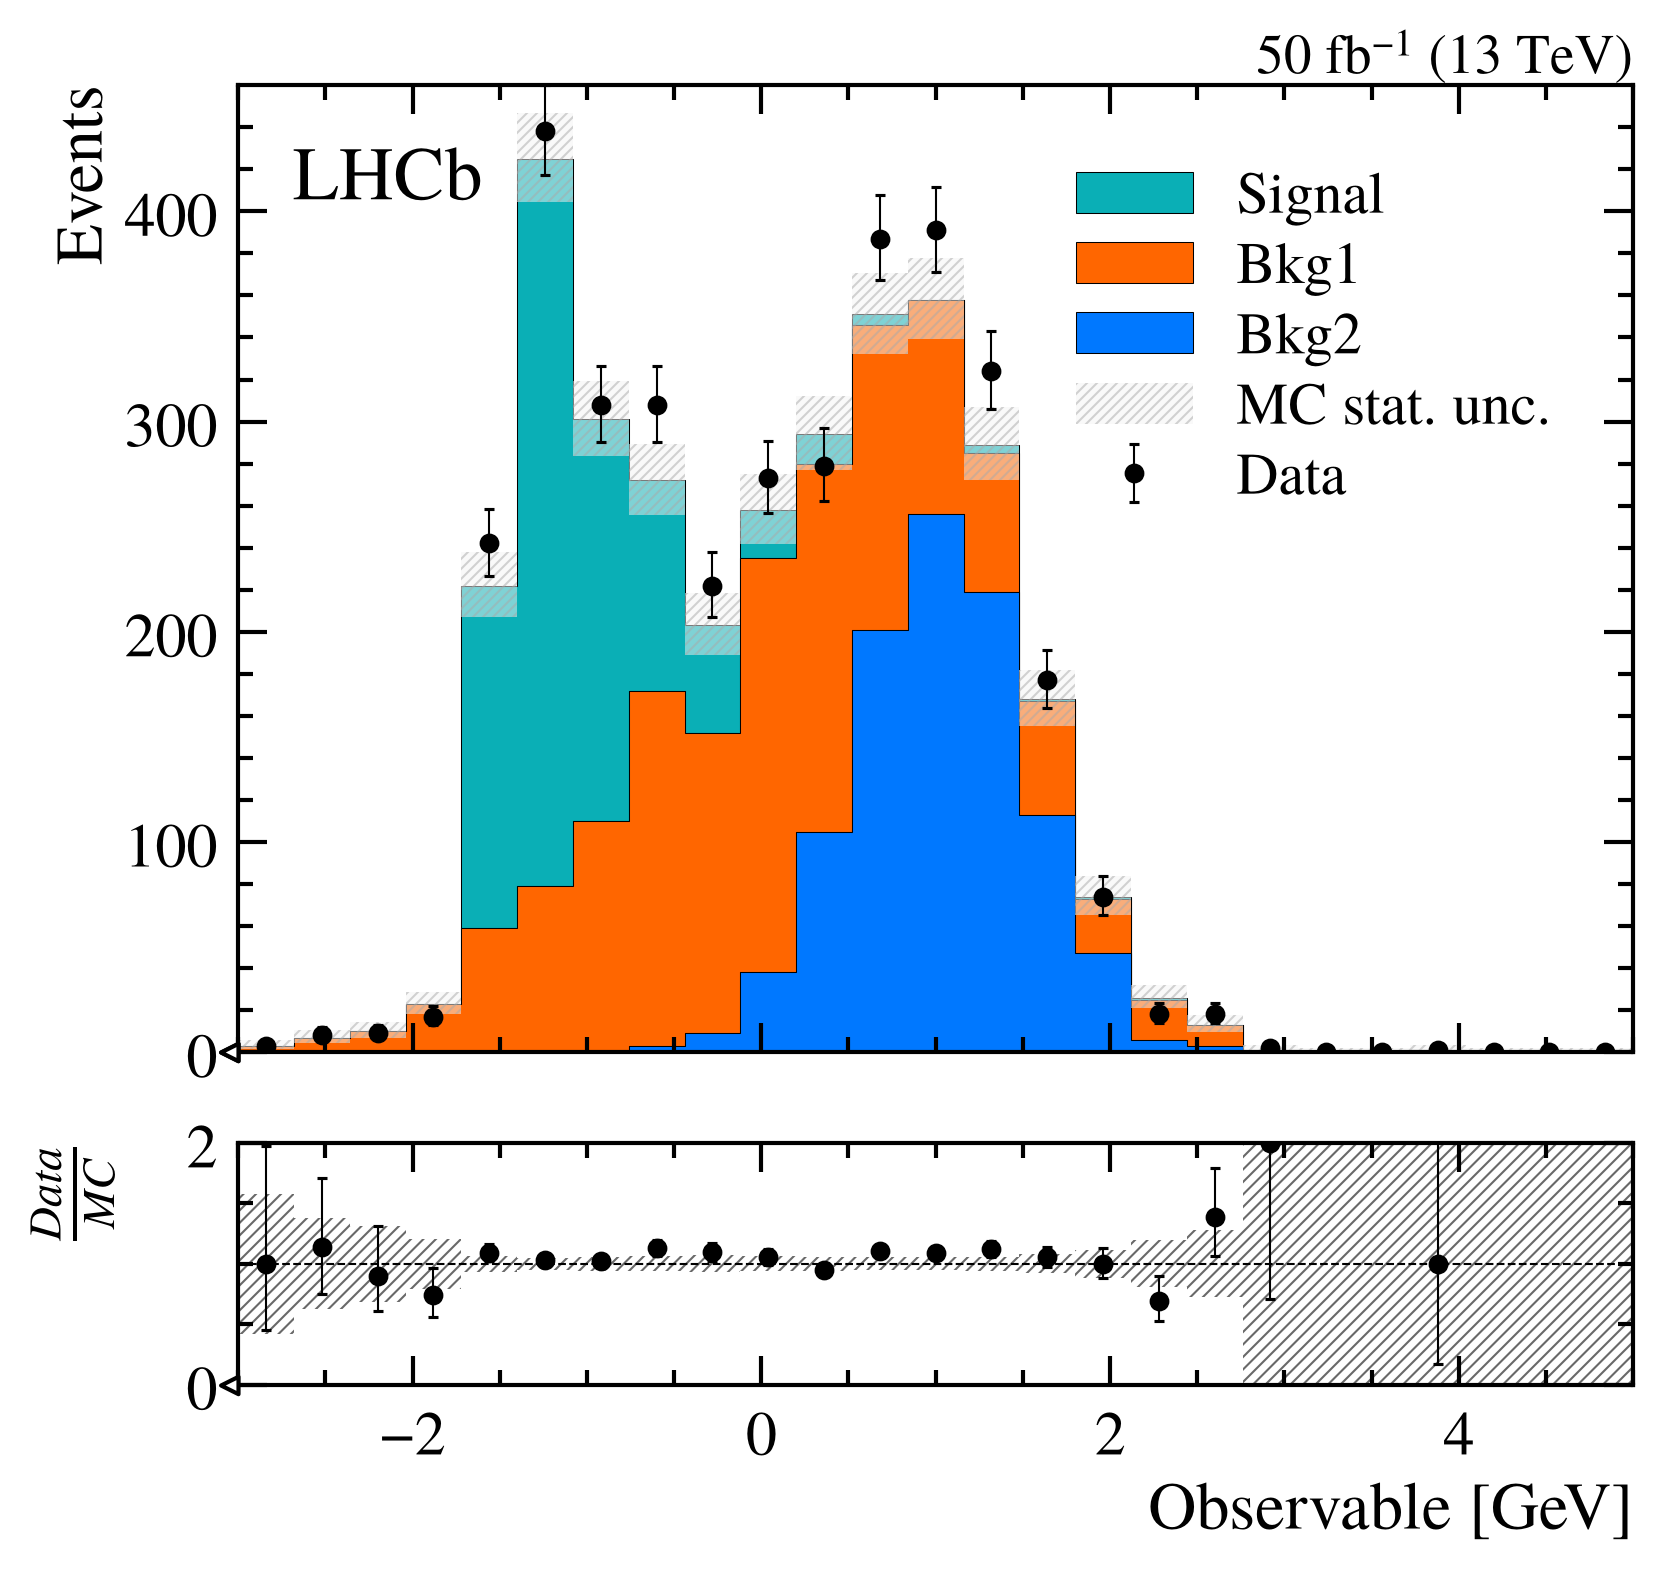
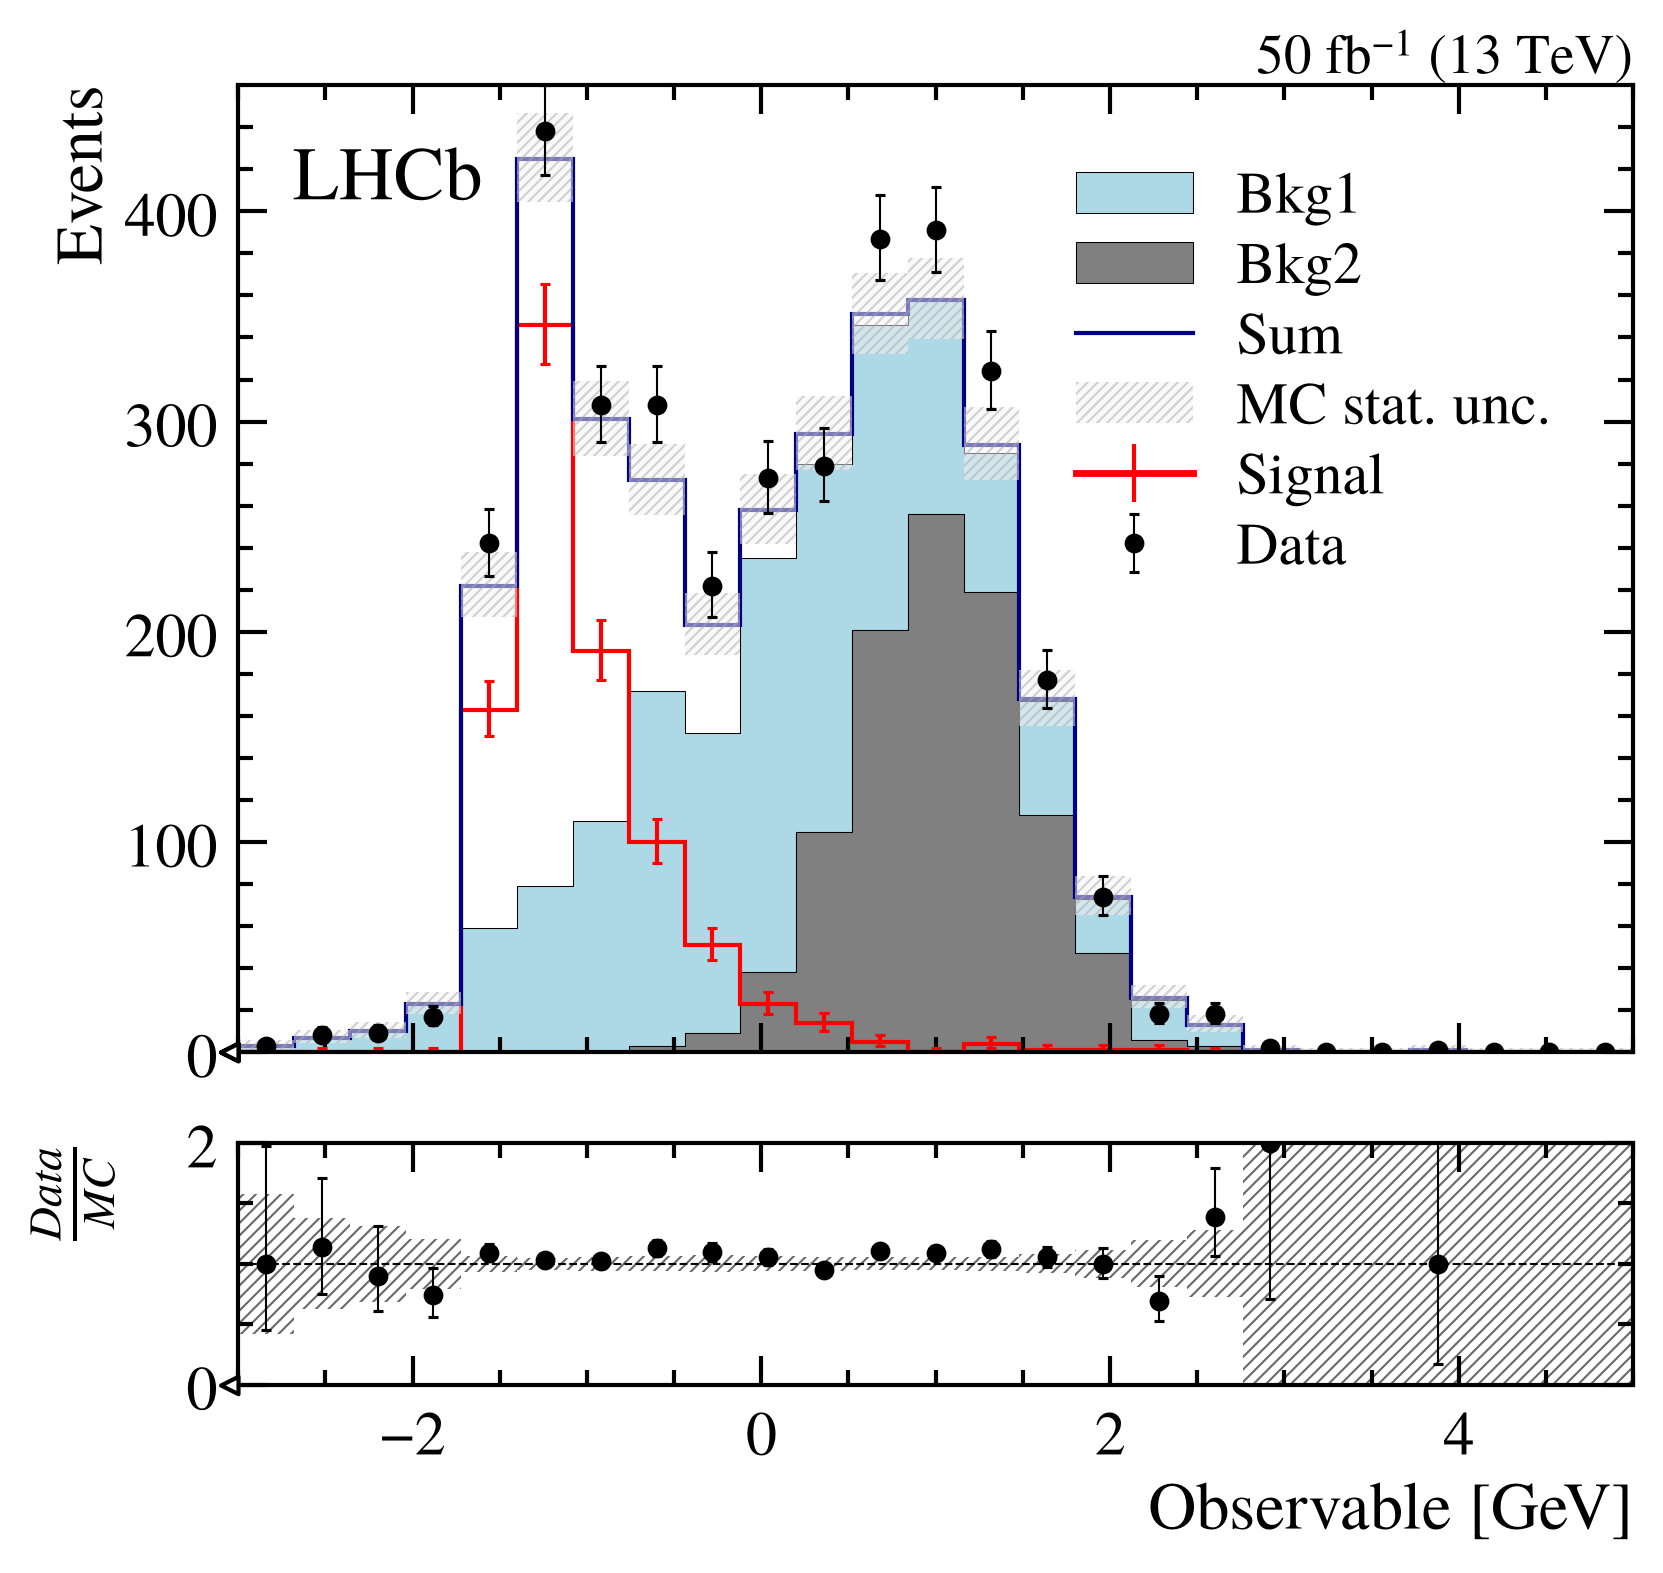
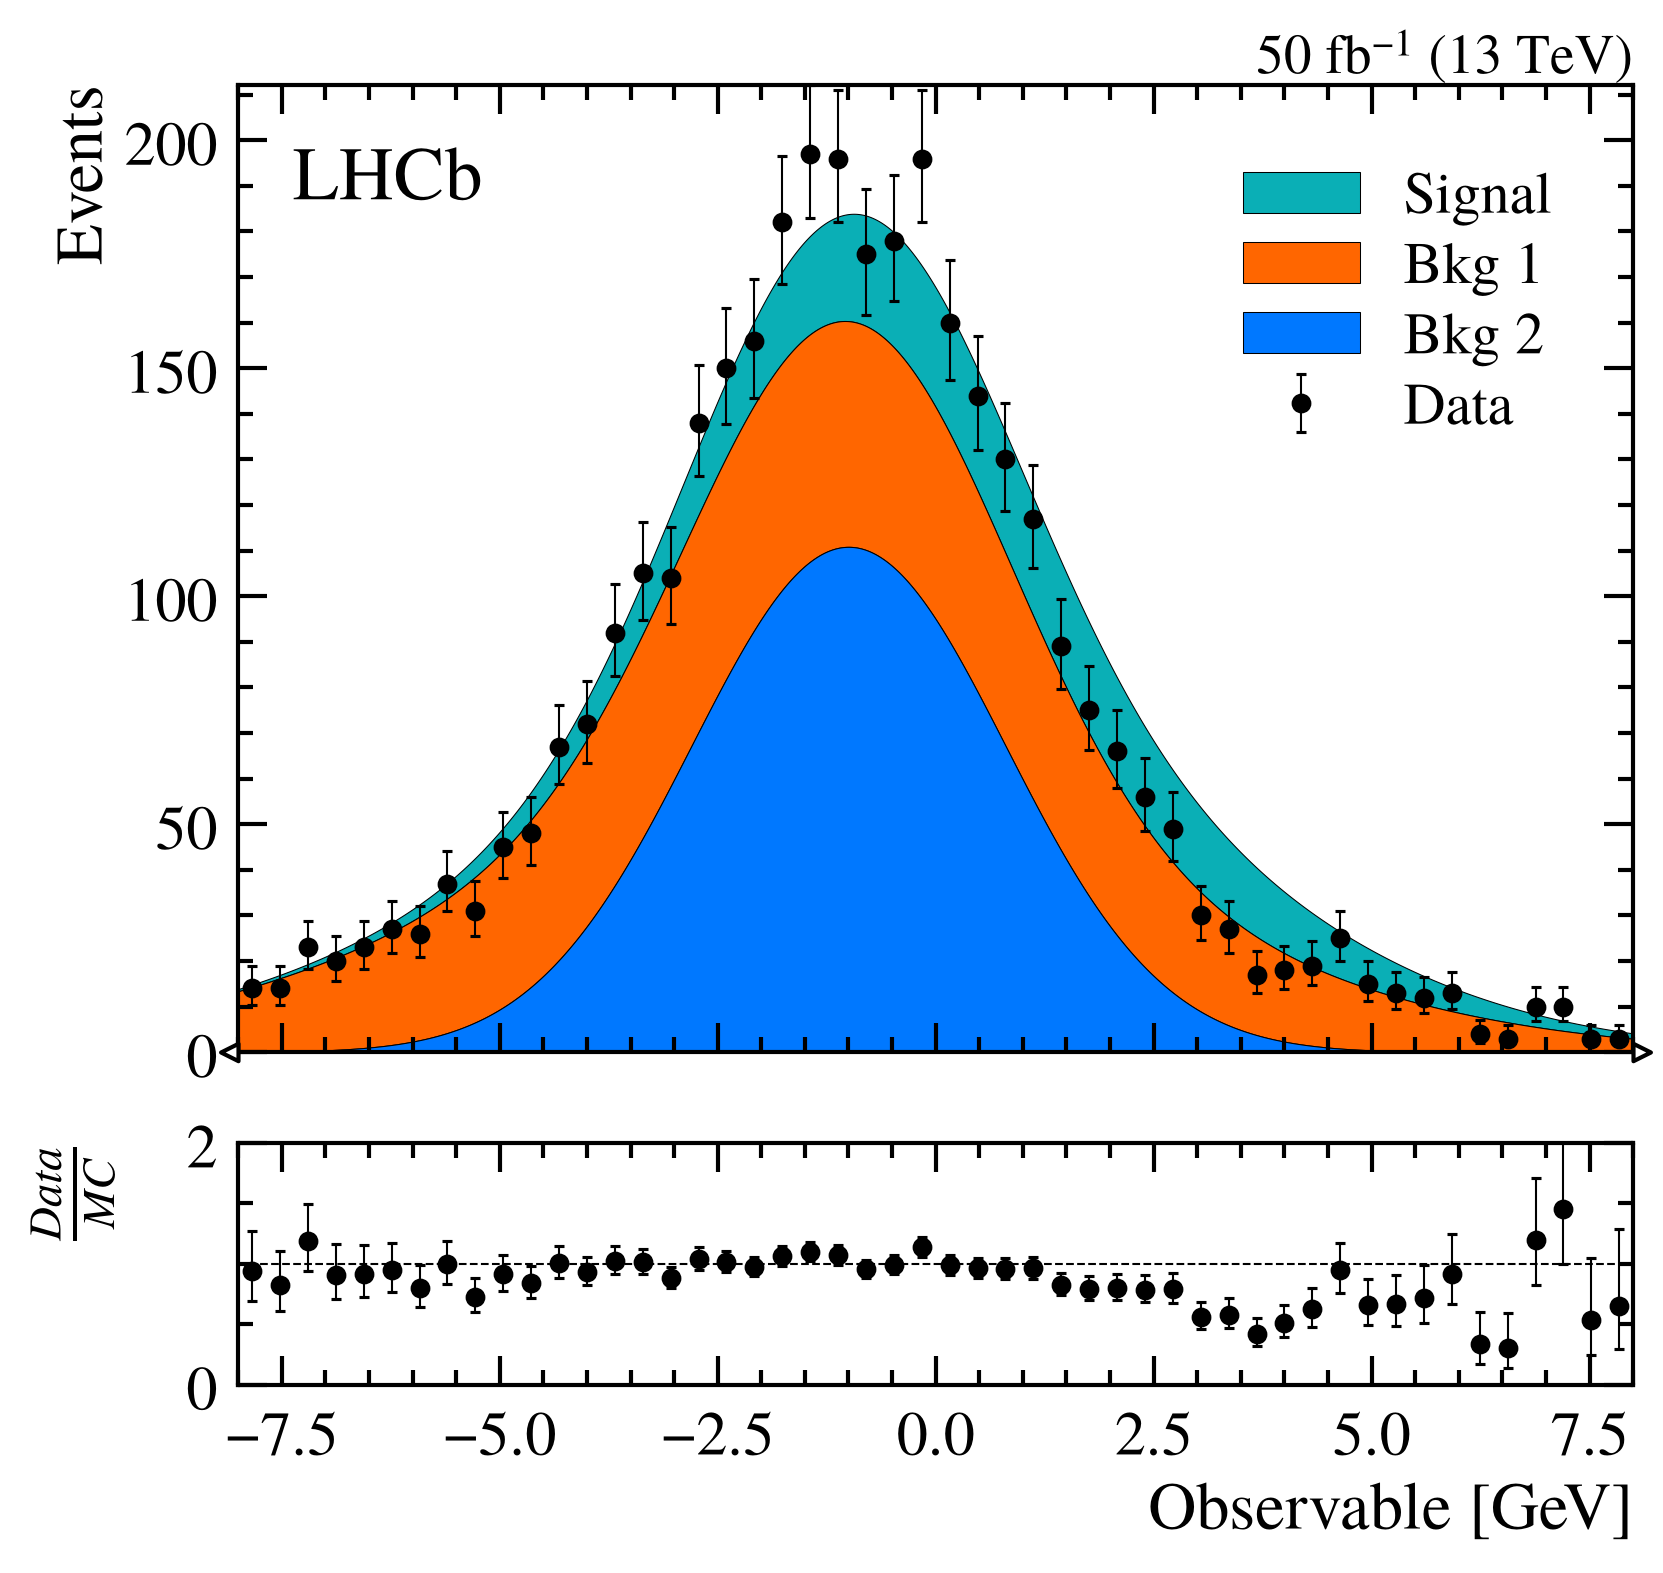
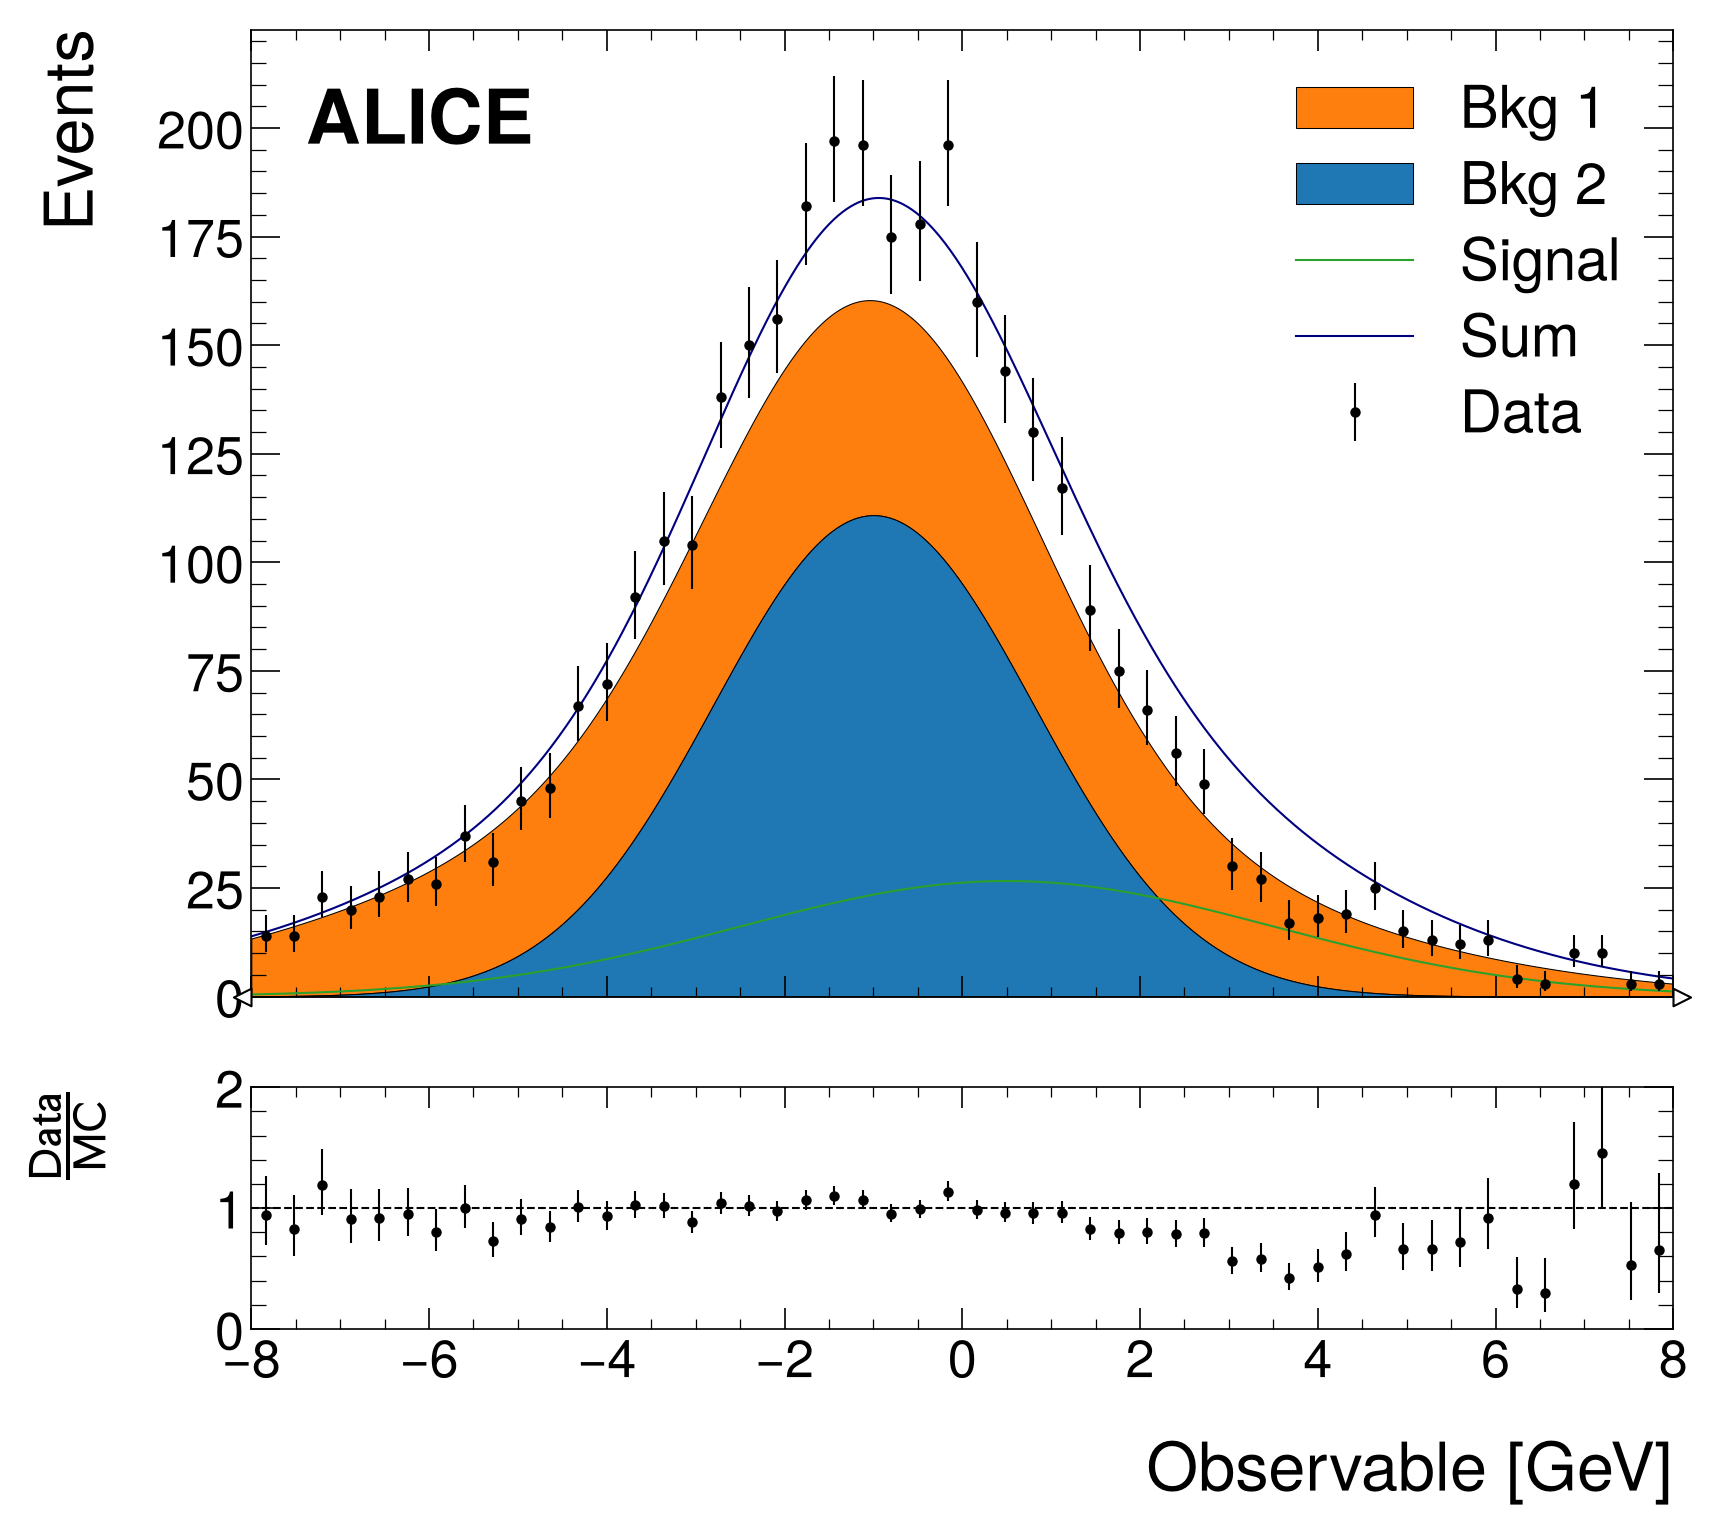
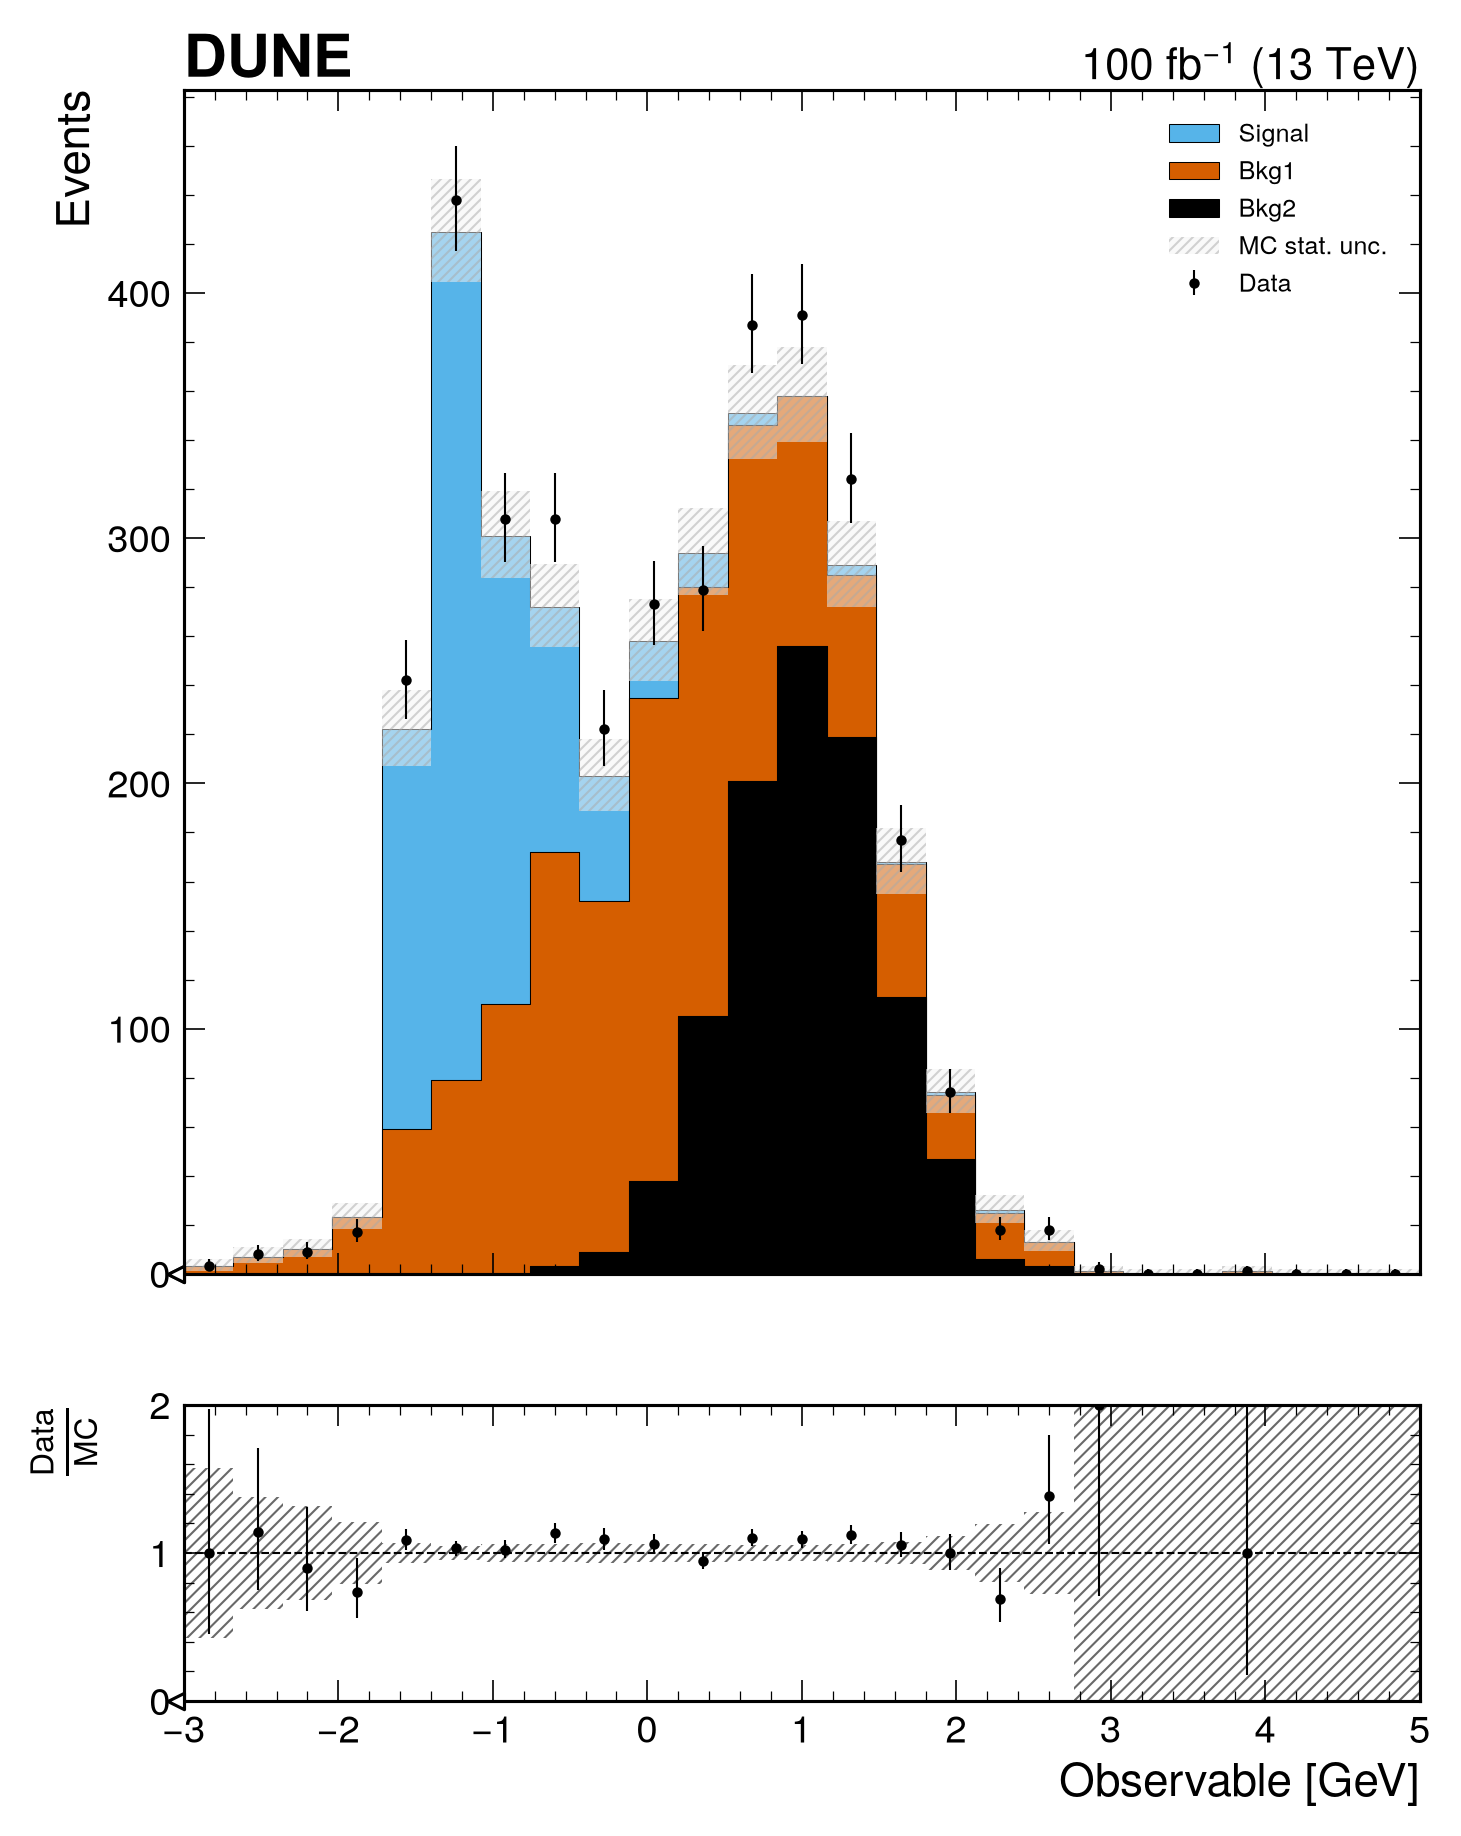
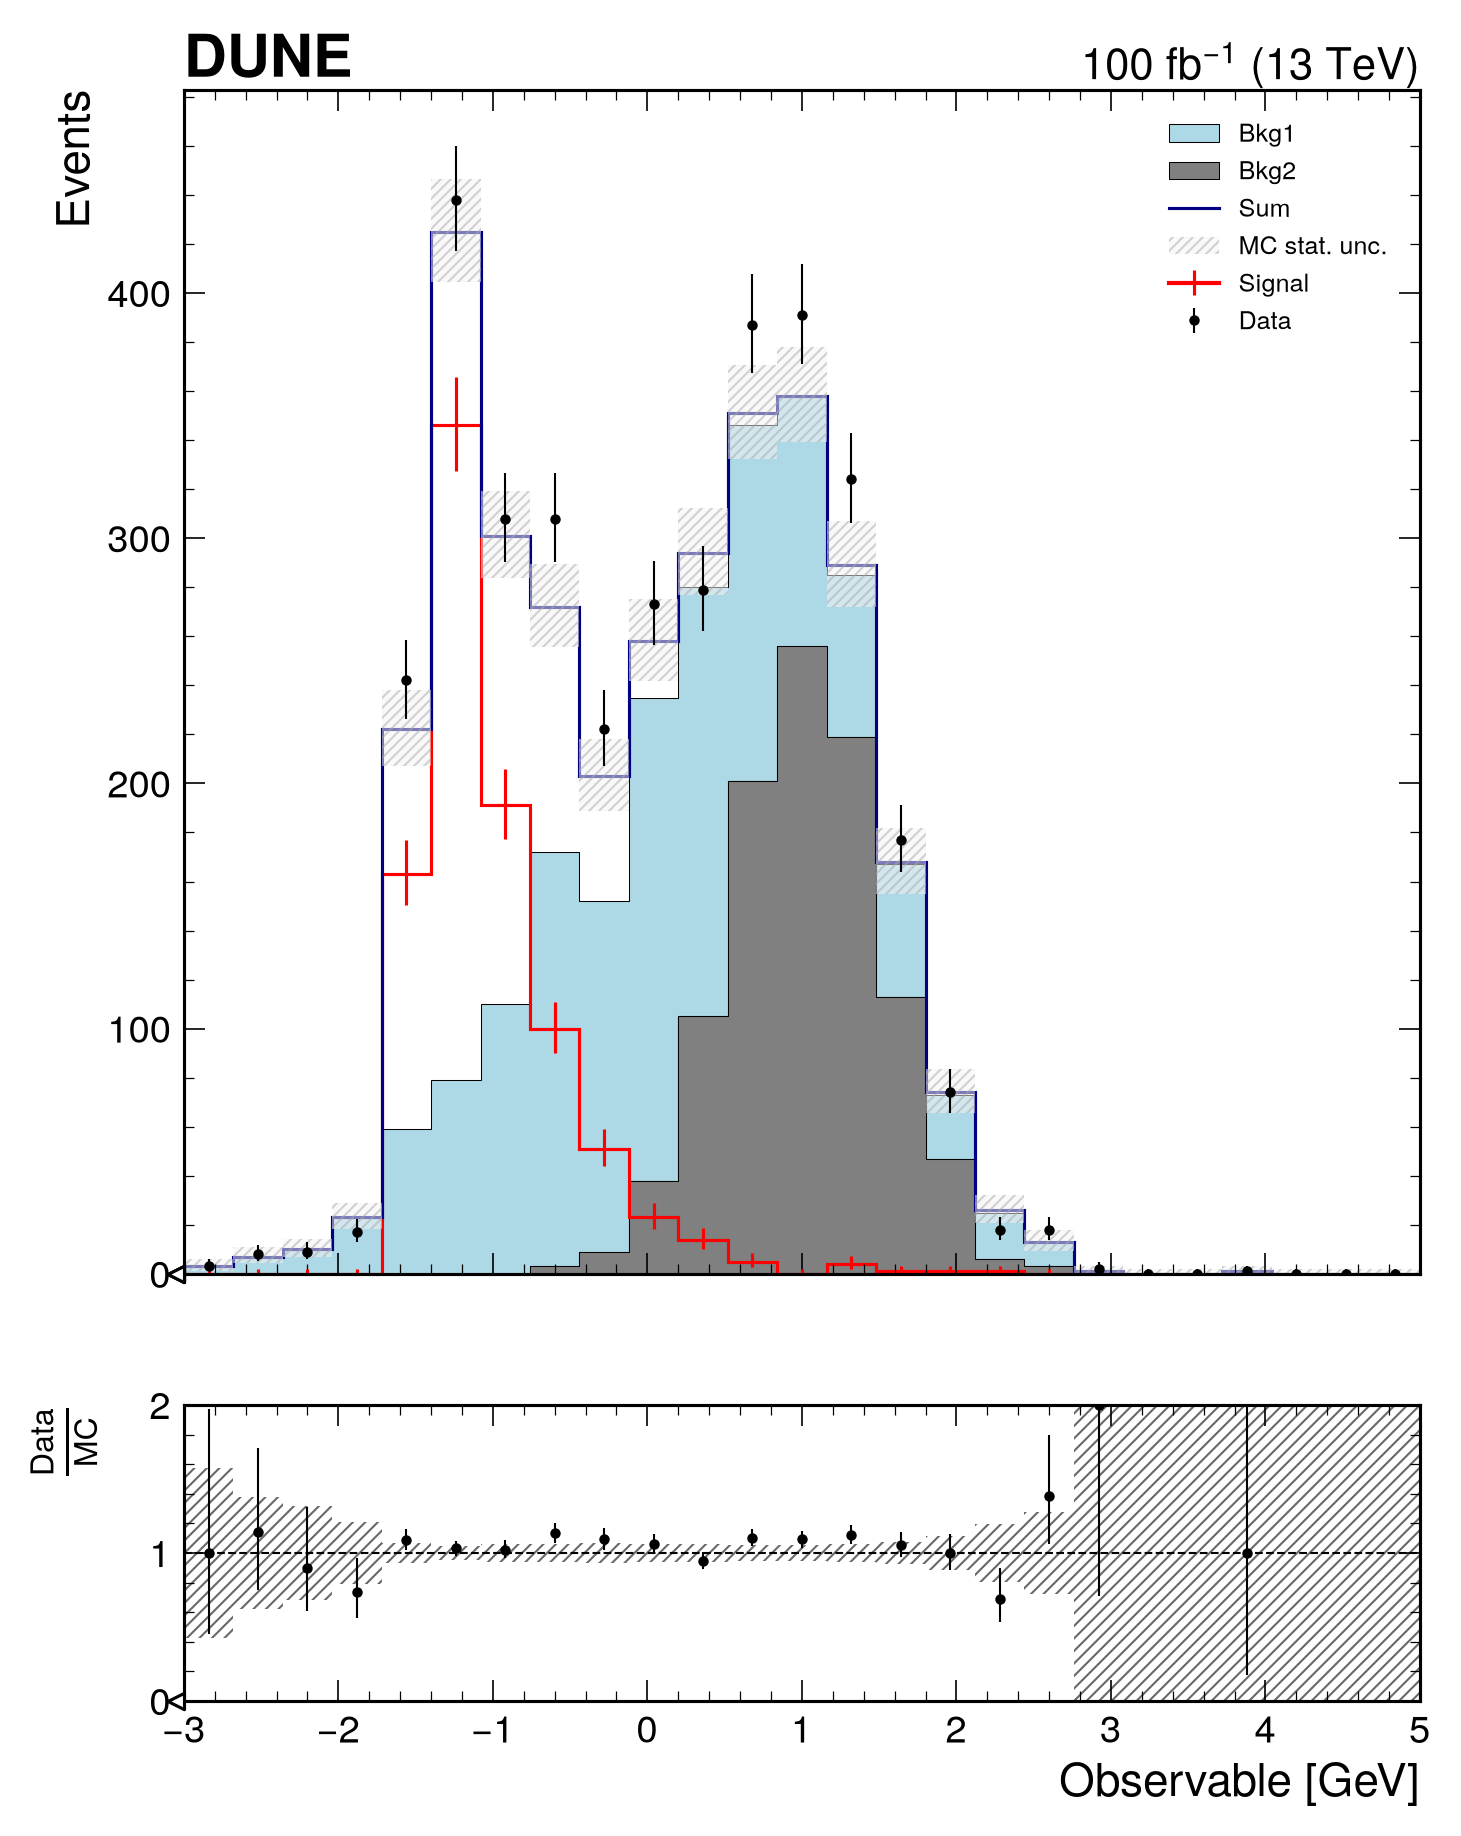
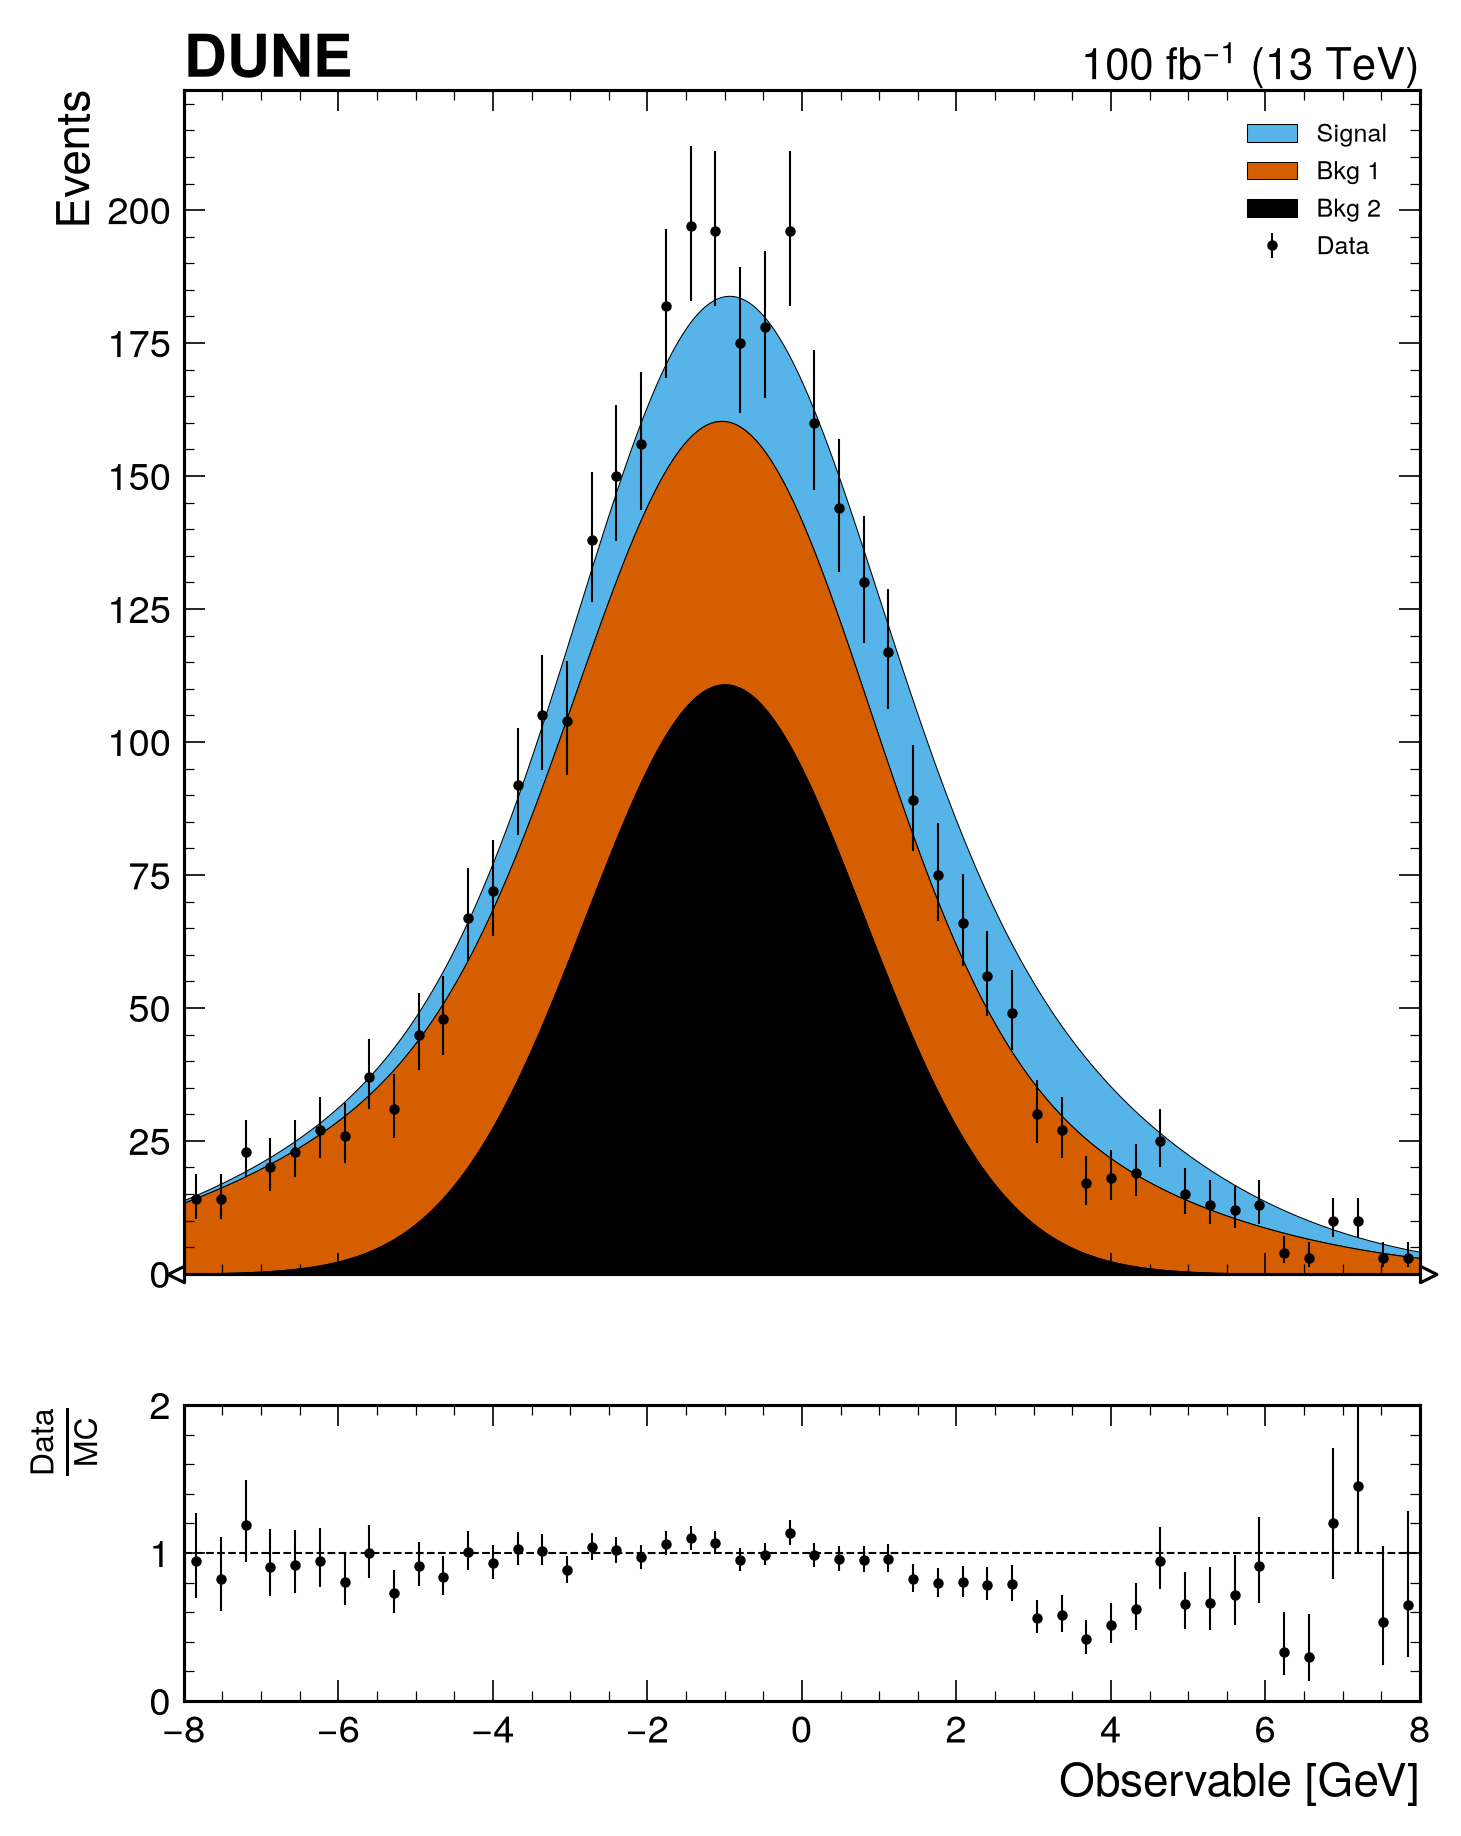
To compare data to a model made of multiple components (e.g. signal, backgrounds...), use mh.comp.data_model(). The function is very flexible, it can accept any number of stacked and/or unstacked components, either as histograms or functions. It will then compare the sum of the components to the data, with the comparison of your choice. The default comparison is the split_ratio between the model and the data. It can take any comparison method available in mh.comp.hists().
# Generate signal, backgrounds, and data
x1 = np.random.normal(0, 1, 1400)
x2 = np.random.normal(1, 0.5, 1000)
x3 = np.random.exponential(0.5, 900) - 1.5
data_x = np.random.choice([*x1, *x2, *x3], size=3500, replace=True)
h_bkg1 = hist.new.Reg(25, -3, 5).Weight().fill(x1)
h_bkg2 = hist.new.Reg(25, -3, 5).Weight().fill(x2)
h_signal = hist.new.Reg(25, -3, 5).Weight().fill(x3)
h_data = hist.new.Reg(25, -3, 5).Weight().fill(data_x)

# Create comparison plot
fig, ax_main, ax_comp = mh.comp.data_model(
 data_hist=h_data,
 stacked_components=[h_bkg2, h_bkg1, h_signal],
 stacked_labels=['Bkg2', 'Bkg1', 'Signal'],
 xlabel='Observable [GeV]',
 ylabel='Events'
)
# Generate signal, backgrounds, and data
x1 = np.random.normal(0, 1, 1400)
x2 = np.random.normal(1, 0.5, 1000)
x3 = np.random.exponential(0.5, 900) - 1.5
data_x = np.random.choice([*x1, *x2, *x3], size=3500, replace=True)
h_bkg1 = hist.new.Reg(25, -3, 5).Weight().fill(x1)
h_bkg2 = hist.new.Reg(25, -3, 5).Weight().fill(x2)
h_signal = hist.new.Reg(25, -3, 5).Weight().fill(x3)
h_data = hist.new.Reg(25, -3, 5).Weight().fill(data_x)

# The function will automatically sum the stacked and unstacked components
fig, ax_main, ax_comp = mh.comp.data_model(
 data_hist=h_data,
 stacked_components=[h_bkg2, h_bkg1],
 stacked_labels=['Bkg2', 'Bkg1'],
 stacked_colors=['grey', 'lightblue'],
 unstacked_components=[h_signal],
 unstacked_labels=['Signal'],
 unstacked_colors=['red'],
 xlabel='Observable [GeV]',
 ylabel='Events'
)
# Define component functions
def f_signal(x):
 return 200 * scipy.stats.norm.pdf(x, loc=0.5, scale=3)
def f_bkg1(x):
 return 500 * scipy.stats.norm.pdf(x, loc=-1.5, scale=4)
def f_bkg2(x):
 return 500 * scipy.stats.norm.pdf(x, loc=-1., scale=1.8)

# Generate data histogram
x_data = np.concatenate([np.random.normal(-1.5, 4, 1500), np.random.normal(-1., 1.8, 2000)])
data_hist = hist.new.Regular(50, -8, 8).Weight().fill(x_data)

# Create comparison plot
fig, ax_main, ax_comp = mh.comp.data_model(
 data_hist=data_hist,
 stacked_components=[f_bkg2, f_bkg1, f_signal],
 stacked_labels=['Bkg 2', 'Bkg 1', 'Signal'],
 xlabel='Observable [GeV]',
 ylabel='Events'
)
# Define component functions
def f_signal(x):
 return 200 * norm.pdf(x, loc=0.5, scale=3)
def f_bkg1(x):
 return 500 * norm.pdf(x, loc=-1.5, scale=4)
def f_bkg2(x):
 return 500 * norm.pdf(x, loc=-1., scale=1.8)

# Generate data histogram
x_data = np.concatenate([np.random.normal(-1.5, 4, 1500), np.random.normal(-1., 1.8, 2000)])
data_hist = hist.new.Regular(50, -8, 8).Weight().fill(x_data)

# Create comparison plot
fig, ax_main, ax_comp = mh.comp.data_model(
 data_hist=data_hist,
 stacked_components=[f_bkg2, f_bkg1,],
 stacked_labels=['Bkg 2', 'Bkg 1'],
 unstacked_components=[f_signal],
 unstacked_labels=['Signal'],
 xlabel='Observable [GeV]',
 ylabel='Events'
)
# Generate signal, backgrounds, and data
x1 = np.random.normal(0, 1, 1400)
x2 = np.random.normal(1, 0.5, 1000)
x3 = np.random.exponential(0.5, 900) - 1.5
data_x = np.random.choice([*x1, *x2, *x3], size=3500, replace=True)
h_bkg1 = hist.new.Reg(25, -3, 5).Weight().fill(x1)
h_bkg2 = hist.new.Reg(25, -3, 5).Weight().fill(x2)
h_signal = hist.new.Reg(25, -3, 5).Weight().fill(x3)
h_data = hist.new.Reg(25, -3, 5).Weight().fill(data_x)

# Create comparison plot
fig, ax_main, ax_comp = mh.comp.data_model(
 data_hist=h_data,
 stacked_components=[h_bkg2, h_bkg1, h_signal],
 stacked_labels=['Bkg2', 'Bkg1', 'Signal'],
 xlabel='Observable [GeV]',
 ylabel='Events'
)
txt_obj = mh.add_text('plothist', loc='over left', ax=ax_main)
# Generate signal, backgrounds, and data
x1 = np.random.normal(0, 1, 1400)
x2 = np.random.normal(1, 0.5, 1000)
x3 = np.random.exponential(0.5, 900) - 1.5
data_x = np.random.choice([*x1, *x2, *x3], size=3500, replace=True)
h_bkg1 = hist.new.Reg(25, -3, 5).Weight().fill(x1)
h_bkg2 = hist.new.Reg(25, -3, 5).Weight().fill(x2)
h_signal = hist.new.Reg(25, -3, 5).Weight().fill(x3)
h_data = hist.new.Reg(25, -3, 5).Weight().fill(data_x)

# The function will automatically sum the stacked and unstacked components
fig, ax_main, ax_comp = mh.comp.data_model(
 data_hist=h_data,
 stacked_components=[h_bkg2, h_bkg1],
 stacked_labels=['Bkg2', 'Bkg1'],
 stacked_colors=['grey', 'lightblue'],
 unstacked_components=[h_signal],
 unstacked_labels=['Signal'],
 unstacked_colors=['red'],
 xlabel='Observable [GeV]',
 ylabel='Events'
)
txt_obj = mh.add_text('plothist', loc='over left', ax=ax_main)
# Define component functions
def f_signal(x):
 return 200 * scipy.stats.norm.pdf(x, loc=0.5, scale=3)
def f_bkg1(x):
 return 500 * scipy.stats.norm.pdf(x, loc=-1.5, scale=4)
def f_bkg2(x):
 return 500 * scipy.stats.norm.pdf(x, loc=-1., scale=1.8)

# Generate data histogram
x_data = np.concatenate([np.random.normal(-1.5, 4, 1500), np.random.normal(-1., 1.8, 2000)])
data_hist = hist.new.Regular(50, -8, 8).Weight().fill(x_data)

# Create comparison plot
fig, ax_main, ax_comp = mh.comp.data_model(
 data_hist=data_hist,
 stacked_components=[f_bkg2, f_bkg1, f_signal],
 stacked_labels=['Bkg 2', 'Bkg 1', 'Signal'],
 xlabel='Observable [GeV]',
 ylabel='Events'
)
txt_obj = mh.add_text('plothist', loc='over left', ax=ax_main)
# Define component functions
def f_signal(x):
 return 200 * norm.pdf(x, loc=0.5, scale=3)
def f_bkg1(x):
 return 500 * norm.pdf(x, loc=-1.5, scale=4)
def f_bkg2(x):
 return 500 * norm.pdf(x, loc=-1., scale=1.8)

# Generate data histogram
x_data = np.concatenate([np.random.normal(-1.5, 4, 1500), np.random.normal(-1., 1.8, 2000)])
data_hist = hist.new.Regular(50, -8, 8).Weight().fill(x_data)

# Create comparison plot
fig, ax_main, ax_comp = mh.comp.data_model(
 data_hist=data_hist,
 stacked_components=[f_bkg2, f_bkg1,],
 stacked_labels=['Bkg 2', 'Bkg 1'],
 unstacked_components=[f_signal],
 unstacked_labels=['Signal'],
 xlabel='Observable [GeV]',
 ylabel='Events'
)
txt_obj = mh.add_text('plothist', loc='over left', ax=ax_main)
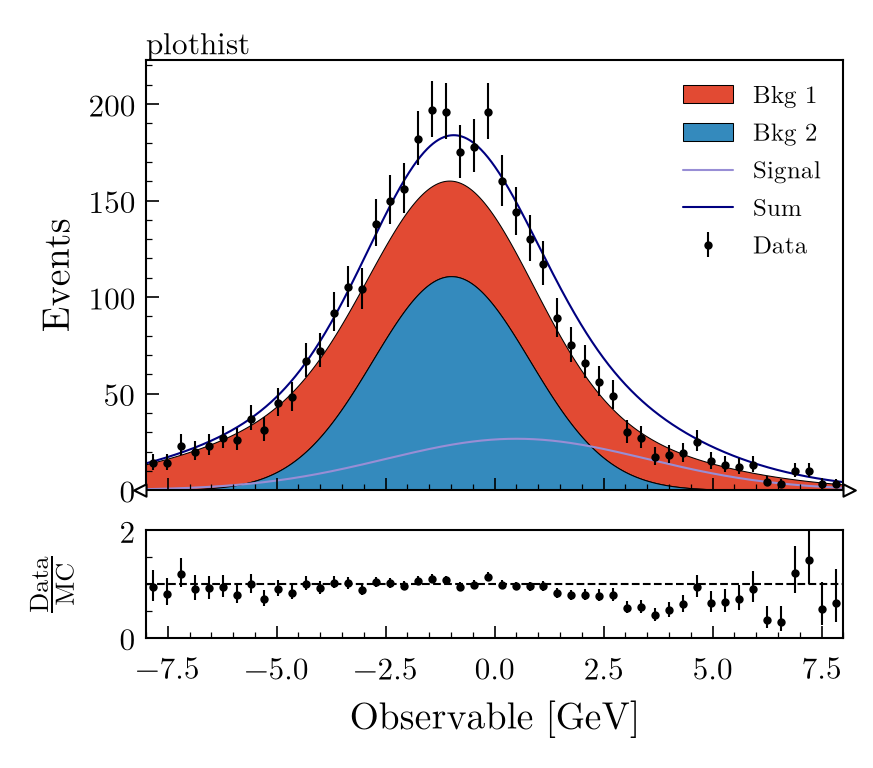
# Generate signal, backgrounds, and data
x1 = np.random.normal(0, 1, 1400)
x2 = np.random.normal(1, 0.5, 1000)
x3 = np.random.exponential(0.5, 900) - 1.5
data_x = np.random.choice([*x1, *x2, *x3], size=3500, replace=True)
h_bkg1 = hist.new.Reg(25, -3, 5).Weight().fill(x1)
h_bkg2 = hist.new.Reg(25, -3, 5).Weight().fill(x2)
h_signal = hist.new.Reg(25, -3, 5).Weight().fill(x3)
h_data = hist.new.Reg(25, -3, 5).Weight().fill(data_x)

# Create comparison plot
fig, ax_main, ax_comp = mh.comp.data_model(
 data_hist=h_data,
 stacked_components=[h_bkg2, h_bkg1, h_signal],
 stacked_labels=['Bkg2', 'Bkg1', 'Signal'],
 xlabel='Observable [GeV]',
 ylabel='Events'
)
mh.cms.label(data=True, lumi=100, ax=ax_main)
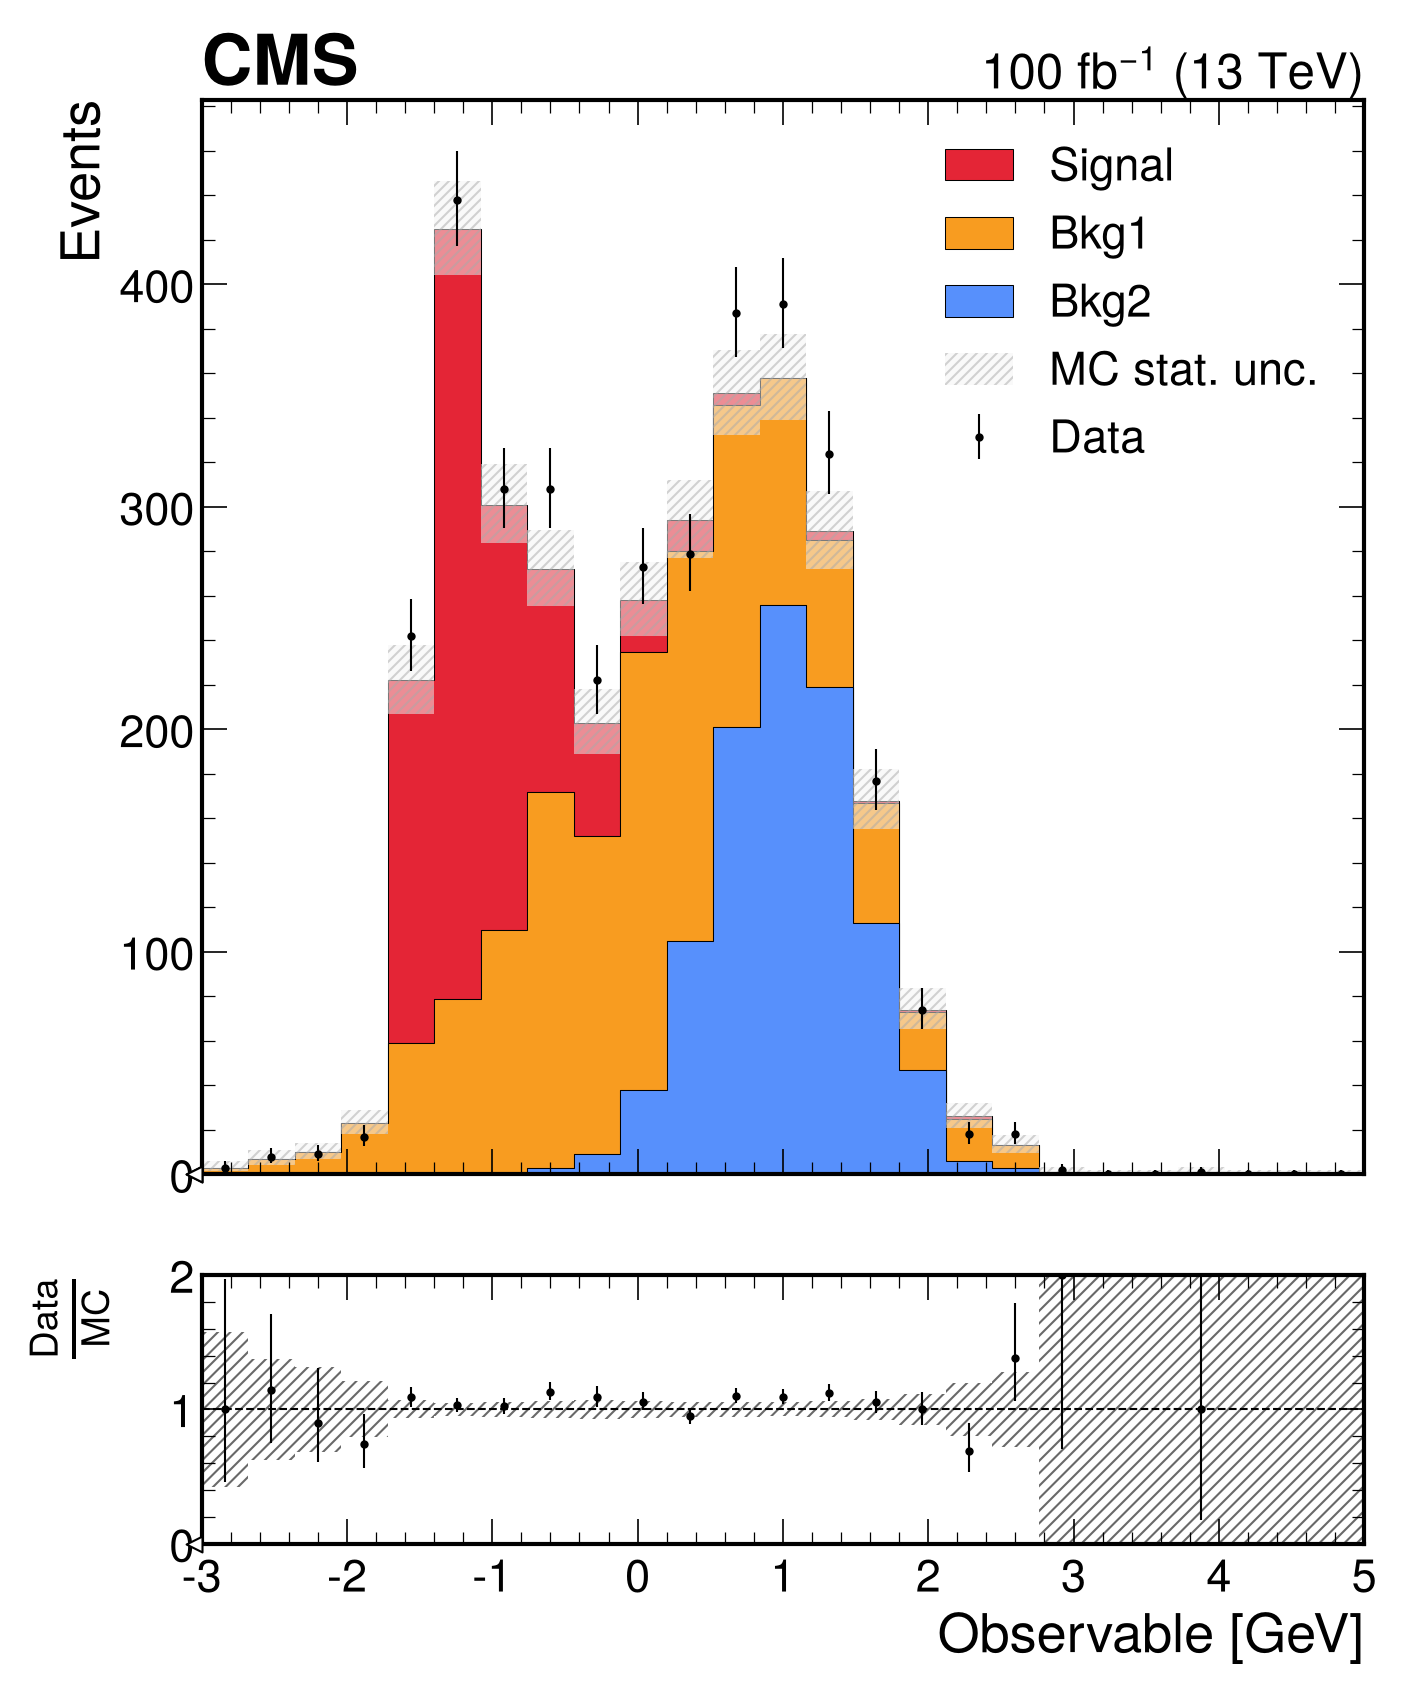
# Generate signal, backgrounds, and data
x1 = np.random.normal(0, 1, 1400)
x2 = np.random.normal(1, 0.5, 1000)
x3 = np.random.exponential(0.5, 900) - 1.5
data_x = np.random.choice([*x1, *x2, *x3], size=3500, replace=True)
h_bkg1 = hist.new.Reg(25, -3, 5).Weight().fill(x1)
h_bkg2 = hist.new.Reg(25, -3, 5).Weight().fill(x2)
h_signal = hist.new.Reg(25, -3, 5).Weight().fill(x3)
h_data = hist.new.Reg(25, -3, 5).Weight().fill(data_x)

# The function will automatically sum the stacked and unstacked components
fig, ax_main, ax_comp = mh.comp.data_model(
 data_hist=h_data,
 stacked_components=[h_bkg2, h_bkg1],
 stacked_labels=['Bkg2', 'Bkg1'],
 stacked_colors=['grey', 'lightblue'],
 unstacked_components=[h_signal],
 unstacked_labels=['Signal'],
 unstacked_colors=['red'],
 xlabel='Observable [GeV]',
 ylabel='Events'
)
mh.cms.label(data=True, lumi=100, ax=ax_main)
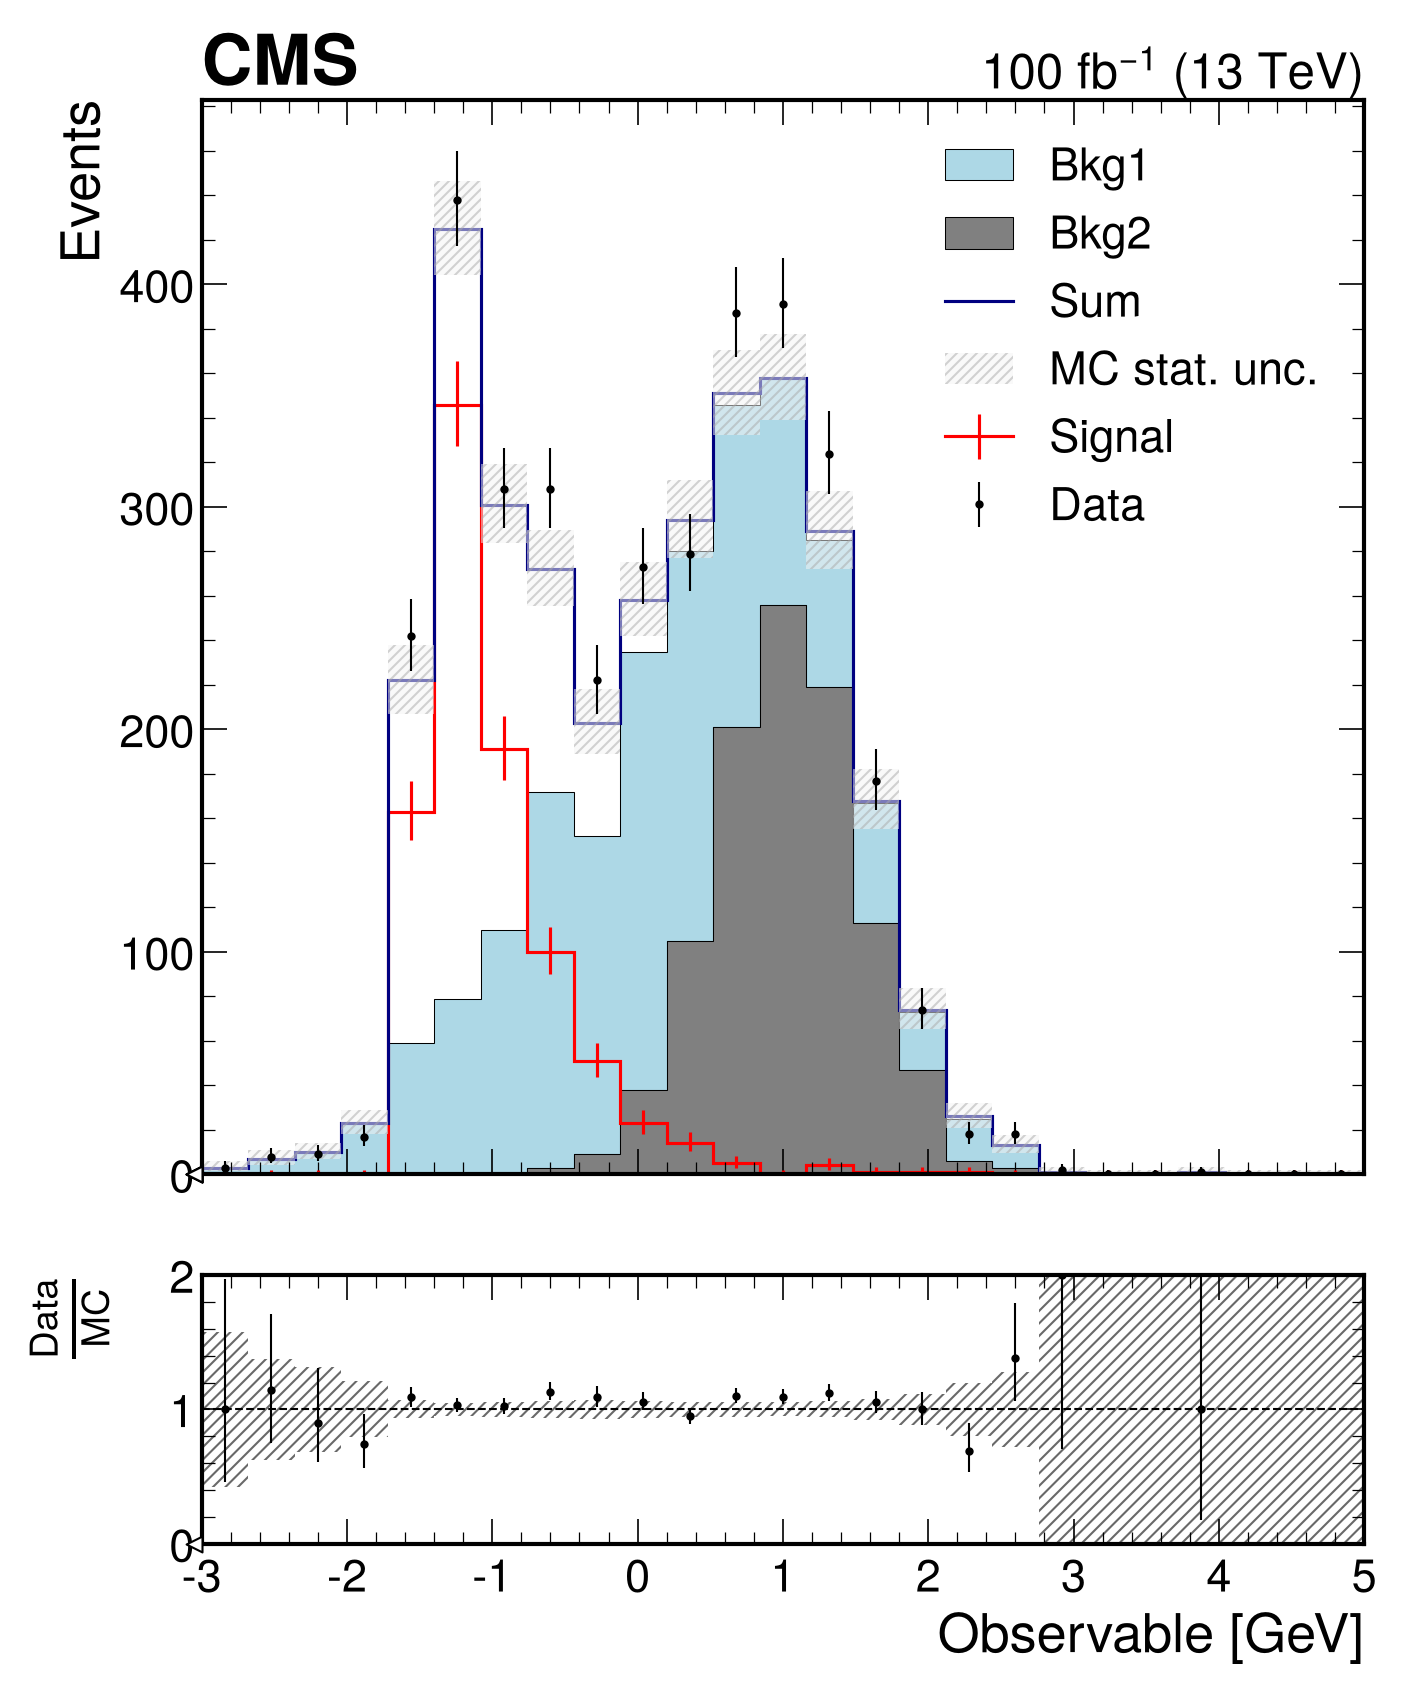
# Define component functions
def f_signal(x):
 return 200 * scipy.stats.norm.pdf(x, loc=0.5, scale=3)
def f_bkg1(x):
 return 500 * scipy.stats.norm.pdf(x, loc=-1.5, scale=4)
def f_bkg2(x):
 return 500 * scipy.stats.norm.pdf(x, loc=-1., scale=1.8)

# Generate data histogram
x_data = np.concatenate([np.random.normal(-1.5, 4, 1500), np.random.normal(-1., 1.8, 2000)])
data_hist = hist.new.Regular(50, -8, 8).Weight().fill(x_data)

# Create comparison plot
fig, ax_main, ax_comp = mh.comp.data_model(
 data_hist=data_hist,
 stacked_components=[f_bkg2, f_bkg1, f_signal],
 stacked_labels=['Bkg 2', 'Bkg 1', 'Signal'],
 xlabel='Observable [GeV]',
 ylabel='Events'
)
mh.cms.label(data=True, lumi=100, ax=ax_main)
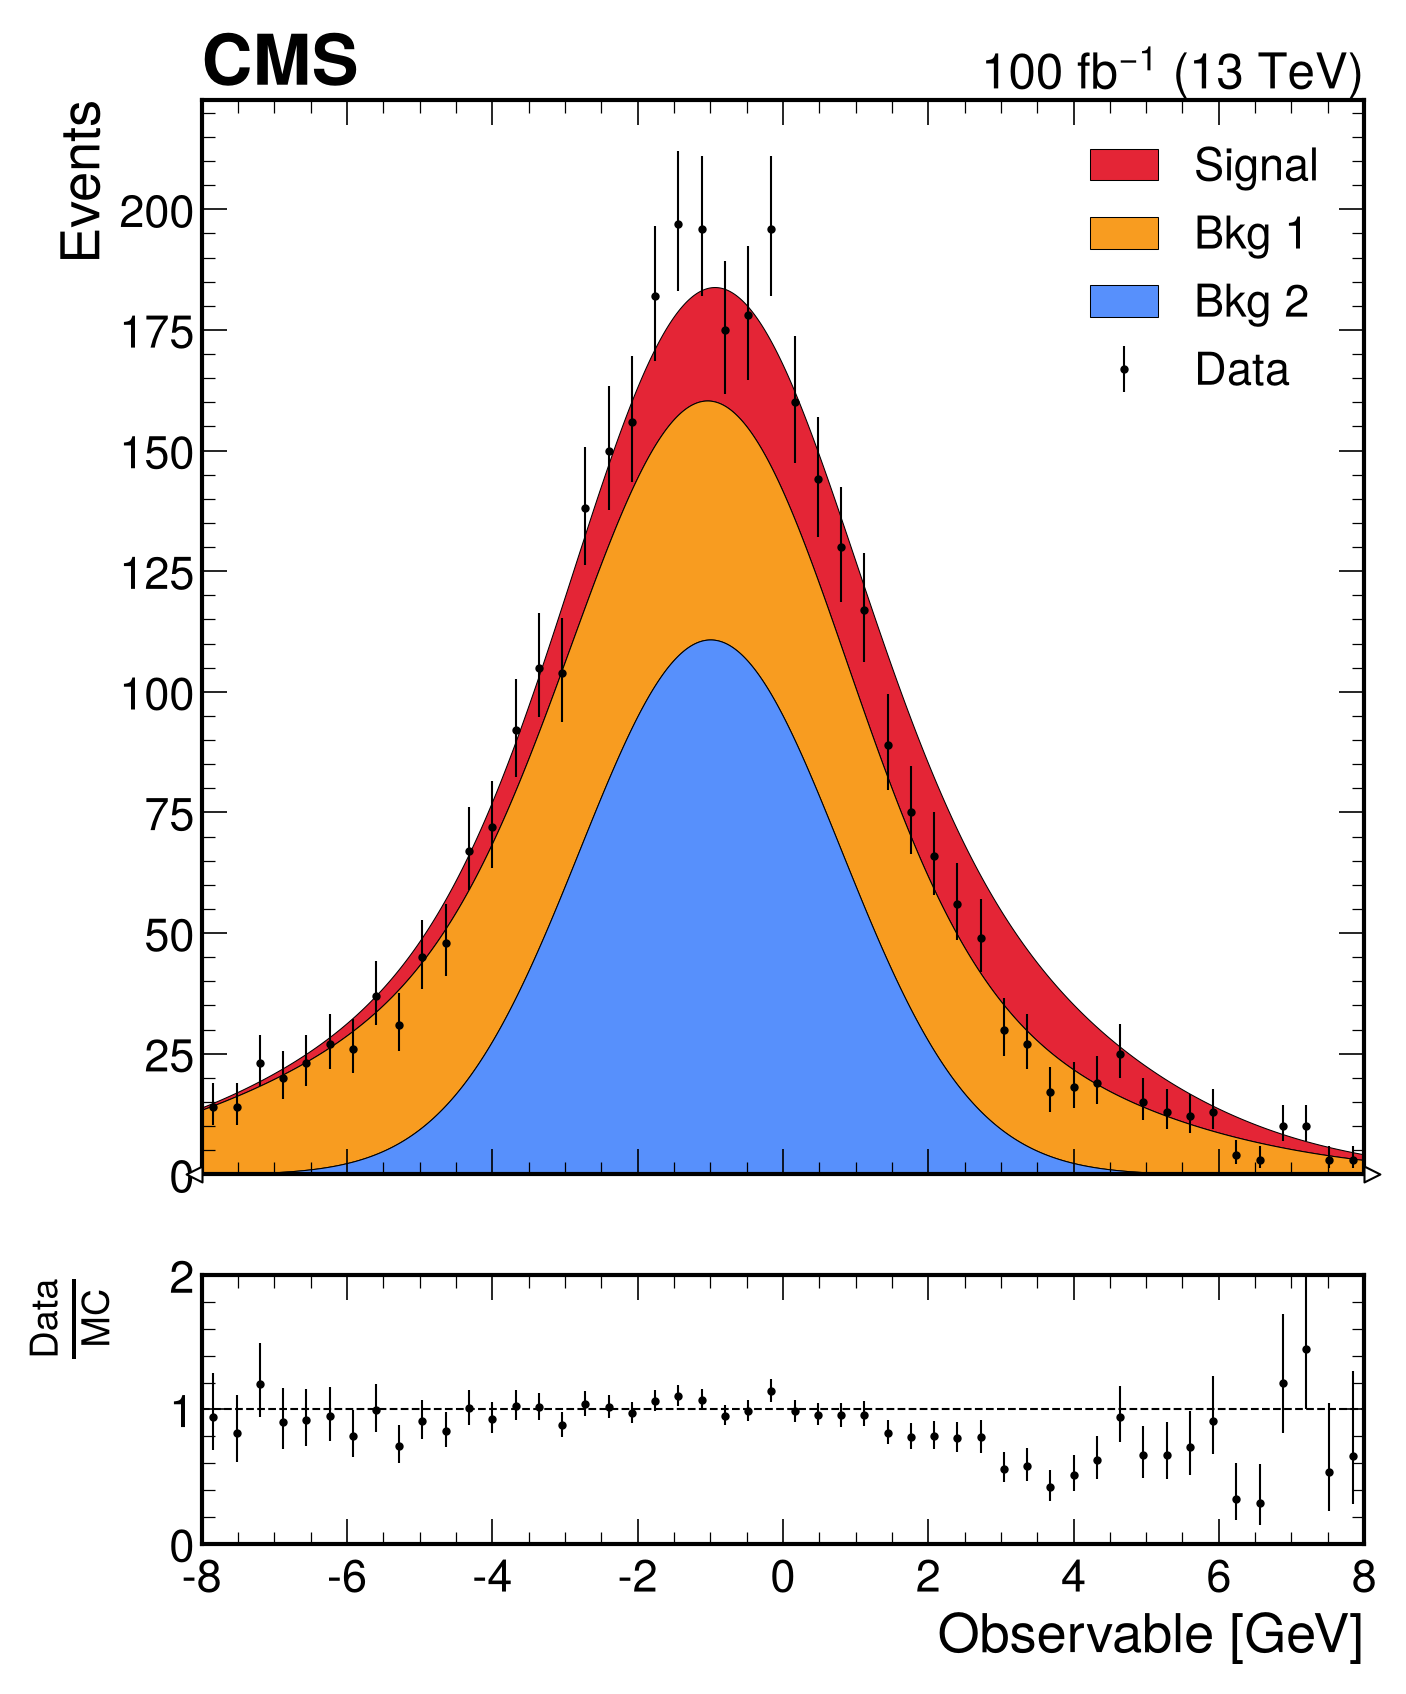
# Define component functions
def f_signal(x):
 return 200 * norm.pdf(x, loc=0.5, scale=3)
def f_bkg1(x):
 return 500 * norm.pdf(x, loc=-1.5, scale=4)
def f_bkg2(x):
 return 500 * norm.pdf(x, loc=-1., scale=1.8)

# Generate data histogram
x_data = np.concatenate([np.random.normal(-1.5, 4, 1500), np.random.normal(-1., 1.8, 2000)])
data_hist = hist.new.Regular(50, -8, 8).Weight().fill(x_data)

# Create comparison plot
fig, ax_main, ax_comp = mh.comp.data_model(
 data_hist=data_hist,
 stacked_components=[f_bkg2, f_bkg1,],
 stacked_labels=['Bkg 2', 'Bkg 1'],
 unstacked_components=[f_signal],
 unstacked_labels=['Signal'],
 xlabel='Observable [GeV]',
 ylabel='Events'
)
mh.cms.label(data=True, lumi=100, ax=ax_main)
# Generate signal, backgrounds, and data
x1 = np.random.normal(0, 1, 1400)
x2 = np.random.normal(1, 0.5, 1000)
x3 = np.random.exponential(0.5, 900) - 1.5
data_x = np.random.choice([*x1, *x2, *x3], size=3500, replace=True)
h_bkg1 = hist.new.Reg(25, -3, 5).Weight().fill(x1)
h_bkg2 = hist.new.Reg(25, -3, 5).Weight().fill(x2)
h_signal = hist.new.Reg(25, -3, 5).Weight().fill(x3)
h_data = hist.new.Reg(25, -3, 5).Weight().fill(data_x)

# Create comparison plot
fig, ax_main, ax_comp = mh.comp.data_model(
 data_hist=h_data,
 stacked_components=[h_bkg2, h_bkg1, h_signal],
 stacked_labels=['Bkg2', 'Bkg1', 'Signal'],
 xlabel='Observable [GeV]',
 ylabel='Events'
)
mh.atlas.label(data=True, lumi=150, ax=ax_main)
mh.mpl_magic(soft_fail=True)
# Generate signal, backgrounds, and data
x1 = np.random.normal(0, 1, 1400)
x2 = np.random.normal(1, 0.5, 1000)
x3 = np.random.exponential(0.5, 900) - 1.5
data_x = np.random.choice([*x1, *x2, *x3], size=3500, replace=True)
h_bkg1 = hist.new.Reg(25, -3, 5).Weight().fill(x1)
h_bkg2 = hist.new.Reg(25, -3, 5).Weight().fill(x2)
h_signal = hist.new.Reg(25, -3, 5).Weight().fill(x3)
h_data = hist.new.Reg(25, -3, 5).Weight().fill(data_x)

# The function will automatically sum the stacked and unstacked components
fig, ax_main, ax_comp = mh.comp.data_model(
 data_hist=h_data,
 stacked_components=[h_bkg2, h_bkg1],
 stacked_labels=['Bkg2', 'Bkg1'],
 stacked_colors=['grey', 'lightblue'],
 unstacked_components=[h_signal],
 unstacked_labels=['Signal'],
 unstacked_colors=['red'],
 xlabel='Observable [GeV]',
 ylabel='Events'
)
mh.atlas.label(data=True, lumi=150, ax=ax_main)
mh.mpl_magic(soft_fail=True)
# Define component functions
def f_signal(x):
 return 200 * scipy.stats.norm.pdf(x, loc=0.5, scale=3)
def f_bkg1(x):
 return 500 * scipy.stats.norm.pdf(x, loc=-1.5, scale=4)
def f_bkg2(x):
 return 500 * scipy.stats.norm.pdf(x, loc=-1., scale=1.8)

# Generate data histogram
x_data = np.concatenate([np.random.normal(-1.5, 4, 1500), np.random.normal(-1., 1.8, 2000)])
data_hist = hist.new.Regular(50, -8, 8).Weight().fill(x_data)

# Create comparison plot
fig, ax_main, ax_comp = mh.comp.data_model(
 data_hist=data_hist,
 stacked_components=[f_bkg2, f_bkg1, f_signal],
 stacked_labels=['Bkg 2', 'Bkg 1', 'Signal'],
 xlabel='Observable [GeV]',
 ylabel='Events'
)
mh.atlas.label(data=True, lumi=150, ax=ax_main)
mh.mpl_magic(soft_fail=True)
# Define component functions
def f_signal(x):
 return 200 * norm.pdf(x, loc=0.5, scale=3)
def f_bkg1(x):
 return 500 * norm.pdf(x, loc=-1.5, scale=4)
def f_bkg2(x):
 return 500 * norm.pdf(x, loc=-1., scale=1.8)

# Generate data histogram
x_data = np.concatenate([np.random.normal(-1.5, 4, 1500), np.random.normal(-1., 1.8, 2000)])
data_hist = hist.new.Regular(50, -8, 8).Weight().fill(x_data)

# Create comparison plot
fig, ax_main, ax_comp = mh.comp.data_model(
 data_hist=data_hist,
 stacked_components=[f_bkg2, f_bkg1,],
 stacked_labels=['Bkg 2', 'Bkg 1'],
 unstacked_components=[f_signal],
 unstacked_labels=['Signal'],
 xlabel='Observable [GeV]',
 ylabel='Events'
)
mh.atlas.label(data=True, lumi=150, ax=ax_main)
mh.mpl_magic(soft_fail=True)
# Generate signal, backgrounds, and data
x1 = np.random.normal(0, 1, 1400)
x2 = np.random.normal(1, 0.5, 1000)
x3 = np.random.exponential(0.5, 900) - 1.5
data_x = np.random.choice([*x1, *x2, *x3], size=3500, replace=True)
h_bkg1 = hist.new.Reg(25, -3, 5).Weight().fill(x1)
h_bkg2 = hist.new.Reg(25, -3, 5).Weight().fill(x2)
h_signal = hist.new.Reg(25, -3, 5).Weight().fill(x3)
h_data = hist.new.Reg(25, -3, 5).Weight().fill(data_x)

# Create comparison plot
fig, ax_main, ax_comp = mh.comp.data_model(
 data_hist=h_data,
 stacked_components=[h_bkg2, h_bkg1, h_signal],
 stacked_labels=['Bkg2', 'Bkg1', 'Signal'],
 xlabel='Observable [GeV]',
 ylabel='Events'
)
mh.lhcb.label(data=True, lumi=50, ax=ax_main)
# Generate signal, backgrounds, and data
x1 = np.random.normal(0, 1, 1400)
x2 = np.random.normal(1, 0.5, 1000)
x3 = np.random.exponential(0.5, 900) - 1.5
data_x = np.random.choice([*x1, *x2, *x3], size=3500, replace=True)
h_bkg1 = hist.new.Reg(25, -3, 5).Weight().fill(x1)
h_bkg2 = hist.new.Reg(25, -3, 5).Weight().fill(x2)
h_signal = hist.new.Reg(25, -3, 5).Weight().fill(x3)
h_data = hist.new.Reg(25, -3, 5).Weight().fill(data_x)

# The function will automatically sum the stacked and unstacked components
fig, ax_main, ax_comp = mh.comp.data_model(
 data_hist=h_data,
 stacked_components=[h_bkg2, h_bkg1],
 stacked_labels=['Bkg2', 'Bkg1'],
 stacked_colors=['grey', 'lightblue'],
 unstacked_components=[h_signal],
 unstacked_labels=['Signal'],
 unstacked_colors=['red'],
 xlabel='Observable [GeV]',
 ylabel='Events'
)
mh.lhcb.label(data=True, lumi=50, ax=ax_main)
# Define component functions
def f_signal(x):
 return 200 * scipy.stats.norm.pdf(x, loc=0.5, scale=3)
def f_bkg1(x):
 return 500 * scipy.stats.norm.pdf(x, loc=-1.5, scale=4)
def f_bkg2(x):
 return 500 * scipy.stats.norm.pdf(x, loc=-1., scale=1.8)

# Generate data histogram
x_data = np.concatenate([np.random.normal(-1.5, 4, 1500), np.random.normal(-1., 1.8, 2000)])
data_hist = hist.new.Regular(50, -8, 8).Weight().fill(x_data)

# Create comparison plot
fig, ax_main, ax_comp = mh.comp.data_model(
 data_hist=data_hist,
 stacked_components=[f_bkg2, f_bkg1, f_signal],
 stacked_labels=['Bkg 2', 'Bkg 1', 'Signal'],
 xlabel='Observable [GeV]',
 ylabel='Events'
)
mh.lhcb.label(data=True, lumi=50, ax=ax_main)
# Define component functions
def f_signal(x):
 return 200 * norm.pdf(x, loc=0.5, scale=3)
def f_bkg1(x):
 return 500 * norm.pdf(x, loc=-1.5, scale=4)
def f_bkg2(x):
 return 500 * norm.pdf(x, loc=-1., scale=1.8)

# Generate data histogram
x_data = np.concatenate([np.random.normal(-1.5, 4, 1500), np.random.normal(-1., 1.8, 2000)])
data_hist = hist.new.Regular(50, -8, 8).Weight().fill(x_data)

# Create comparison plot
fig, ax_main, ax_comp = mh.comp.data_model(
 data_hist=data_hist,
 stacked_components=[f_bkg2, f_bkg1,],
 stacked_labels=['Bkg 2', 'Bkg 1'],
 unstacked_components=[f_signal],
 unstacked_labels=['Signal'],
 xlabel='Observable [GeV]',
 ylabel='Events'
)
mh.lhcb.label(data=True, lumi=50, ax=ax_main)
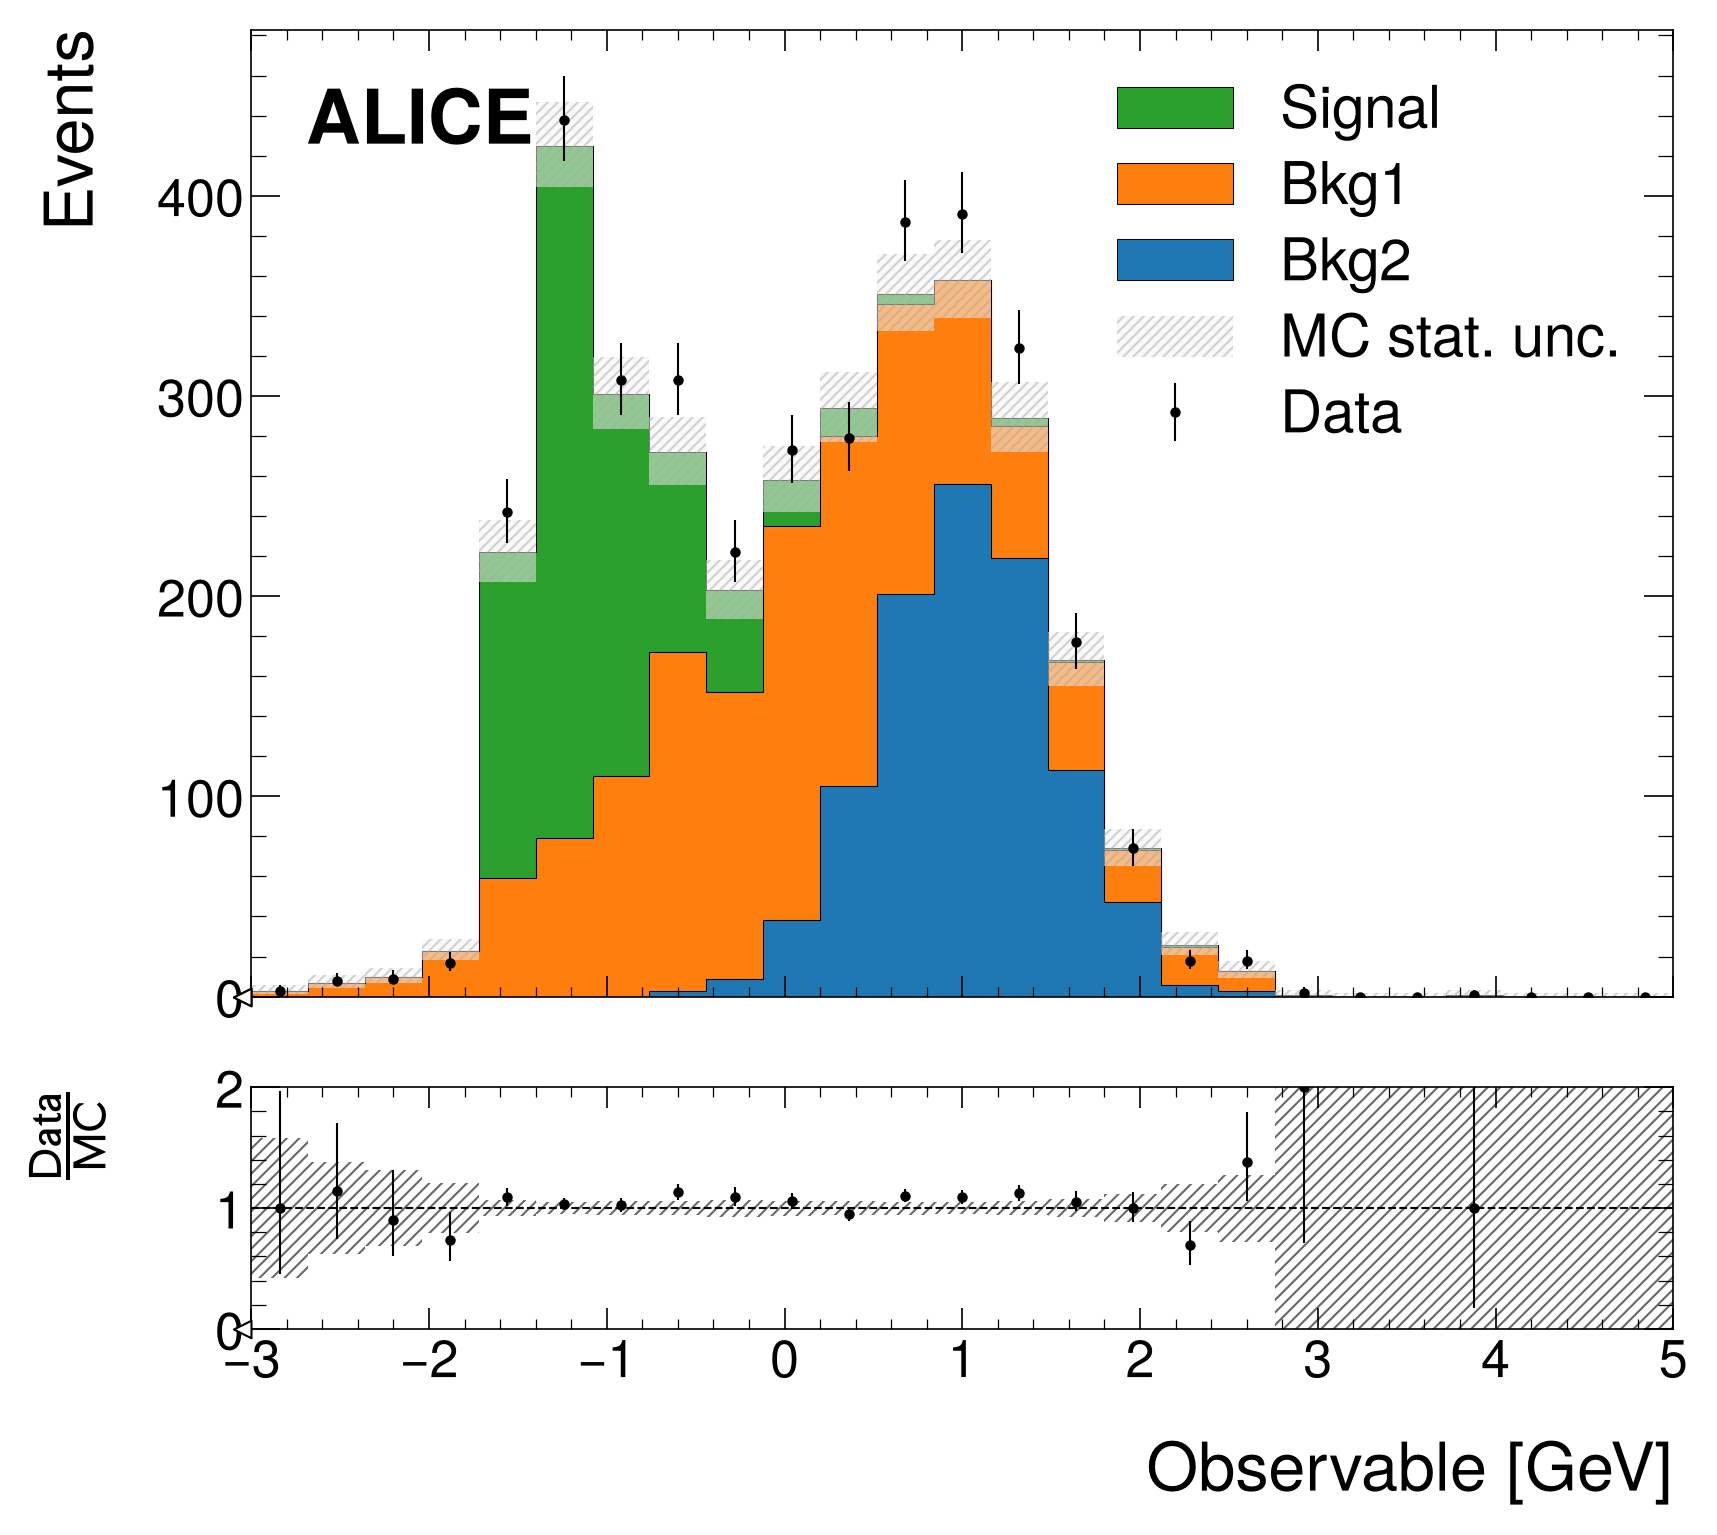
# Generate signal, backgrounds, and data
x1 = np.random.normal(0, 1, 1400)
x2 = np.random.normal(1, 0.5, 1000)
x3 = np.random.exponential(0.5, 900) - 1.5
data_x = np.random.choice([*x1, *x2, *x3], size=3500, replace=True)
h_bkg1 = hist.new.Reg(25, -3, 5).Weight().fill(x1)
h_bkg2 = hist.new.Reg(25, -3, 5).Weight().fill(x2)
h_signal = hist.new.Reg(25, -3, 5).Weight().fill(x3)
h_data = hist.new.Reg(25, -3, 5).Weight().fill(data_x)

# Create comparison plot
fig, ax_main, ax_comp = mh.comp.data_model(
 data_hist=h_data,
 stacked_components=[h_bkg2, h_bkg1, h_signal],
 stacked_labels=['Bkg2', 'Bkg1', 'Signal'],
 xlabel='Observable [GeV]',
 ylabel='Events'
)
mh.alice.label(data=True, lumi=100, ax=ax_main)
mh.mpl_magic(soft_fail=True)
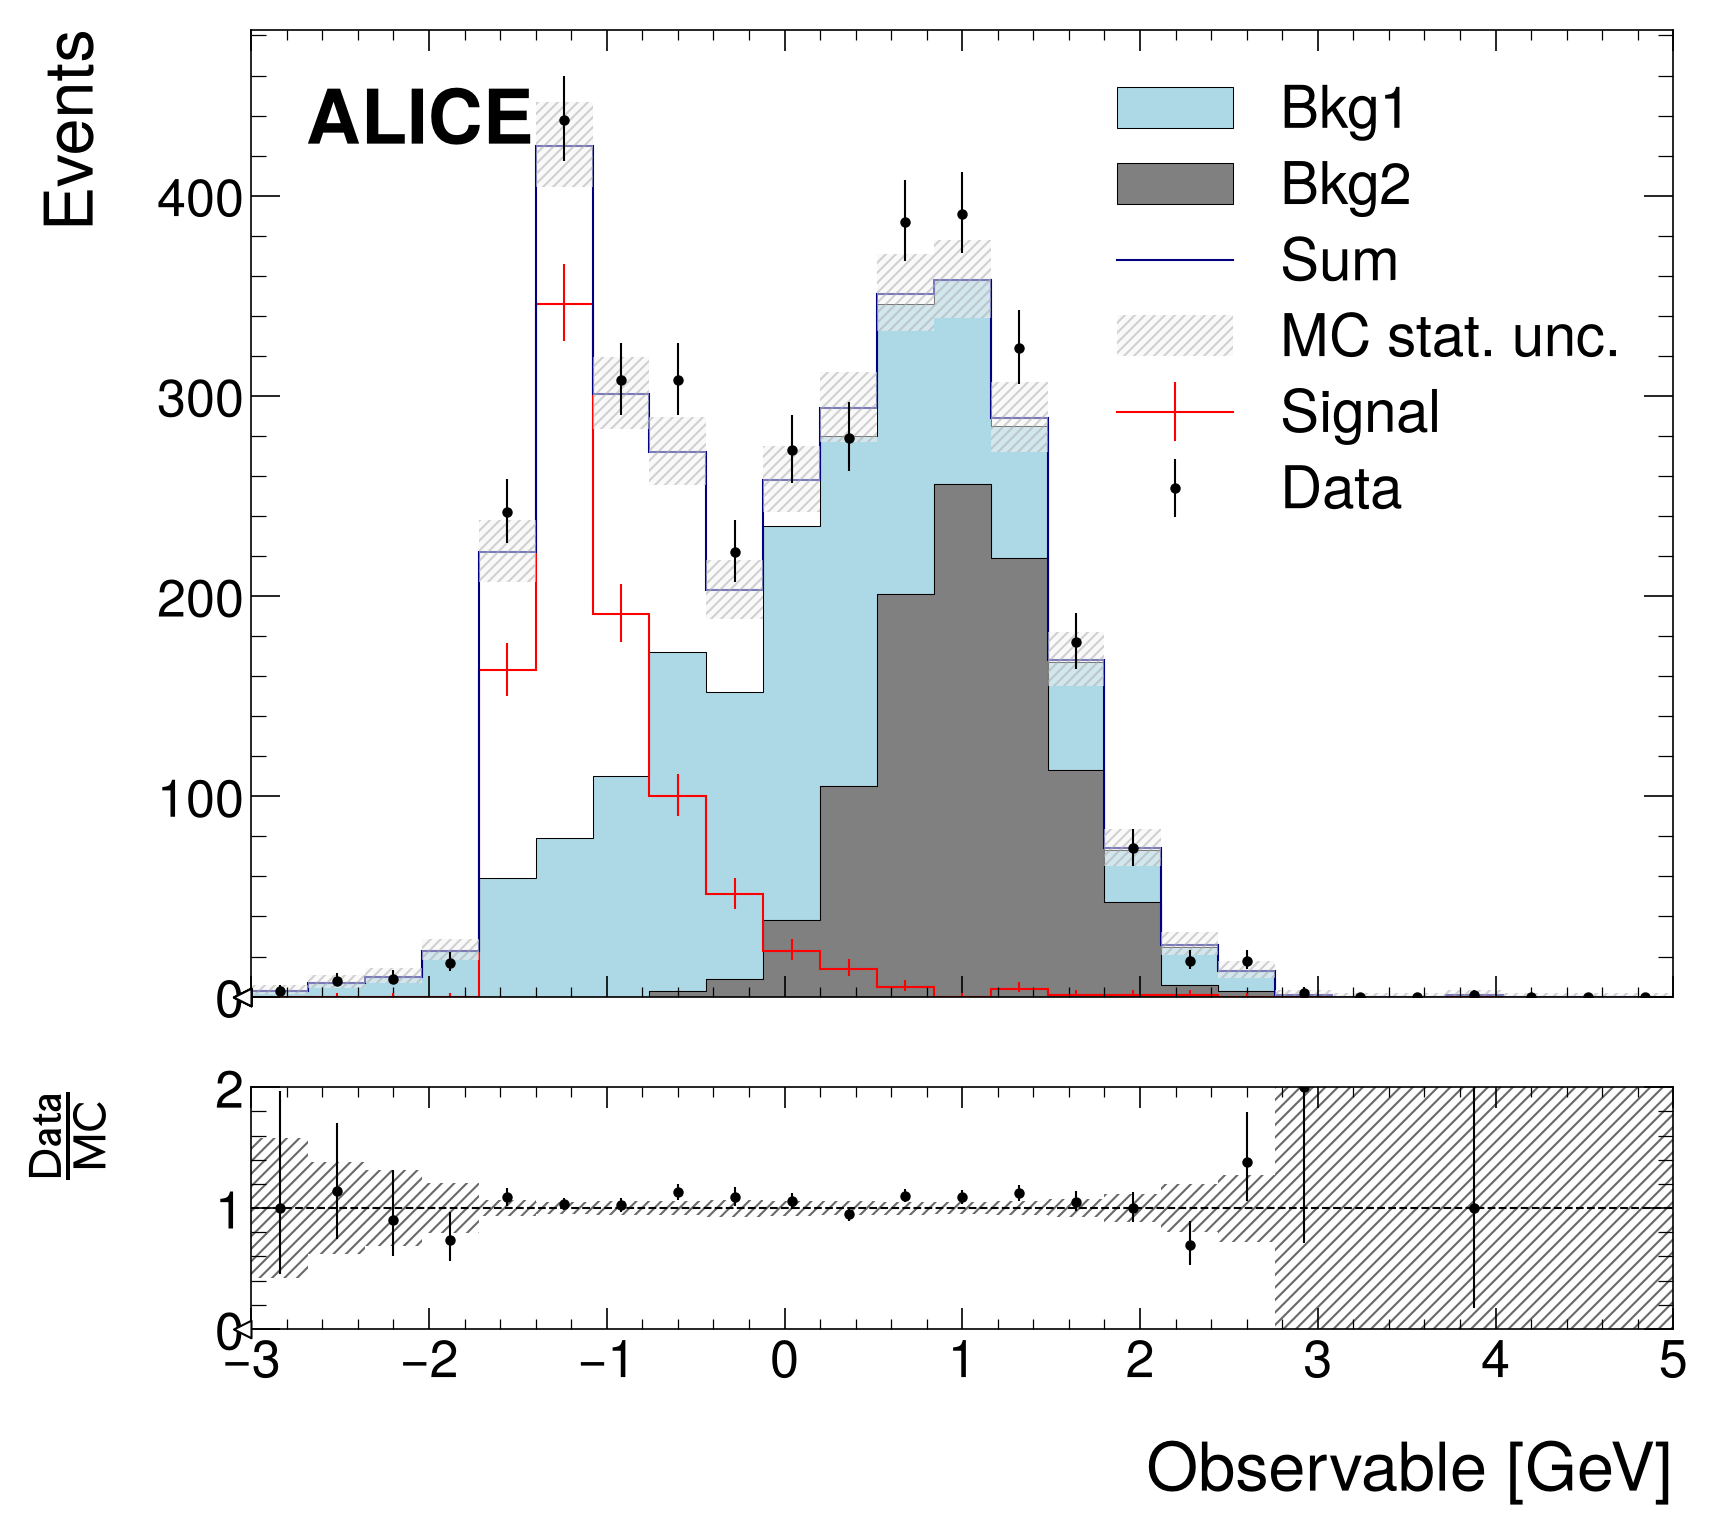
# Generate signal, backgrounds, and data
x1 = np.random.normal(0, 1, 1400)
x2 = np.random.normal(1, 0.5, 1000)
x3 = np.random.exponential(0.5, 900) - 1.5
data_x = np.random.choice([*x1, *x2, *x3], size=3500, replace=True)
h_bkg1 = hist.new.Reg(25, -3, 5).Weight().fill(x1)
h_bkg2 = hist.new.Reg(25, -3, 5).Weight().fill(x2)
h_signal = hist.new.Reg(25, -3, 5).Weight().fill(x3)
h_data = hist.new.Reg(25, -3, 5).Weight().fill(data_x)

# The function will automatically sum the stacked and unstacked components
fig, ax_main, ax_comp = mh.comp.data_model(
 data_hist=h_data,
 stacked_components=[h_bkg2, h_bkg1],
 stacked_labels=['Bkg2', 'Bkg1'],
 stacked_colors=['grey', 'lightblue'],
 unstacked_components=[h_signal],
 unstacked_labels=['Signal'],
 unstacked_colors=['red'],
 xlabel='Observable [GeV]',
 ylabel='Events'
)
mh.alice.label(data=True, lumi=100, ax=ax_main)
mh.mpl_magic(soft_fail=True)
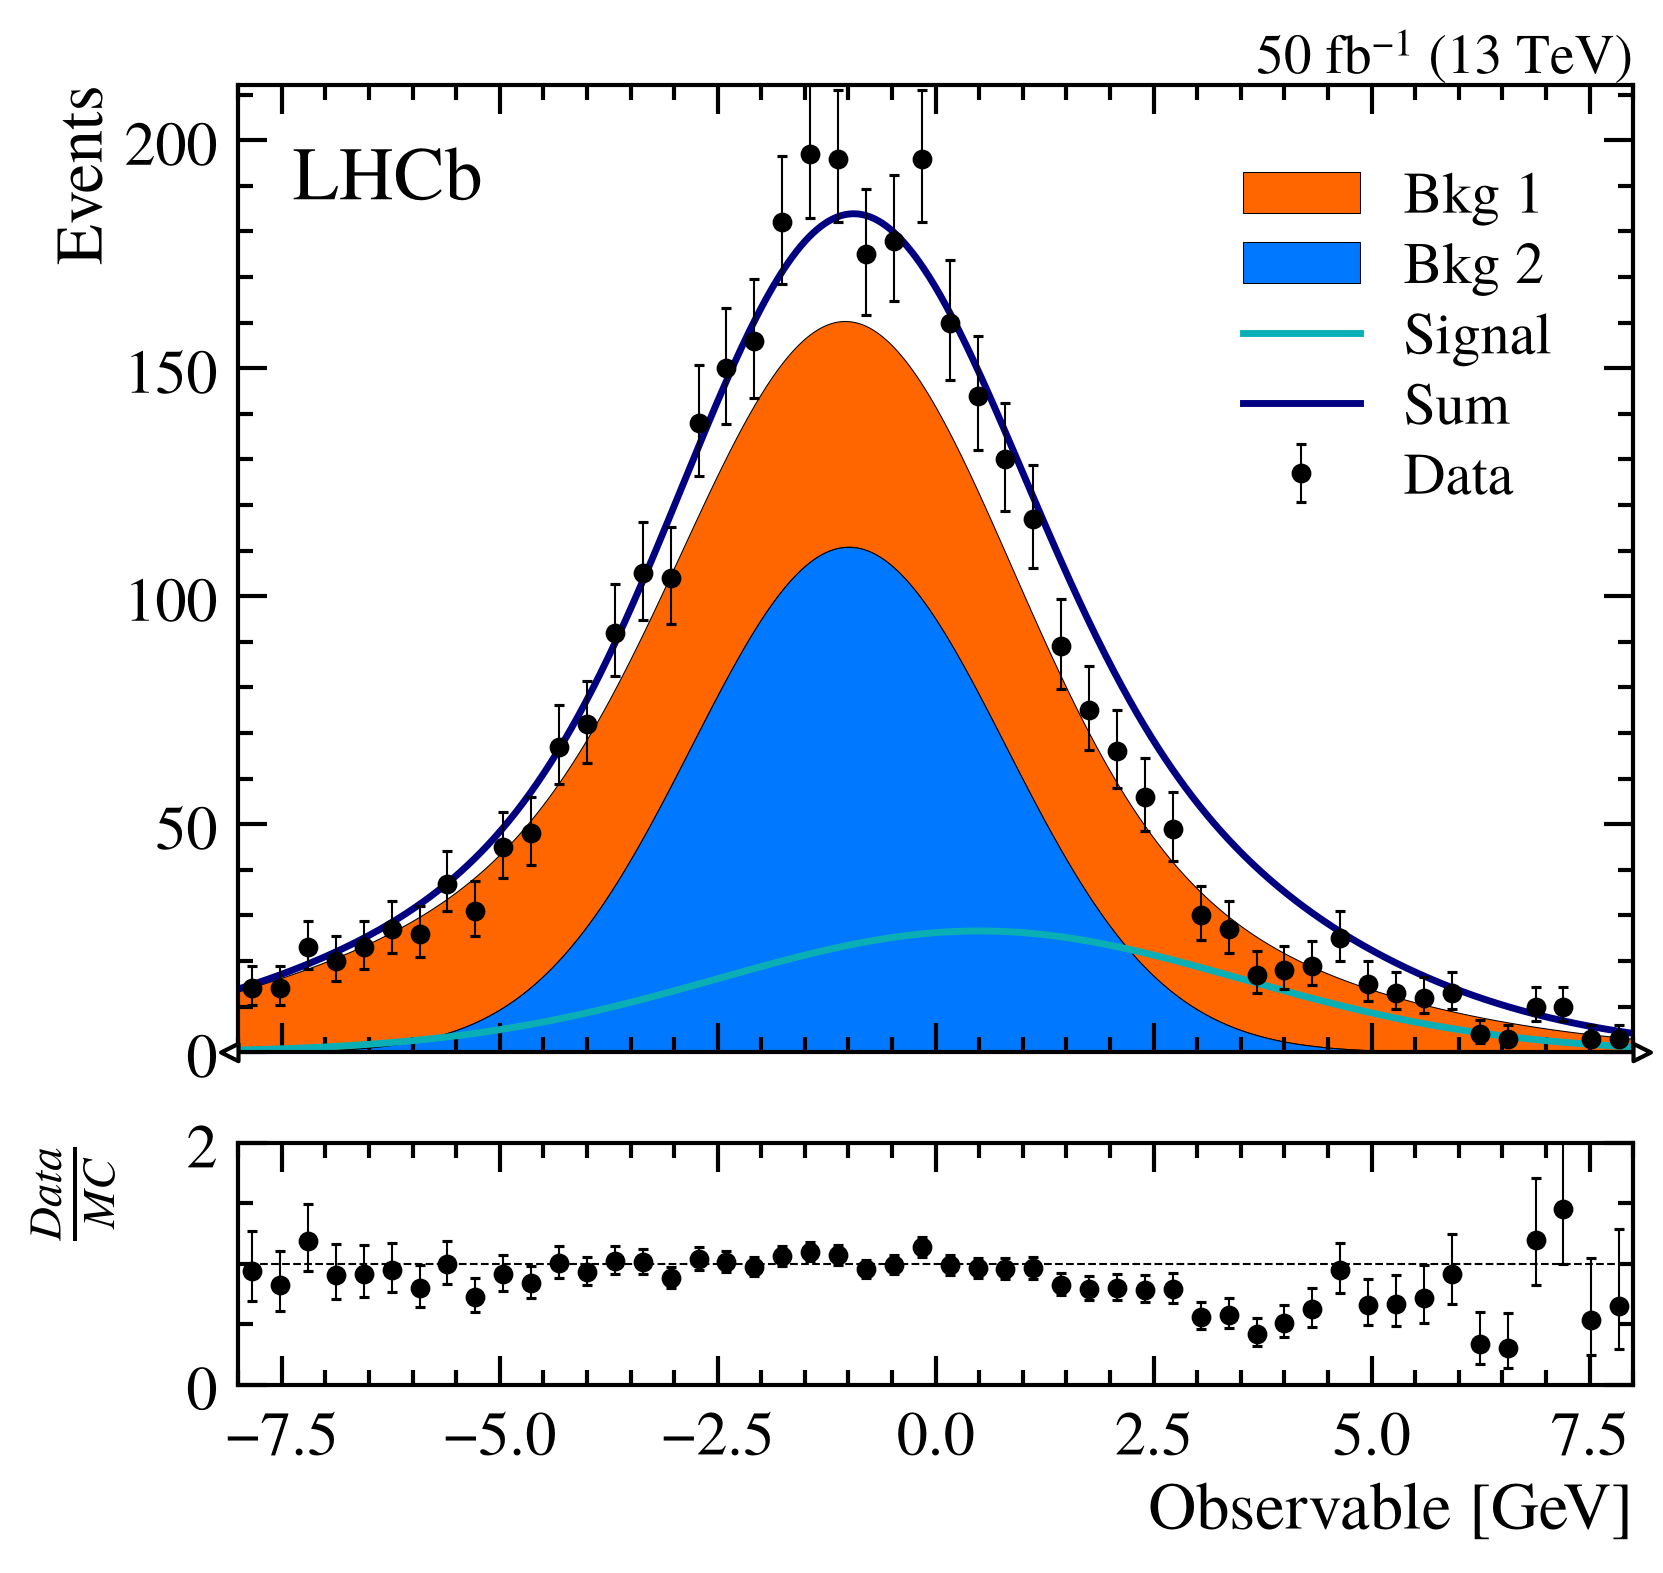
# Define component functions
def f_signal(x):
 return 200 * scipy.stats.norm.pdf(x, loc=0.5, scale=3)
def f_bkg1(x):
 return 500 * scipy.stats.norm.pdf(x, loc=-1.5, scale=4)
def f_bkg2(x):
 return 500 * scipy.stats.norm.pdf(x, loc=-1., scale=1.8)

# Generate data histogram
x_data = np.concatenate([np.random.normal(-1.5, 4, 1500), np.random.normal(-1., 1.8, 2000)])
data_hist = hist.new.Regular(50, -8, 8).Weight().fill(x_data)

# Create comparison plot
fig, ax_main, ax_comp = mh.comp.data_model(
 data_hist=data_hist,
 stacked_components=[f_bkg2, f_bkg1, f_signal],
 stacked_labels=['Bkg 2', 'Bkg 1', 'Signal'],
 xlabel='Observable [GeV]',
 ylabel='Events'
)
mh.alice.label(data=True, lumi=100, ax=ax_main)
mh.mpl_magic(soft_fail=True)
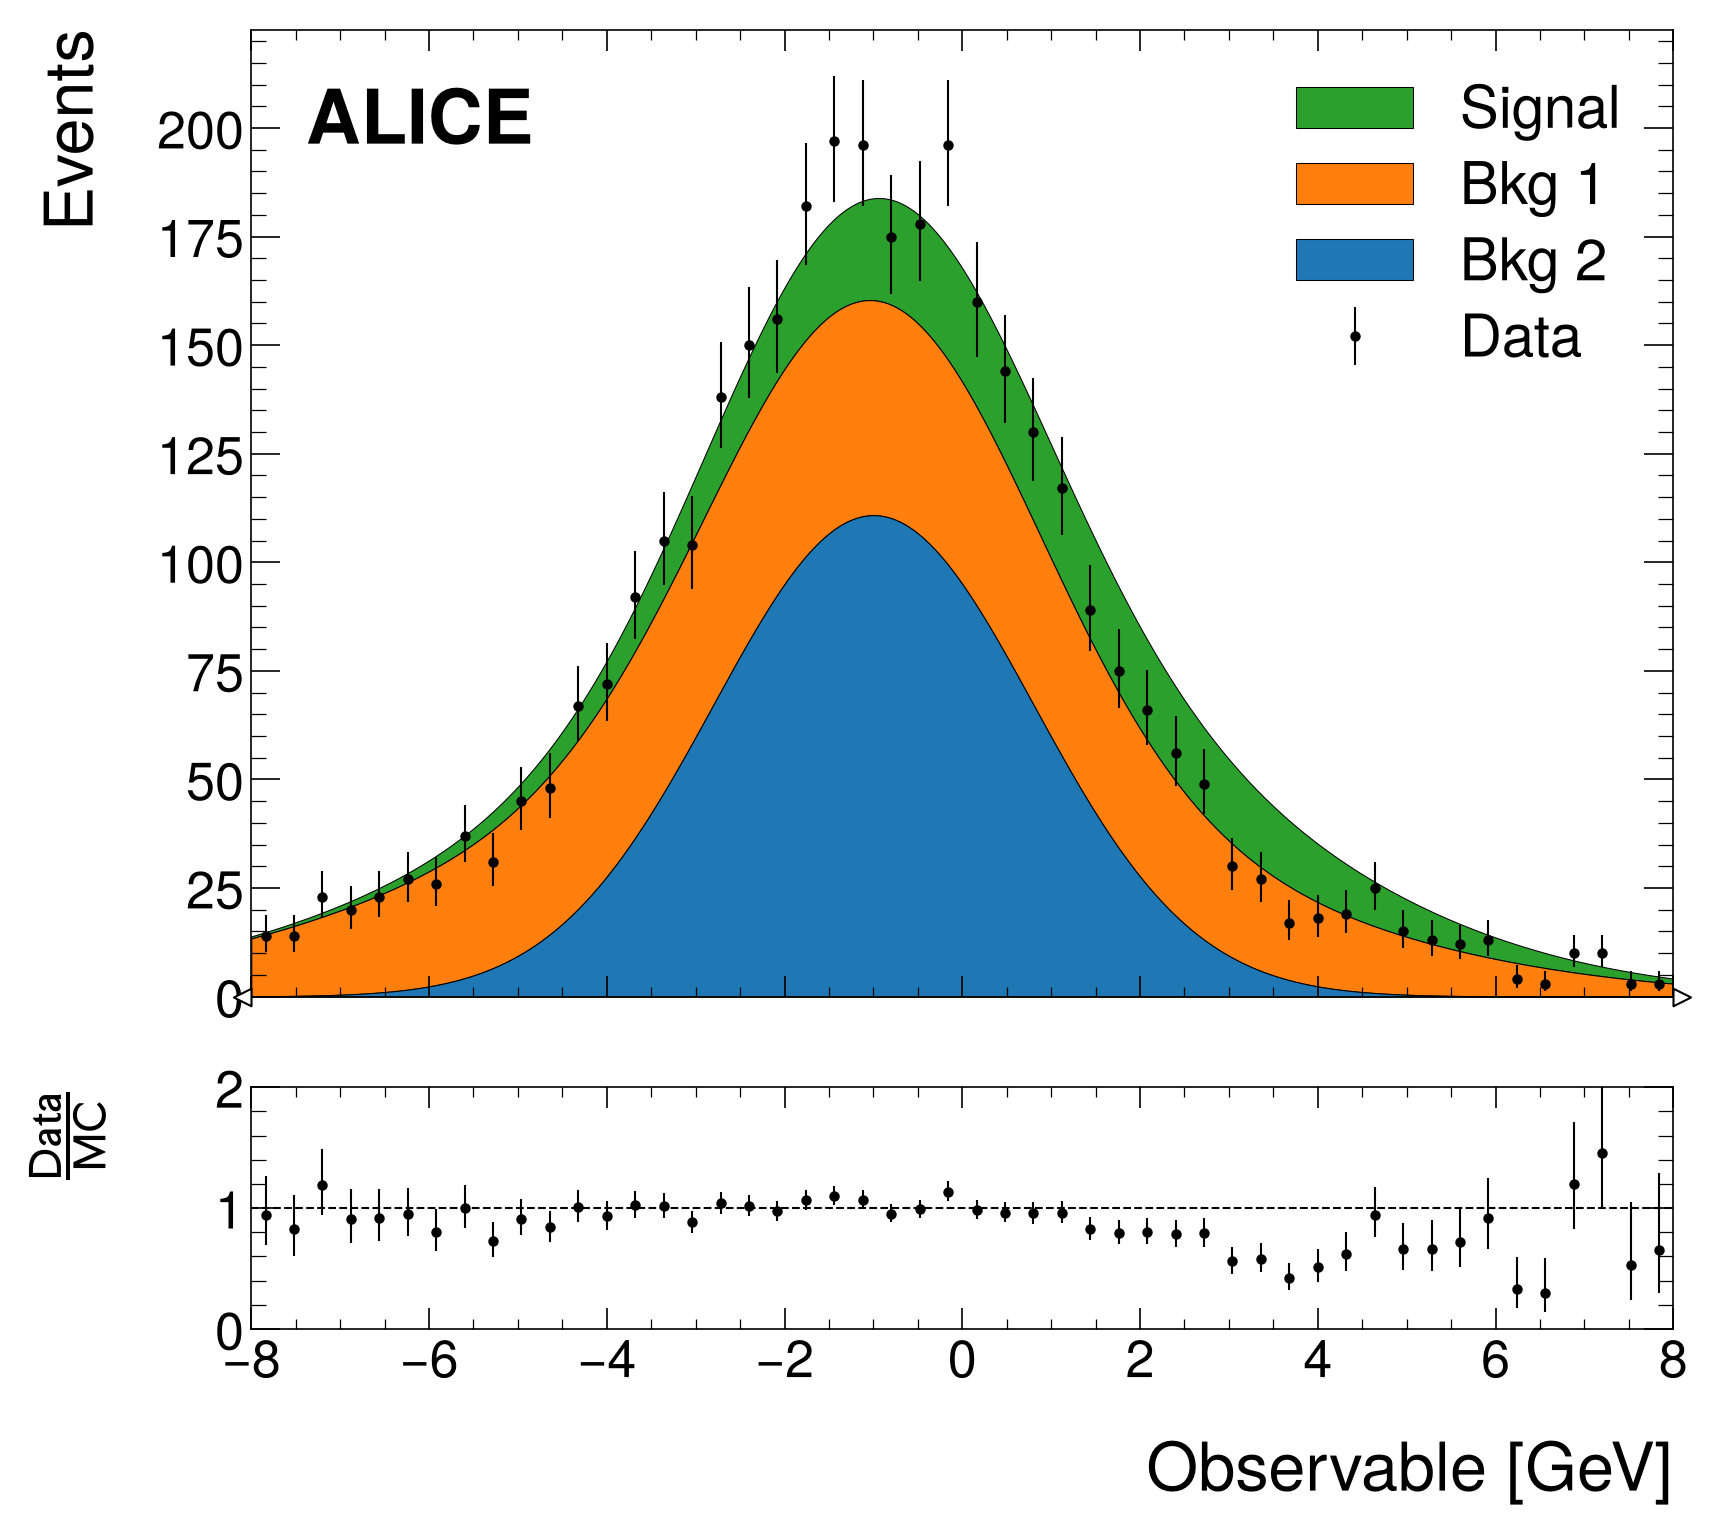
# Define component functions
def f_signal(x):
 return 200 * norm.pdf(x, loc=0.5, scale=3)
def f_bkg1(x):
 return 500 * norm.pdf(x, loc=-1.5, scale=4)
def f_bkg2(x):
 return 500 * norm.pdf(x, loc=-1., scale=1.8)

# Generate data histogram
x_data = np.concatenate([np.random.normal(-1.5, 4, 1500), np.random.normal(-1., 1.8, 2000)])
data_hist = hist.new.Regular(50, -8, 8).Weight().fill(x_data)

# Create comparison plot
fig, ax_main, ax_comp = mh.comp.data_model(
 data_hist=data_hist,
 stacked_components=[f_bkg2, f_bkg1,],
 stacked_labels=['Bkg 2', 'Bkg 1'],
 unstacked_components=[f_signal],
 unstacked_labels=['Signal'],
 xlabel='Observable [GeV]',
 ylabel='Events'
)
mh.alice.label(data=True, lumi=100, ax=ax_main)
mh.mpl_magic(soft_fail=True)
# Generate signal, backgrounds, and data
x1 = np.random.normal(0, 1, 1400)
x2 = np.random.normal(1, 0.5, 1000)
x3 = np.random.exponential(0.5, 900) - 1.5
data_x = np.random.choice([*x1, *x2, *x3], size=3500, replace=True)
h_bkg1 = hist.new.Reg(25, -3, 5).Weight().fill(x1)
h_bkg2 = hist.new.Reg(25, -3, 5).Weight().fill(x2)
h_signal = hist.new.Reg(25, -3, 5).Weight().fill(x3)
h_data = hist.new.Reg(25, -3, 5).Weight().fill(data_x)

# Create comparison plot
fig, ax_main, ax_comp = mh.comp.data_model(
 data_hist=h_data,
 stacked_components=[h_bkg2, h_bkg1, h_signal],
 stacked_labels=['Bkg2', 'Bkg1', 'Signal'],
 xlabel='Observable [GeV]',
 ylabel='Events'
)
mh.dune.label(data=True, lumi=100, ax=ax_main)
# Generate signal, backgrounds, and data
x1 = np.random.normal(0, 1, 1400)
x2 = np.random.normal(1, 0.5, 1000)
x3 = np.random.exponential(0.5, 900) - 1.5
data_x = np.random.choice([*x1, *x2, *x3], size=3500, replace=True)
h_bkg1 = hist.new.Reg(25, -3, 5).Weight().fill(x1)
h_bkg2 = hist.new.Reg(25, -3, 5).Weight().fill(x2)
h_signal = hist.new.Reg(25, -3, 5).Weight().fill(x3)
h_data = hist.new.Reg(25, -3, 5).Weight().fill(data_x)

# The function will automatically sum the stacked and unstacked components
fig, ax_main, ax_comp = mh.comp.data_model(
 data_hist=h_data,
 stacked_components=[h_bkg2, h_bkg1],
 stacked_labels=['Bkg2', 'Bkg1'],
 stacked_colors=['grey', 'lightblue'],
 unstacked_components=[h_signal],
 unstacked_labels=['Signal'],
 unstacked_colors=['red'],
 xlabel='Observable [GeV]',
 ylabel='Events'
)
mh.dune.label(data=True, lumi=100, ax=ax_main)
# Define component functions
def f_signal(x):
 return 200 * scipy.stats.norm.pdf(x, loc=0.5, scale=3)
def f_bkg1(x):
 return 500 * scipy.stats.norm.pdf(x, loc=-1.5, scale=4)
def f_bkg2(x):
 return 500 * scipy.stats.norm.pdf(x, loc=-1., scale=1.8)

# Generate data histogram
x_data = np.concatenate([np.random.normal(-1.5, 4, 1500), np.random.normal(-1., 1.8, 2000)])
data_hist = hist.new.Regular(50, -8, 8).Weight().fill(x_data)

# Create comparison plot
fig, ax_main, ax_comp = mh.comp.data_model(
 data_hist=data_hist,
 stacked_components=[f_bkg2, f_bkg1, f_signal],
 stacked_labels=['Bkg 2', 'Bkg 1', 'Signal'],
 xlabel='Observable [GeV]',
 ylabel='Events'
)
mh.dune.label(data=True, lumi=100, ax=ax_main)
# Define component functions
def f_signal(x):
 return 200 * norm.pdf(x, loc=0.5, scale=3)
def f_bkg1(x):
 return 500 * norm.pdf(x, loc=-1.5, scale=4)
def f_bkg2(x):
 return 500 * norm.pdf(x, loc=-1., scale=1.8)

# Generate data histogram
x_data = np.concatenate([np.random.normal(-1.5, 4, 1500), np.random.normal(-1., 1.8, 2000)])
data_hist = hist.new.Regular(50, -8, 8).Weight().fill(x_data)

# Create comparison plot
fig, ax_main, ax_comp = mh.comp.data_model(
 data_hist=data_hist,
 stacked_components=[f_bkg2, f_bkg1,],
 stacked_labels=['Bkg 2', 'Bkg 1'],
 unstacked_components=[f_signal],
 unstacked_labels=['Signal'],
 xlabel='Observable [GeV]',
 ylabel='Events'
)
mh.dune.label(data=True, lumi=100, ax=ax_main)
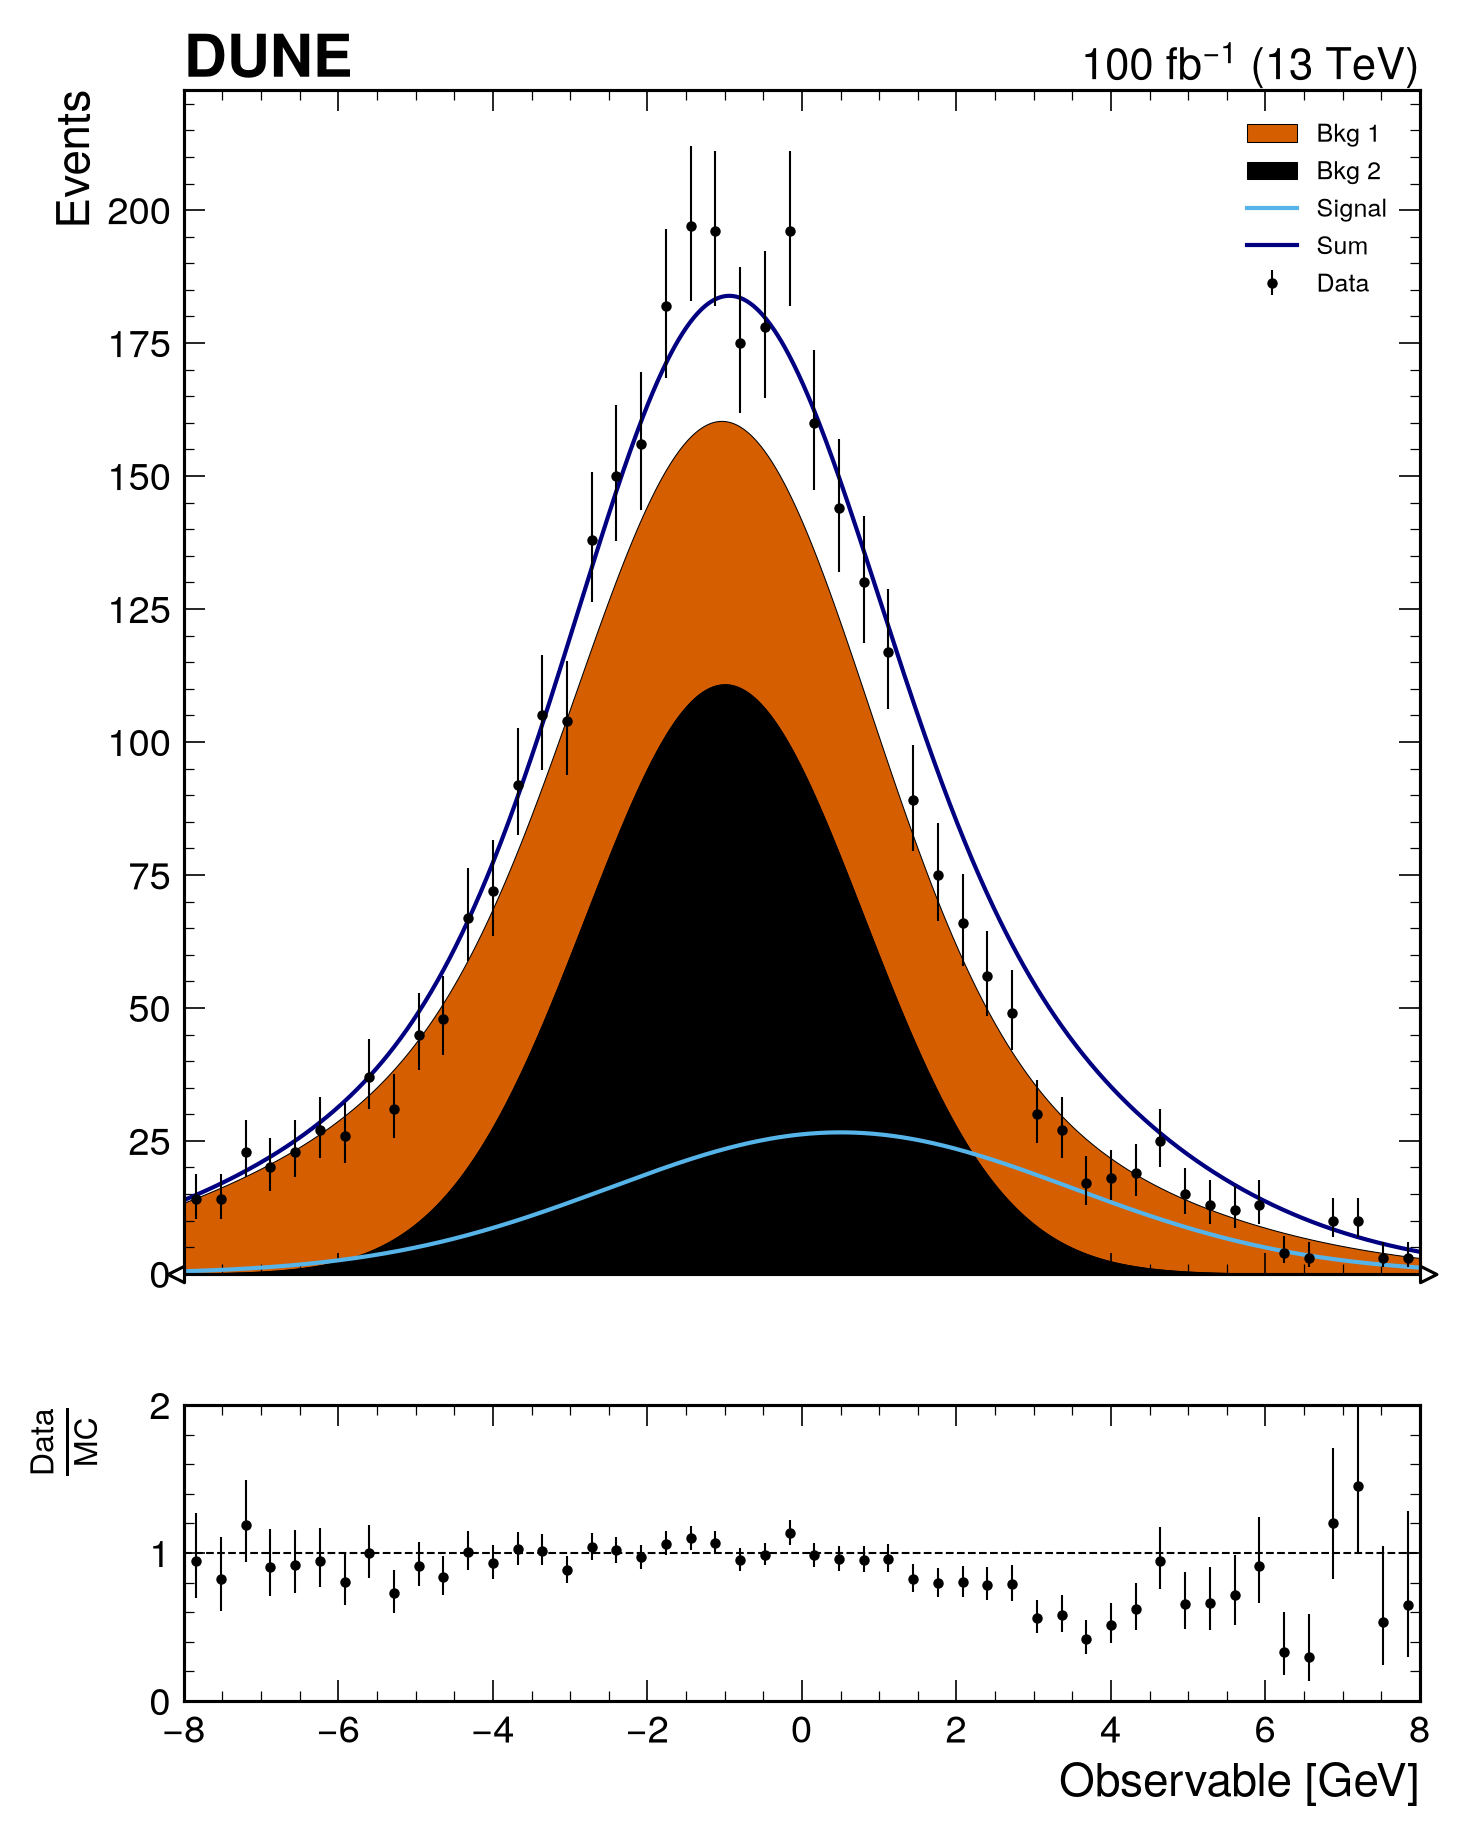
Tip
To only plot the model, without data or comparison panel, use mh.model(). It takes the same arguments as mh.comp.data_model(), except for the data_hist and comparison parameters.
Showcasing more options¤
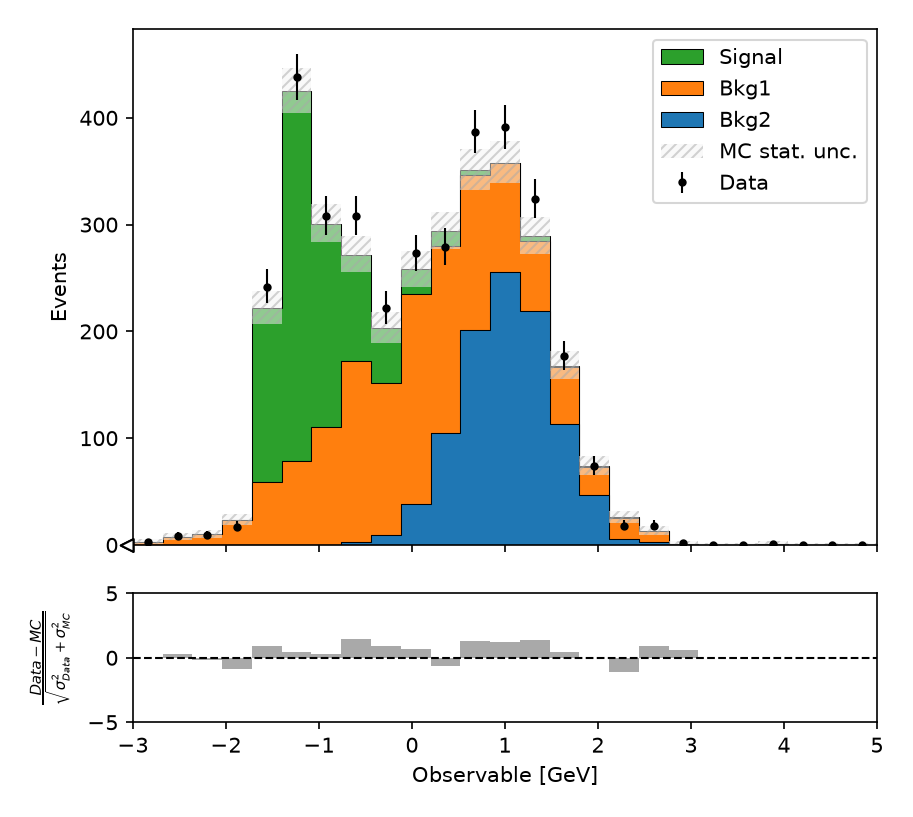
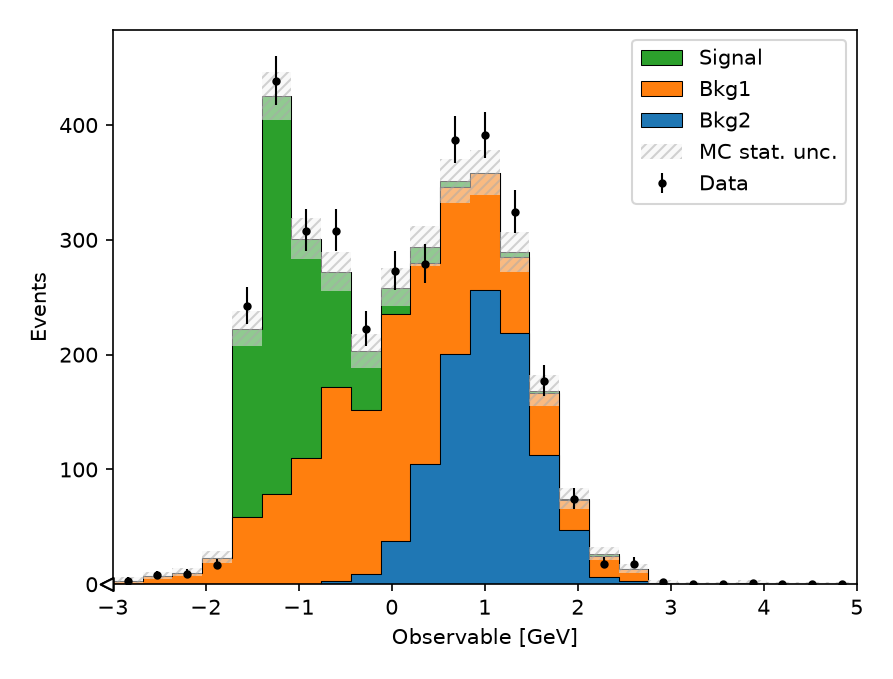
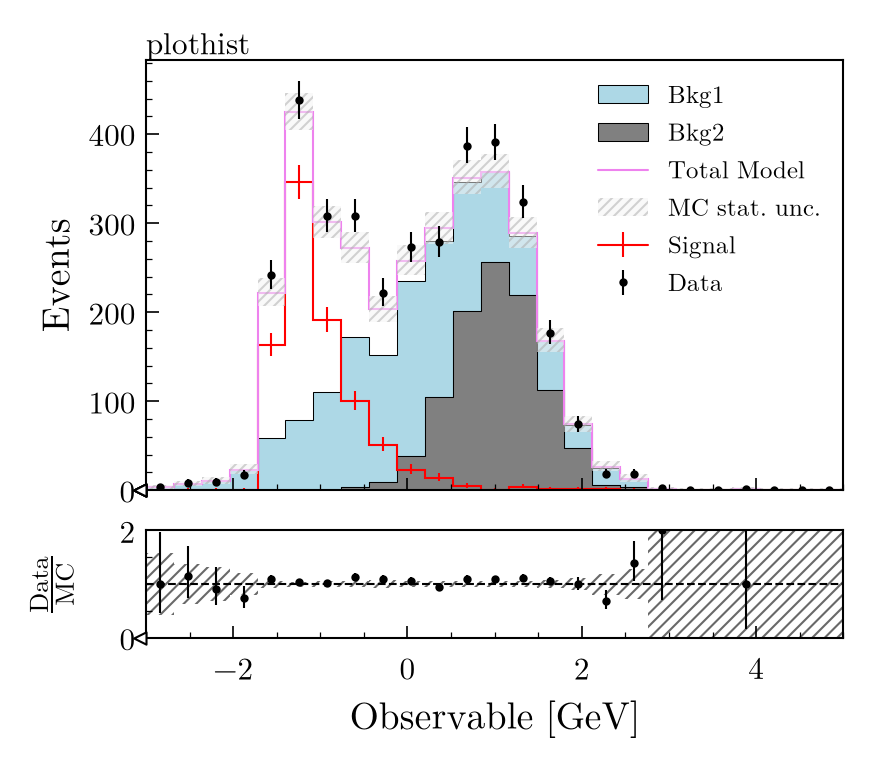
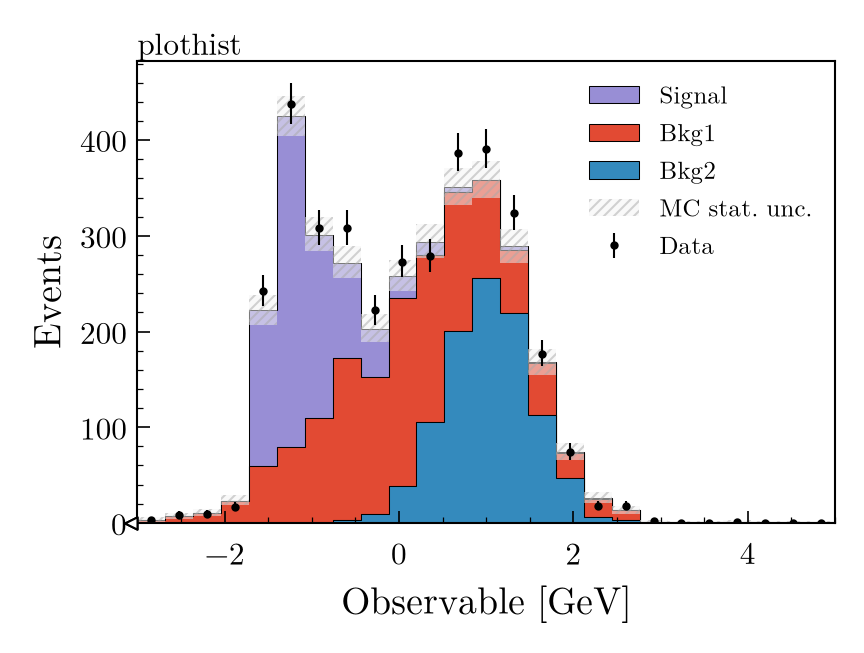
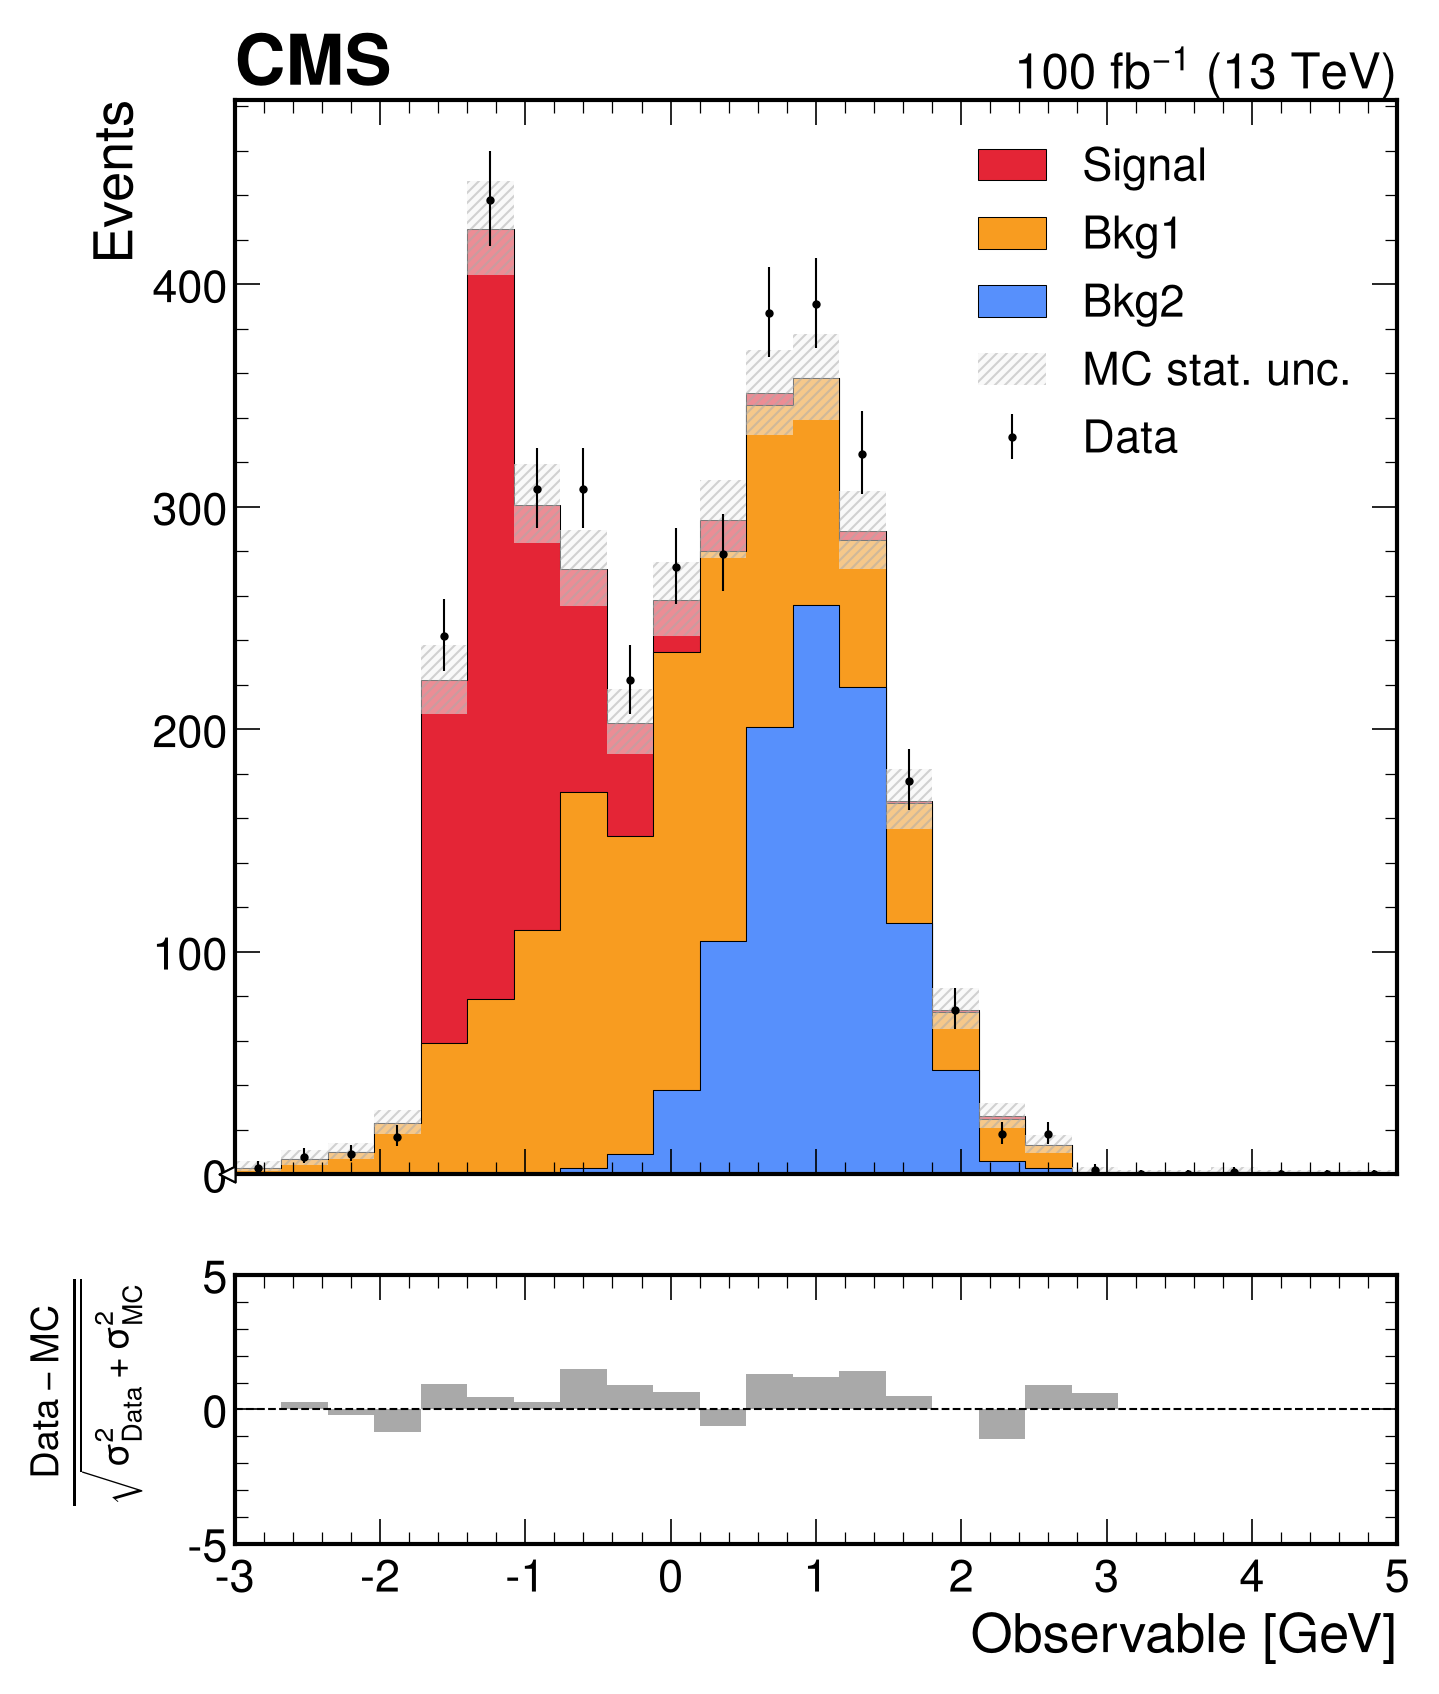
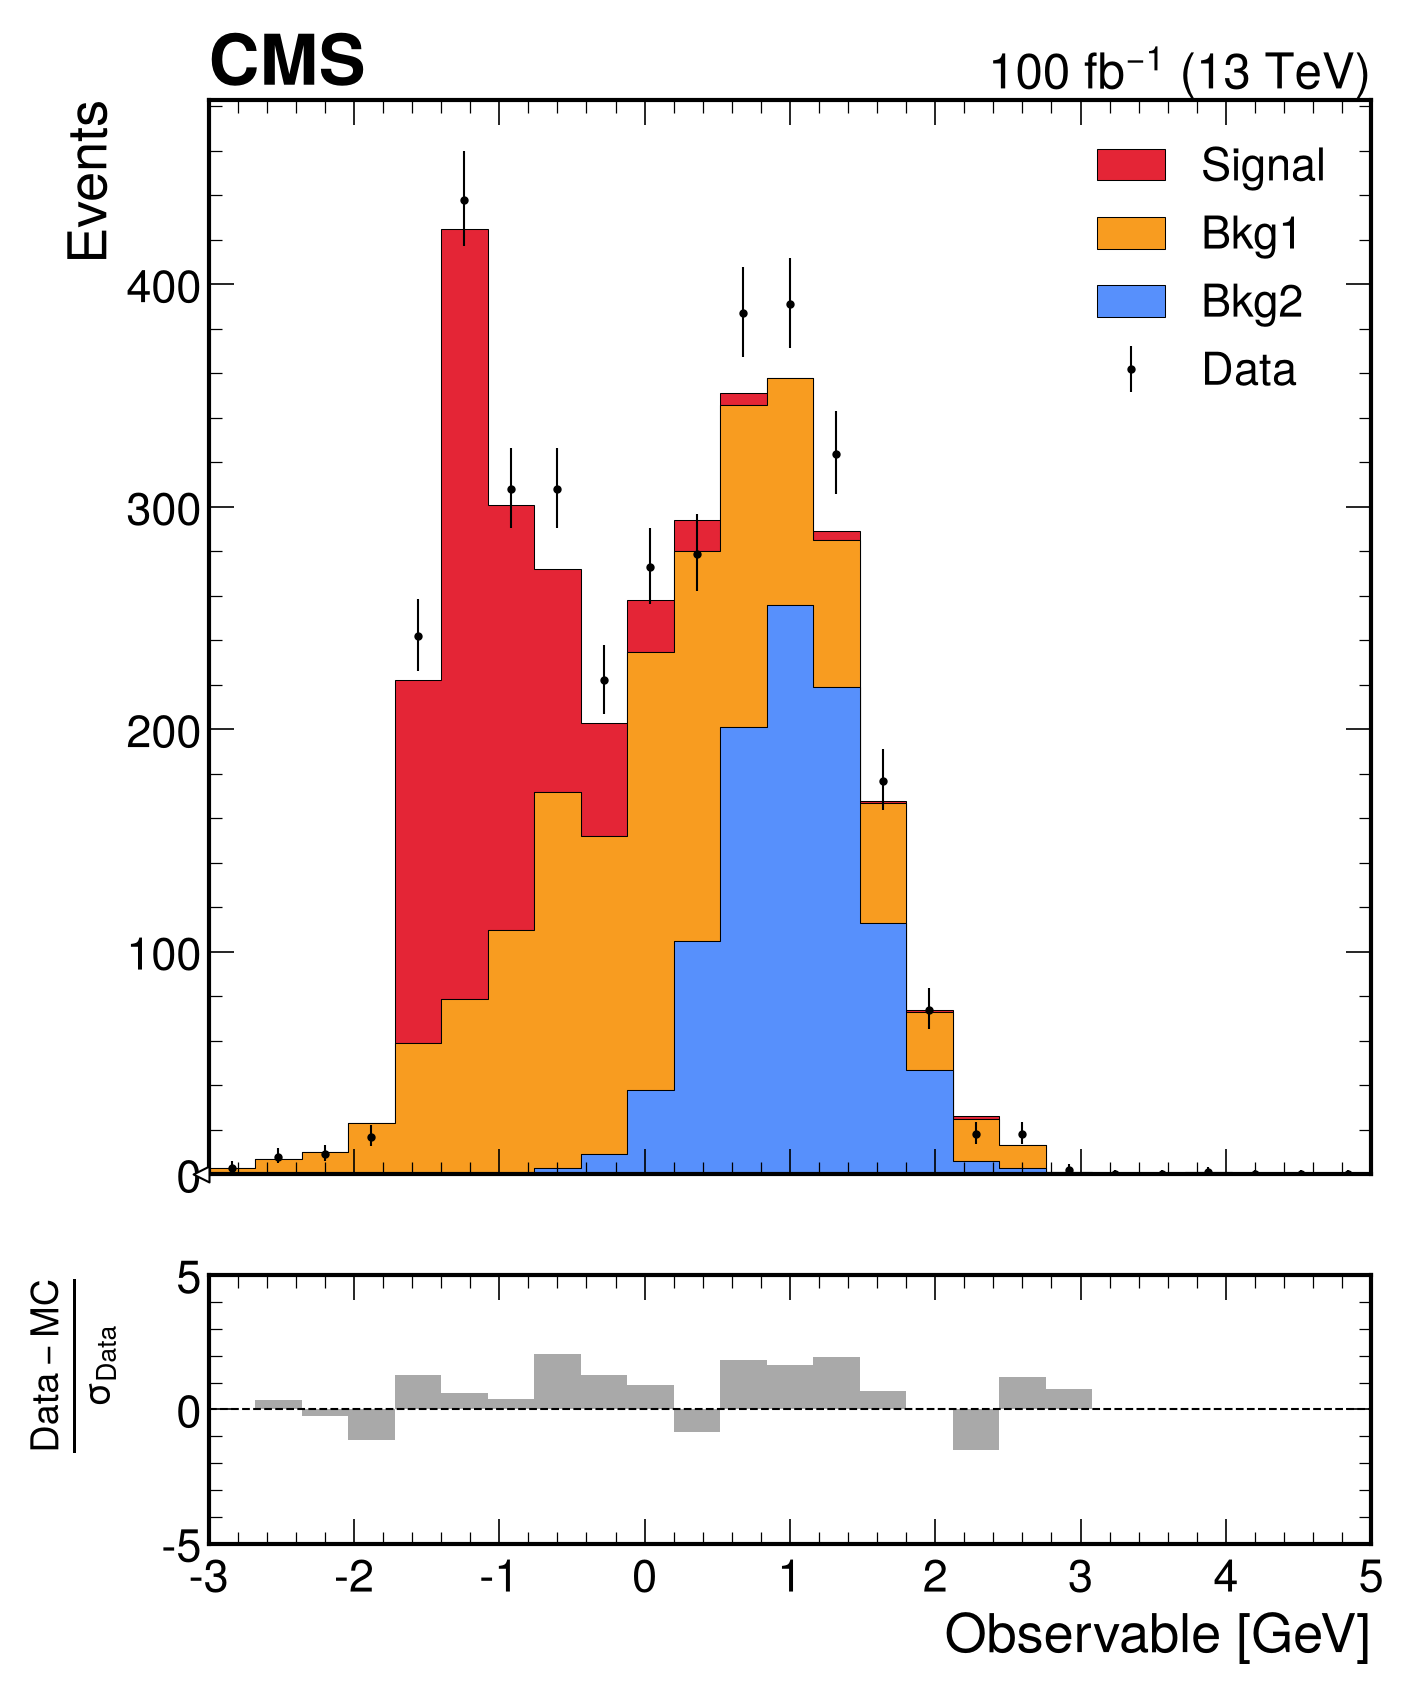
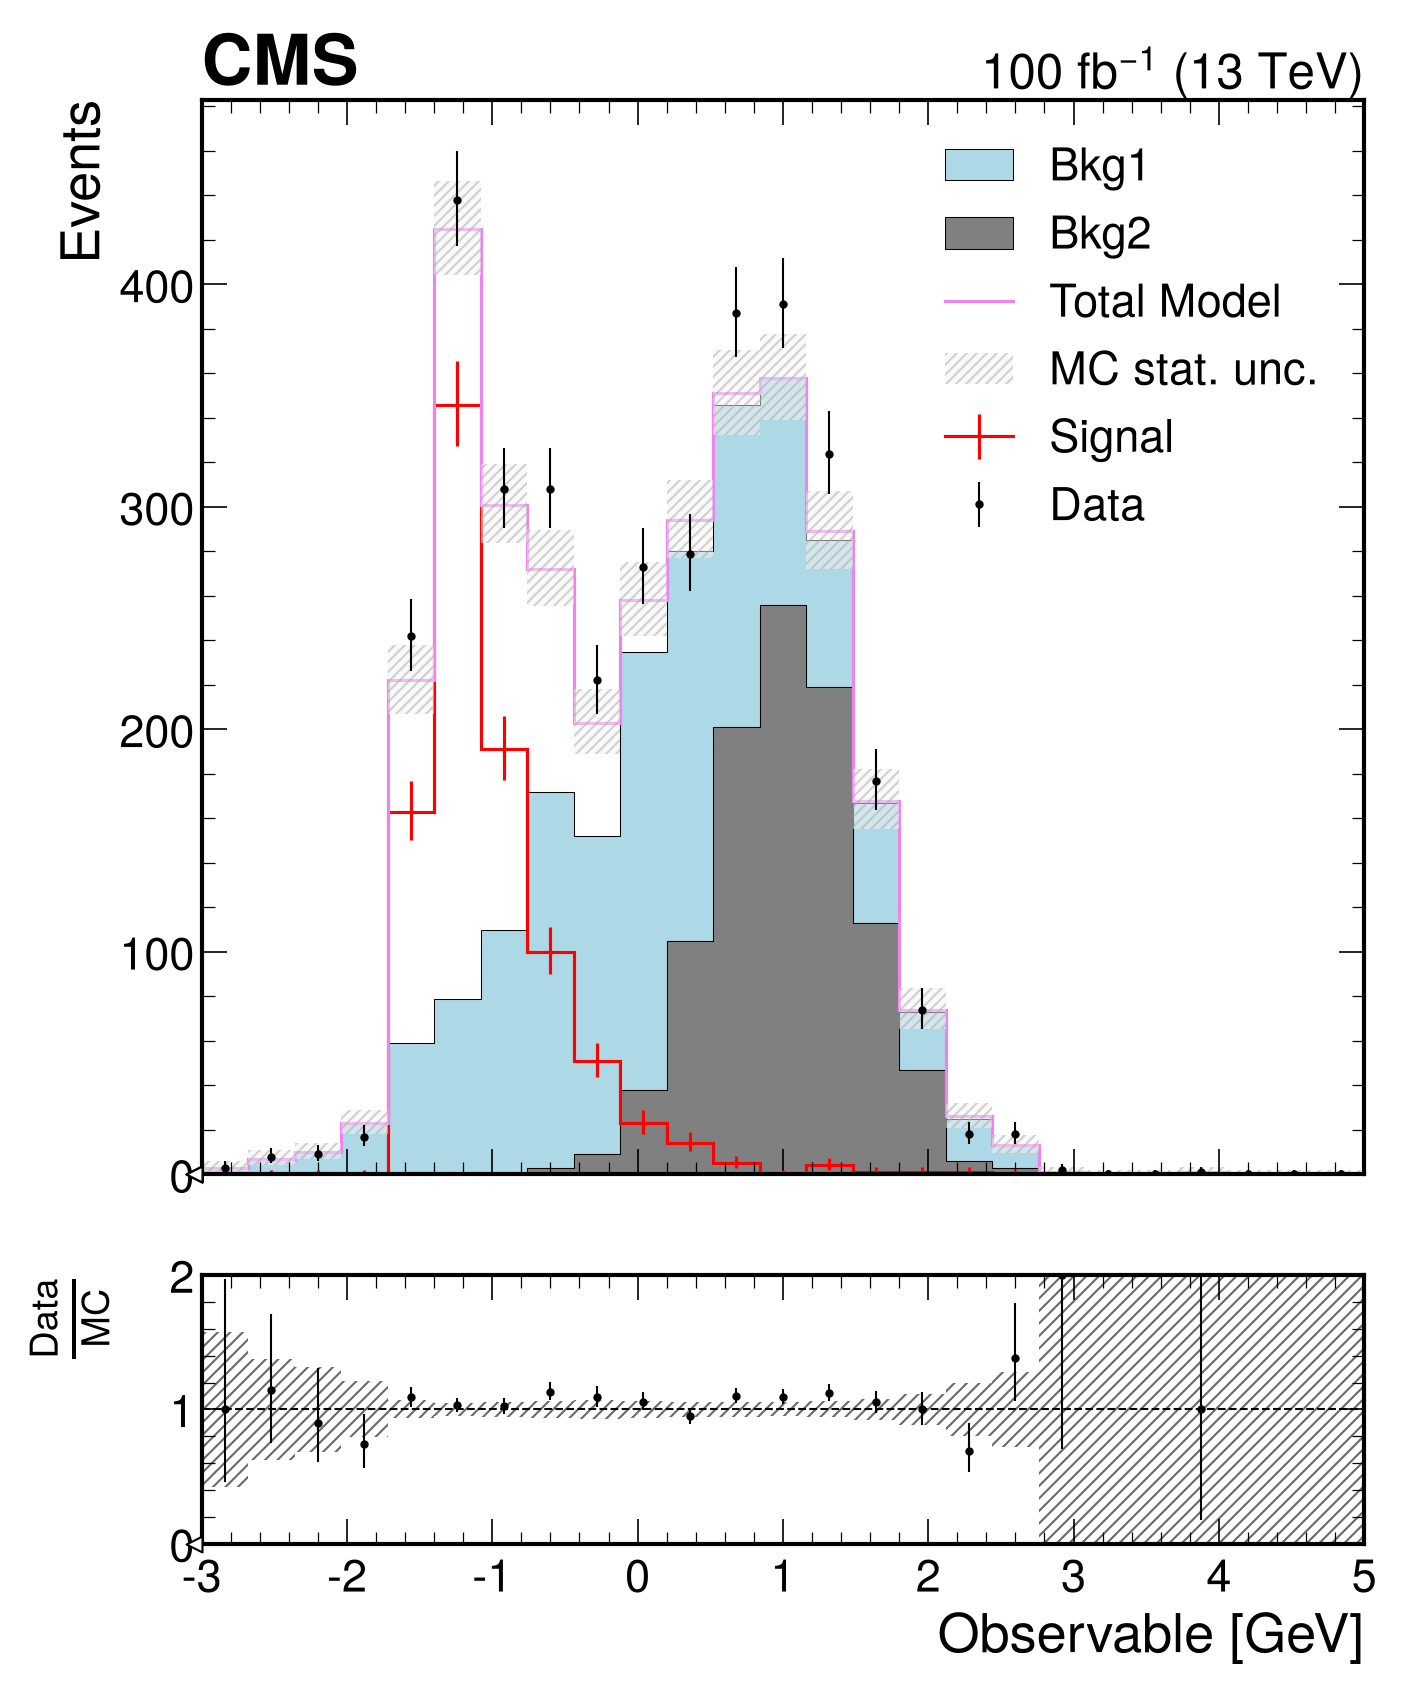
mh.comp.data_model() is very flexible and can be customized further. For more examples and details, see the API Reference and the Gallery. Here is a selection of additional examples showcasing some of the available options.
# Generate signal, backgrounds, and data
x1 = np.random.normal(0, 1, 1400)
x2 = np.random.normal(1, 0.5, 1000)
x3 = np.random.exponential(0.5, 900) - 1.5
data_x = np.random.choice([*x1, *x2, *x3], size=3500, replace=True)
h_bkg1 = hist.new.Reg(25, -3, 5).Weight().fill(x1)
h_bkg2 = hist.new.Reg(25, -3, 5).Weight().fill(x2)
h_signal = hist.new.Reg(25, -3, 5).Weight().fill(x3)
h_data = hist.new.Reg(25, -3, 5).Weight().fill(data_x)

# Create comparison plot
fig, ax_main, ax_comp = mh.comp.data_model(
 data_hist=h_data,
 stacked_components=[h_bkg2, h_bkg1, h_signal],
 stacked_labels=['Bkg2', 'Bkg1', 'Signal'],
 xlabel='Observable [GeV]',
 ylabel='Events',
 comparison='pull' # Accept any comparison from mh.comp.comparison()
)
# Generate signal, backgrounds, and data
x1 = np.random.normal(0, 1, 1400)
x2 = np.random.normal(1, 0.5, 1000)
x3 = np.random.exponential(0.5, 900) - 1.5
data_x = np.random.choice([*x1, *x2, *x3], size=3500, replace=True)
h_bkg1 = hist.new.Reg(25, -3, 5).Weight().fill(x1)
h_bkg2 = hist.new.Reg(25, -3, 5).Weight().fill(x2)
h_signal = hist.new.Reg(25, -3, 5).Weight().fill(x3)
h_data = hist.new.Reg(25, -3, 5).Weight().fill(data_x)

# Create comparison plot
fig, ax_main, ax_comp = mh.comp.data_model(
 data_hist=h_data,
 stacked_components=[h_bkg2, h_bkg1, h_signal],
 stacked_labels=['Bkg2', 'Bkg1', 'Signal'],
 xlabel='Observable [GeV]',
 ylabel='Events',
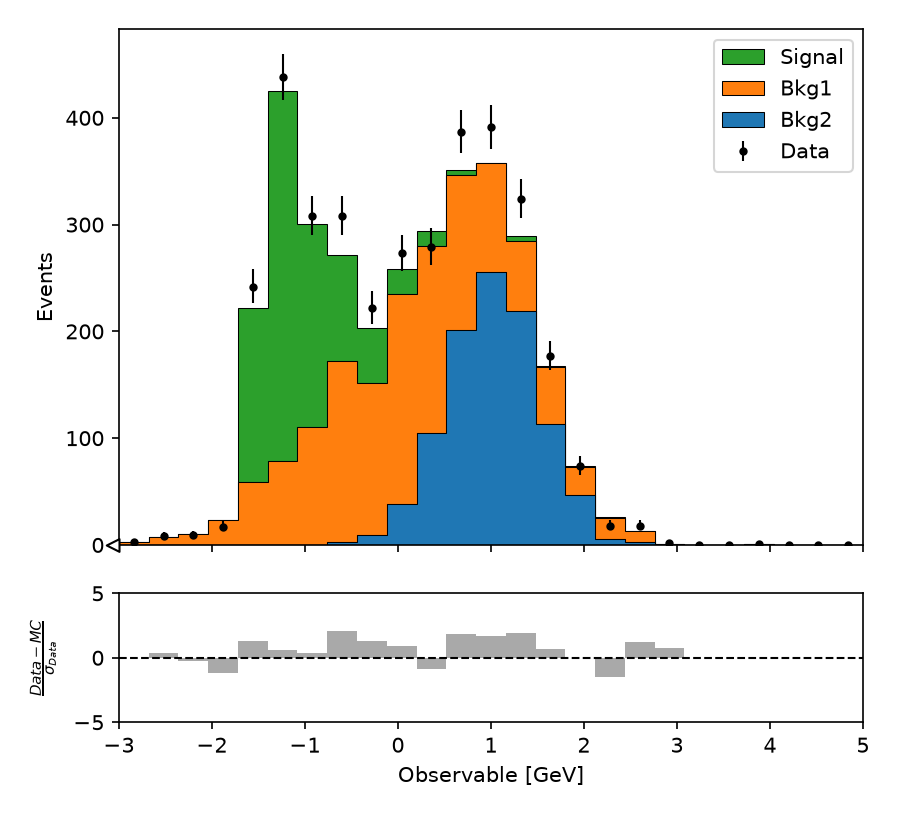
 model_uncertainty=False, # Set the model uncertainty to zero
 comparison='pull', # The pull formula is updated automatically
)
# Generate signal, backgrounds, and data
x1 = np.random.normal(0, 1, 1400)
x2 = np.random.normal(1, 0.5, 1000)
x3 = np.random.exponential(0.5, 900) - 1.5
data_x = np.random.choice([*x1, *x2, *x3], size=3500, replace=True)
h_bkg1 = hist.new.Reg(25, -3, 5).Weight().fill(x1)
h_bkg2 = hist.new.Reg(25, -3, 5).Weight().fill(x2)
h_signal = hist.new.Reg(25, -3, 5).Weight().fill(x3)
h_data = hist.new.Reg(25, -3, 5).Weight().fill(data_x)

# Create comparison plot
fig, ax_main, ax_comp = mh.comp.data_model(
 data_hist=h_data,
 stacked_components=[h_bkg2, h_bkg1],
 stacked_labels=['Bkg2', 'Bkg1'],
 stacked_colors=['grey', 'lightblue'],
 unstacked_components=[h_signal],
 unstacked_labels=['Signal'],
 unstacked_colors=['red'],
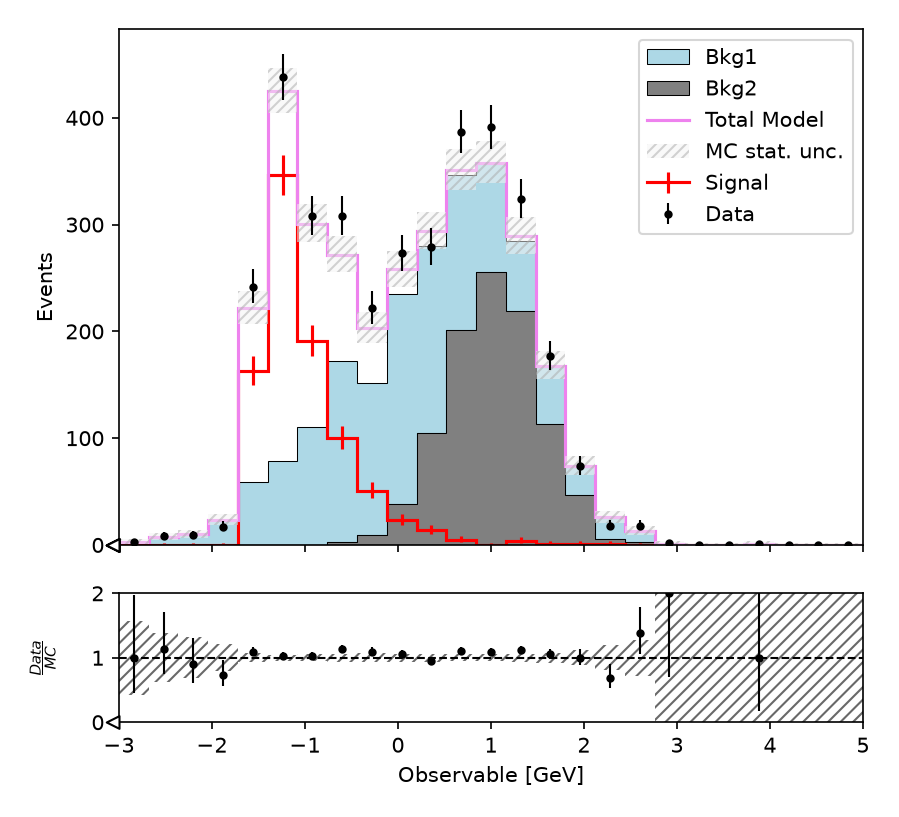
 model_sum_kwargs={"show": True, "label": "Total Model", "color": "violet"}, # Just like stacked_components_kwargs and unstacked_components_kwargs, you can pass kwargs for the model sum line
 xlabel='Observable [GeV]',
 ylabel='Events'
)
# Generate signal, backgrounds, and data
x1 = np.random.normal(0, 1, 1400)
x2 = np.random.normal(1, 0.5, 1000)
x3 = np.random.exponential(0.5, 900) - 1.5
data_x = np.random.choice([*x1, *x2, *x3], size=3500, replace=True)
h_bkg1 = hist.new.Reg(25, -3, 5).Weight().fill(x1)
h_bkg2 = hist.new.Reg(25, -3, 5).Weight().fill(x2)
h_signal = hist.new.Reg(25, -3, 5).Weight().fill(x3)
h_data = hist.new.Reg(25, -3, 5).Weight().fill(data_x)

# Create comparison plot
fig, ax_main, ax_comparison = mh.comp.data_model(
 data_hist=h_data,
 stacked_components=[h_bkg2, h_bkg1, h_signal],
 stacked_labels=['Bkg2', 'Bkg1', 'Signal'],
 xlabel='Observable [GeV]',
 ylabel='Events',
 plot_only='ax_main' # Only plot the comparison axis (works with 'ax_comparison' as well).
)
# Generate signal, backgrounds, and data
x1 = np.random.normal(0, 1, 1400)
x2 = np.random.normal(1, 0.5, 1000)
x3 = np.random.exponential(0.5, 900) - 1.5
data_x = np.random.choice([*x1, *x2, *x3], size=3500, replace=True)
h_bkg1 = hist.new.Reg(25, -3, 5).Weight().fill(x1)
h_bkg2 = hist.new.Reg(25, -3, 5).Weight().fill(x2)
h_signal = hist.new.Reg(25, -3, 5).Weight().fill(x3)
h_data = hist.new.Reg(25, -3, 5).Weight().fill(data_x)

# Create comparison plot
fig, ax_main, ax_comp = mh.comp.data_model(
 data_hist=h_data,
 stacked_components=[h_bkg2, h_bkg1, h_signal],
 stacked_labels=['Bkg2', 'Bkg1', 'Signal'],
 xlabel='Observable [GeV]',
 ylabel='Events',
 comparison='pull' # Accept any comparison from mh.comp.comparison()
)
txt_obj = mh.add_text('plothist', loc='over left', ax=ax_main)
# Generate signal, backgrounds, and data
x1 = np.random.normal(0, 1, 1400)
x2 = np.random.normal(1, 0.5, 1000)
x3 = np.random.exponential(0.5, 900) - 1.5
data_x = np.random.choice([*x1, *x2, *x3], size=3500, replace=True)
h_bkg1 = hist.new.Reg(25, -3, 5).Weight().fill(x1)
h_bkg2 = hist.new.Reg(25, -3, 5).Weight().fill(x2)
h_signal = hist.new.Reg(25, -3, 5).Weight().fill(x3)
h_data = hist.new.Reg(25, -3, 5).Weight().fill(data_x)

# Create comparison plot
fig, ax_main, ax_comp = mh.comp.data_model(
 data_hist=h_data,
 stacked_components=[h_bkg2, h_bkg1, h_signal],
 stacked_labels=['Bkg2', 'Bkg1', 'Signal'],
 xlabel='Observable [GeV]',
 ylabel='Events',
 model_uncertainty=False, # Set the model uncertainty to zero
 comparison='pull', # The pull formula is updated automatically
)
txt_obj = mh.add_text('plothist', loc='over left', ax=ax_main)
# Generate signal, backgrounds, and data
x1 = np.random.normal(0, 1, 1400)
x2 = np.random.normal(1, 0.5, 1000)
x3 = np.random.exponential(0.5, 900) - 1.5
data_x = np.random.choice([*x1, *x2, *x3], size=3500, replace=True)
h_bkg1 = hist.new.Reg(25, -3, 5).Weight().fill(x1)
h_bkg2 = hist.new.Reg(25, -3, 5).Weight().fill(x2)
h_signal = hist.new.Reg(25, -3, 5).Weight().fill(x3)
h_data = hist.new.Reg(25, -3, 5).Weight().fill(data_x)

# Create comparison plot
fig, ax_main, ax_comp = mh.comp.data_model(
 data_hist=h_data,
 stacked_components=[h_bkg2, h_bkg1],
 stacked_labels=['Bkg2', 'Bkg1'],
 stacked_colors=['grey', 'lightblue'],
 unstacked_components=[h_signal],
 unstacked_labels=['Signal'],
 unstacked_colors=['red'],
 model_sum_kwargs={"show": True, "label": "Total Model", "color": "violet"}, # Just like stacked_components_kwargs and unstacked_components_kwargs, you can pass kwargs for the model sum line
 xlabel='Observable [GeV]',
 ylabel='Events'
)
txt_obj = mh.add_text('plothist', loc='over left', ax=ax_main)
# Generate signal, backgrounds, and data
x1 = np.random.normal(0, 1, 1400)
x2 = np.random.normal(1, 0.5, 1000)
x3 = np.random.exponential(0.5, 900) - 1.5
data_x = np.random.choice([*x1, *x2, *x3], size=3500, replace=True)
h_bkg1 = hist.new.Reg(25, -3, 5).Weight().fill(x1)
h_bkg2 = hist.new.Reg(25, -3, 5).Weight().fill(x2)
h_signal = hist.new.Reg(25, -3, 5).Weight().fill(x3)
h_data = hist.new.Reg(25, -3, 5).Weight().fill(data_x)

# Create comparison plot
fig, ax_main, ax_comparison = mh.comp.data_model(
 data_hist=h_data,
 stacked_components=[h_bkg2, h_bkg1, h_signal],
 stacked_labels=['Bkg2', 'Bkg1', 'Signal'],
 xlabel='Observable [GeV]',
 ylabel='Events',
 plot_only='ax_main' # Only plot the comparison axis (works with 'ax_comparison' as well).
)
txt_obj = mh.add_text('plothist', loc='over left', ax=ax_main)
# Generate signal, backgrounds, and data
x1 = np.random.normal(0, 1, 1400)
x2 = np.random.normal(1, 0.5, 1000)
x3 = np.random.exponential(0.5, 900) - 1.5
data_x = np.random.choice([*x1, *x2, *x3], size=3500, replace=True)
h_bkg1 = hist.new.Reg(25, -3, 5).Weight().fill(x1)
h_bkg2 = hist.new.Reg(25, -3, 5).Weight().fill(x2)
h_signal = hist.new.Reg(25, -3, 5).Weight().fill(x3)
h_data = hist.new.Reg(25, -3, 5).Weight().fill(data_x)

# Create comparison plot
fig, ax_main, ax_comp = mh.comp.data_model(
 data_hist=h_data,
 stacked_components=[h_bkg2, h_bkg1, h_signal],
 stacked_labels=['Bkg2', 'Bkg1', 'Signal'],
 xlabel='Observable [GeV]',
 ylabel='Events',
 comparison='pull' # Accept any comparison from mh.comp.comparison()
)
mh.cms.label(data=True, lumi=100, ax=ax_main)
# Generate signal, backgrounds, and data
x1 = np.random.normal(0, 1, 1400)
x2 = np.random.normal(1, 0.5, 1000)
x3 = np.random.exponential(0.5, 900) - 1.5
data_x = np.random.choice([*x1, *x2, *x3], size=3500, replace=True)
h_bkg1 = hist.new.Reg(25, -3, 5).Weight().fill(x1)
h_bkg2 = hist.new.Reg(25, -3, 5).Weight().fill(x2)
h_signal = hist.new.Reg(25, -3, 5).Weight().fill(x3)
h_data = hist.new.Reg(25, -3, 5).Weight().fill(data_x)

# Create comparison plot
fig, ax_main, ax_comp = mh.comp.data_model(
 data_hist=h_data,
 stacked_components=[h_bkg2, h_bkg1, h_signal],
 stacked_labels=['Bkg2', 'Bkg1', 'Signal'],
 xlabel='Observable [GeV]',
 ylabel='Events',
 model_uncertainty=False, # Set the model uncertainty to zero
 comparison='pull', # The pull formula is updated automatically
)
mh.cms.label(data=True, lumi=100, ax=ax_main)
# Generate signal, backgrounds, and data
x1 = np.random.normal(0, 1, 1400)
x2 = np.random.normal(1, 0.5, 1000)
x3 = np.random.exponential(0.5, 900) - 1.5
data_x = np.random.choice([*x1, *x2, *x3], size=3500, replace=True)
h_bkg1 = hist.new.Reg(25, -3, 5).Weight().fill(x1)
h_bkg2 = hist.new.Reg(25, -3, 5).Weight().fill(x2)
h_signal = hist.new.Reg(25, -3, 5).Weight().fill(x3)
h_data = hist.new.Reg(25, -3, 5).Weight().fill(data_x)

# Create comparison plot
fig, ax_main, ax_comp = mh.comp.data_model(
 data_hist=h_data,
 stacked_components=[h_bkg2, h_bkg1],
 stacked_labels=['Bkg2', 'Bkg1'],
 stacked_colors=['grey', 'lightblue'],
 unstacked_components=[h_signal],
 unstacked_labels=['Signal'],
 unstacked_colors=['red'],
 model_sum_kwargs={"show": True, "label": "Total Model", "color": "violet"}, # Just like stacked_components_kwargs and unstacked_components_kwargs, you can pass kwargs for the model sum line
 xlabel='Observable [GeV]',
 ylabel='Events'
)
mh.cms.label(data=True, lumi=100, ax=ax_main)
# Generate signal, backgrounds, and data
x1 = np.random.normal(0, 1, 1400)
x2 = np.random.normal(1, 0.5, 1000)
x3 = np.random.exponential(0.5, 900) - 1.5
data_x = np.random.choice([*x1, *x2, *x3], size=3500, replace=True)
h_bkg1 = hist.new.Reg(25, -3, 5).Weight().fill(x1)
h_bkg2 = hist.new.Reg(25, -3, 5).Weight().fill(x2)
h_signal = hist.new.Reg(25, -3, 5).Weight().fill(x3)
h_data = hist.new.Reg(25, -3, 5).Weight().fill(data_x)

# Create comparison plot
fig, ax_main, ax_comparison = mh.comp.data_model(
 data_hist=h_data,
 stacked_components=[h_bkg2, h_bkg1, h_signal],
 stacked_labels=['Bkg2', 'Bkg1', 'Signal'],
 xlabel='Observable [GeV]',
 ylabel='Events',
 plot_only='ax_main' # Only plot the comparison axis (works with 'ax_comparison' as well).
)
mh.cms.label(data=True, lumi=100, ax=ax_main)
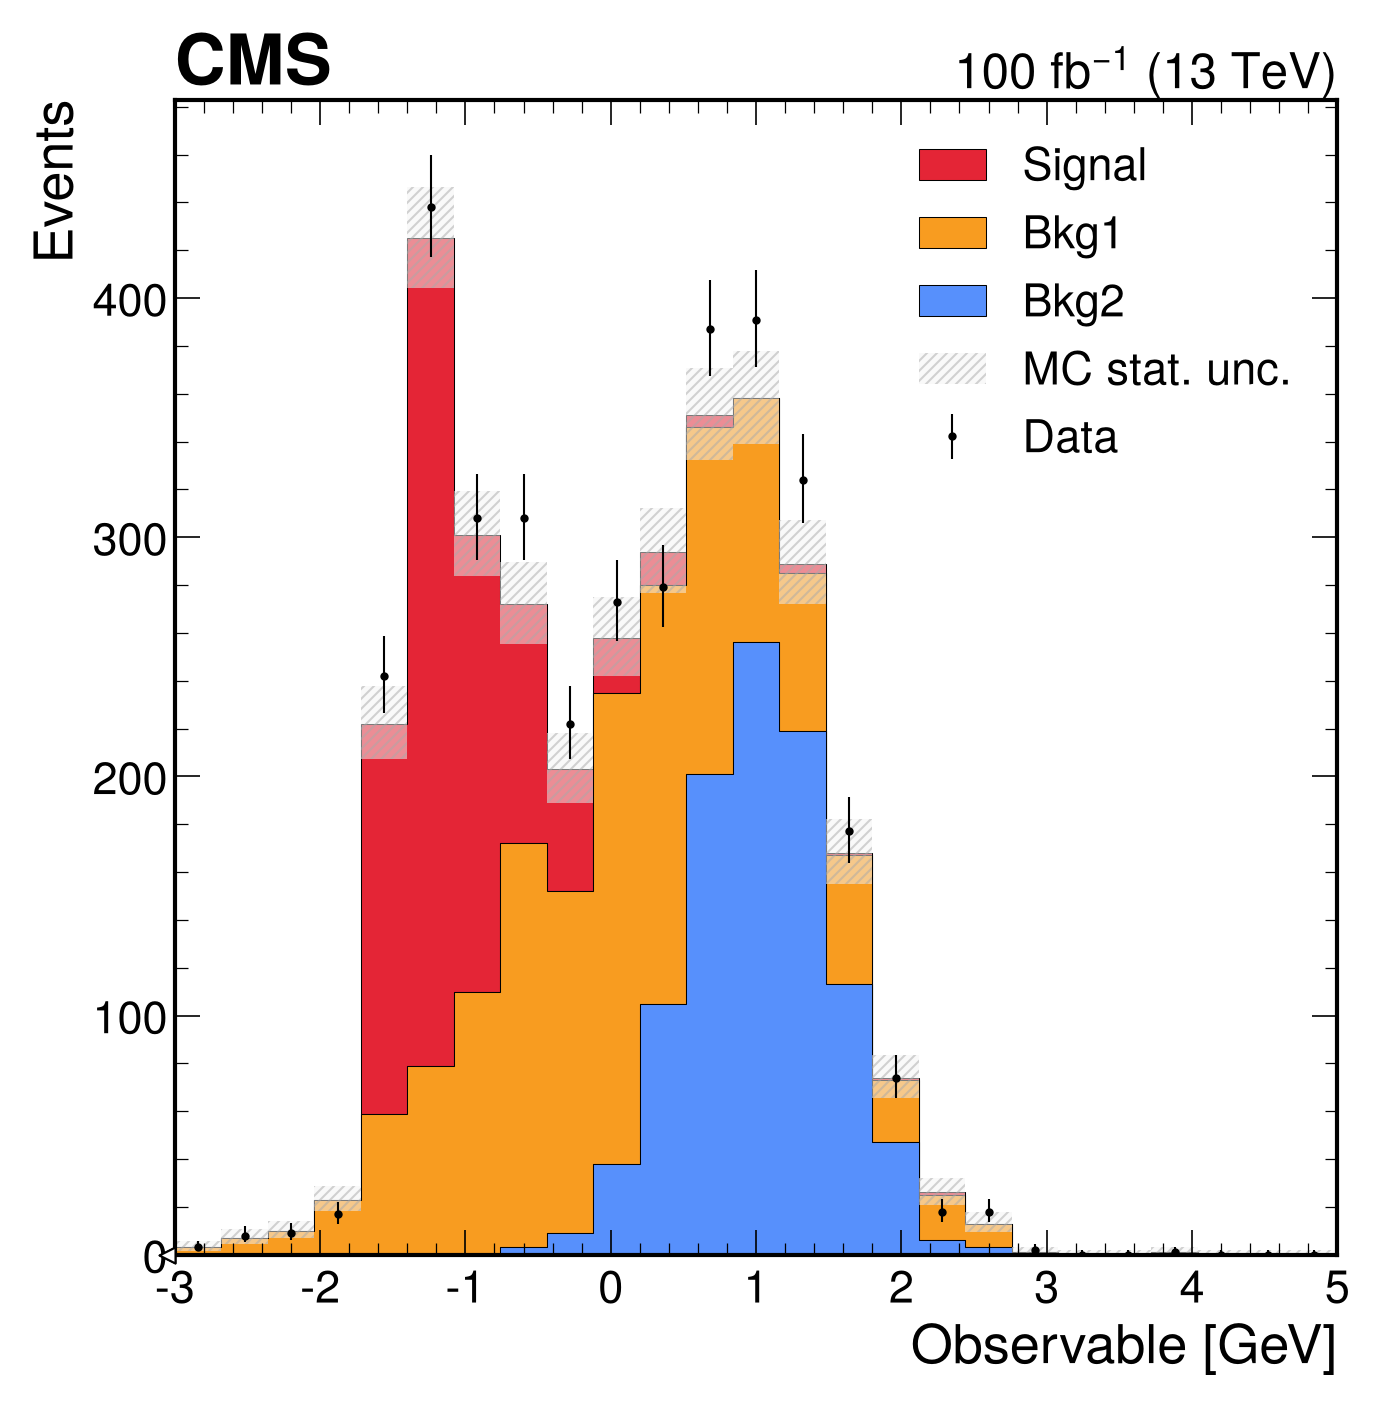
# Generate signal, backgrounds, and data
x1 = np.random.normal(0, 1, 1400)
x2 = np.random.normal(1, 0.5, 1000)
x3 = np.random.exponential(0.5, 900) - 1.5
data_x = np.random.choice([*x1, *x2, *x3], size=3500, replace=True)
h_bkg1 = hist.new.Reg(25, -3, 5).Weight().fill(x1)
h_bkg2 = hist.new.Reg(25, -3, 5).Weight().fill(x2)
h_signal = hist.new.Reg(25, -3, 5).Weight().fill(x3)
h_data = hist.new.Reg(25, -3, 5).Weight().fill(data_x)

# Create comparison plot
fig, ax_main, ax_comp = mh.comp.data_model(
 data_hist=h_data,
 stacked_components=[h_bkg2, h_bkg1, h_signal],
 stacked_labels=['Bkg2', 'Bkg1', 'Signal'],
 xlabel='Observable [GeV]',
 ylabel='Events',
 comparison='pull' # Accept any comparison from mh.comp.comparison()
)
mh.atlas.label(data=True, lumi=150, ax=ax_main)
mh.mpl_magic(soft_fail=True)
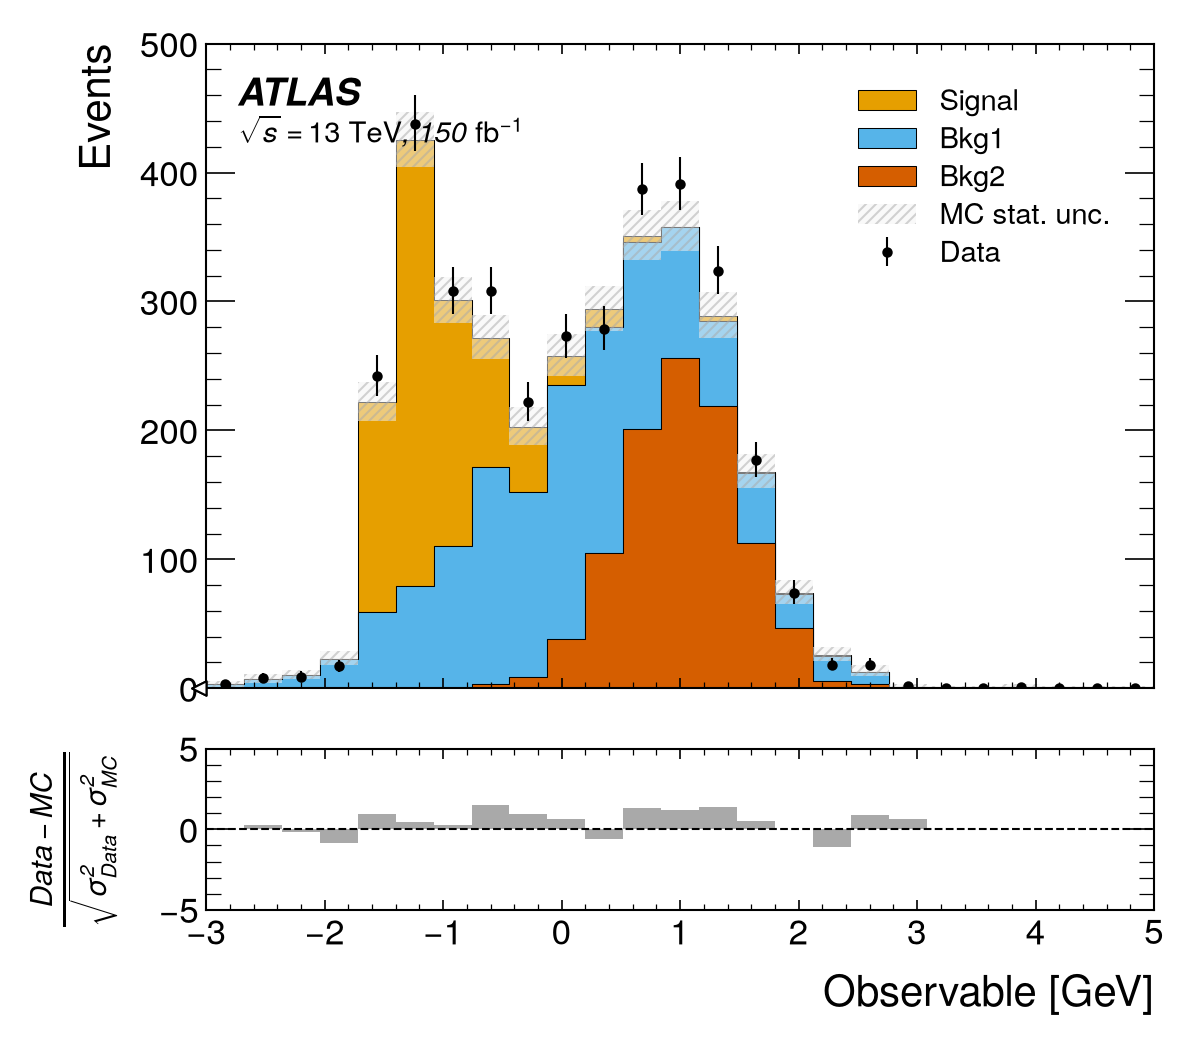
# Generate signal, backgrounds, and data
x1 = np.random.normal(0, 1, 1400)
x2 = np.random.normal(1, 0.5, 1000)
x3 = np.random.exponential(0.5, 900) - 1.5
data_x = np.random.choice([*x1, *x2, *x3], size=3500, replace=True)
h_bkg1 = hist.new.Reg(25, -3, 5).Weight().fill(x1)
h_bkg2 = hist.new.Reg(25, -3, 5).Weight().fill(x2)
h_signal = hist.new.Reg(25, -3, 5).Weight().fill(x3)
h_data = hist.new.Reg(25, -3, 5).Weight().fill(data_x)

# Create comparison plot
fig, ax_main, ax_comp = mh.comp.data_model(
 data_hist=h_data,
 stacked_components=[h_bkg2, h_bkg1, h_signal],
 stacked_labels=['Bkg2', 'Bkg1', 'Signal'],
 xlabel='Observable [GeV]',
 ylabel='Events',
 model_uncertainty=False, # Set the model uncertainty to zero
 comparison='pull', # The pull formula is updated automatically
)
mh.atlas.label(data=True, lumi=150, ax=ax_main)
mh.mpl_magic(soft_fail=True)
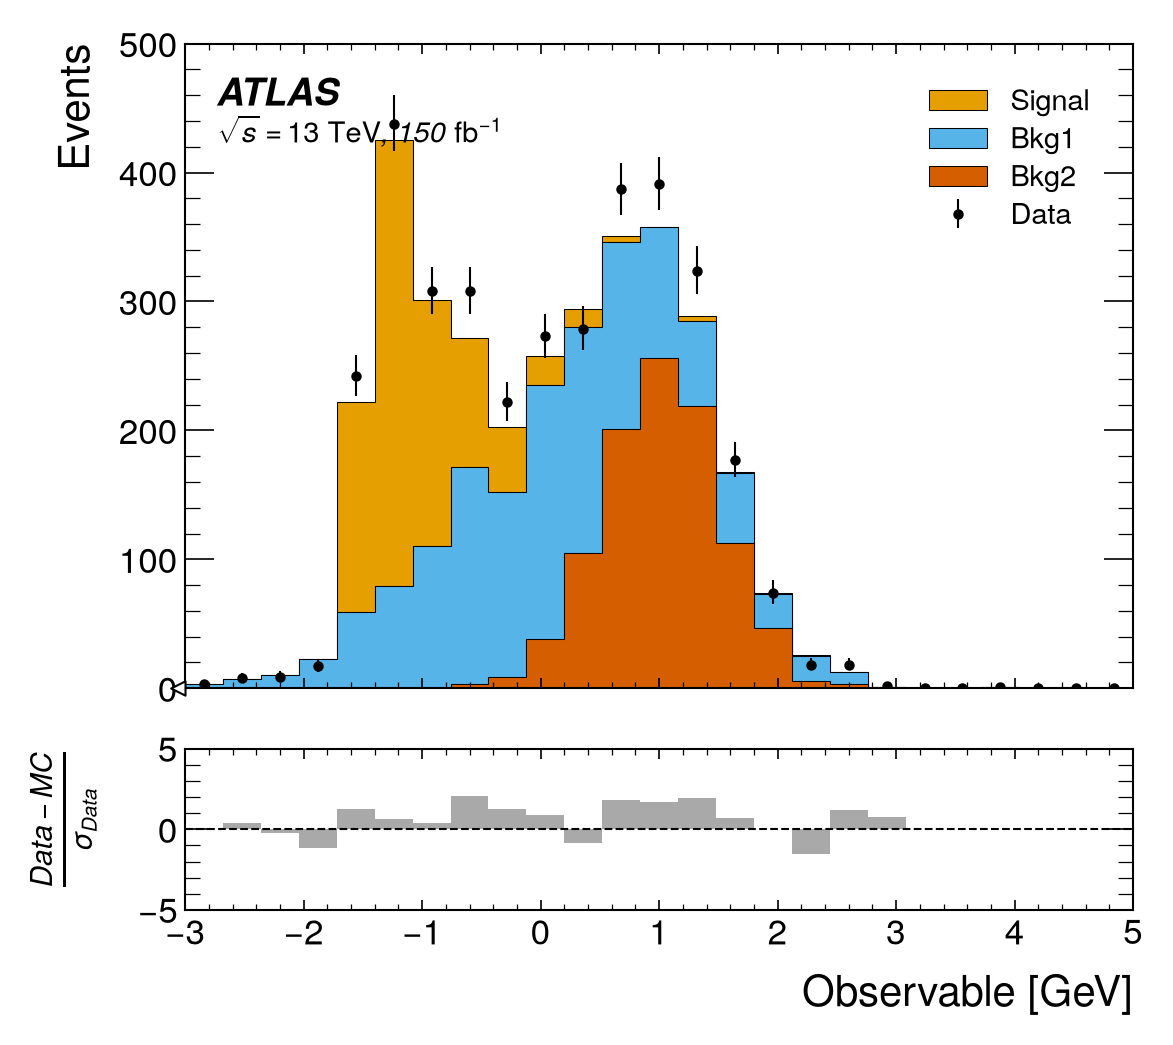
# Generate signal, backgrounds, and data
x1 = np.random.normal(0, 1, 1400)
x2 = np.random.normal(1, 0.5, 1000)
x3 = np.random.exponential(0.5, 900) - 1.5
data_x = np.random.choice([*x1, *x2, *x3], size=3500, replace=True)
h_bkg1 = hist.new.Reg(25, -3, 5).Weight().fill(x1)
h_bkg2 = hist.new.Reg(25, -3, 5).Weight().fill(x2)
h_signal = hist.new.Reg(25, -3, 5).Weight().fill(x3)
h_data = hist.new.Reg(25, -3, 5).Weight().fill(data_x)

# Create comparison plot
fig, ax_main, ax_comp = mh.comp.data_model(
 data_hist=h_data,
 stacked_components=[h_bkg2, h_bkg1],
 stacked_labels=['Bkg2', 'Bkg1'],
 stacked_colors=['grey', 'lightblue'],
 unstacked_components=[h_signal],
 unstacked_labels=['Signal'],
 unstacked_colors=['red'],
 model_sum_kwargs={"show": True, "label": "Total Model", "color": "violet"}, # Just like stacked_components_kwargs and unstacked_components_kwargs, you can pass kwargs for the model sum line
 xlabel='Observable [GeV]',
 ylabel='Events'
)
mh.atlas.label(data=True, lumi=150, ax=ax_main)
mh.mpl_magic(soft_fail=True)
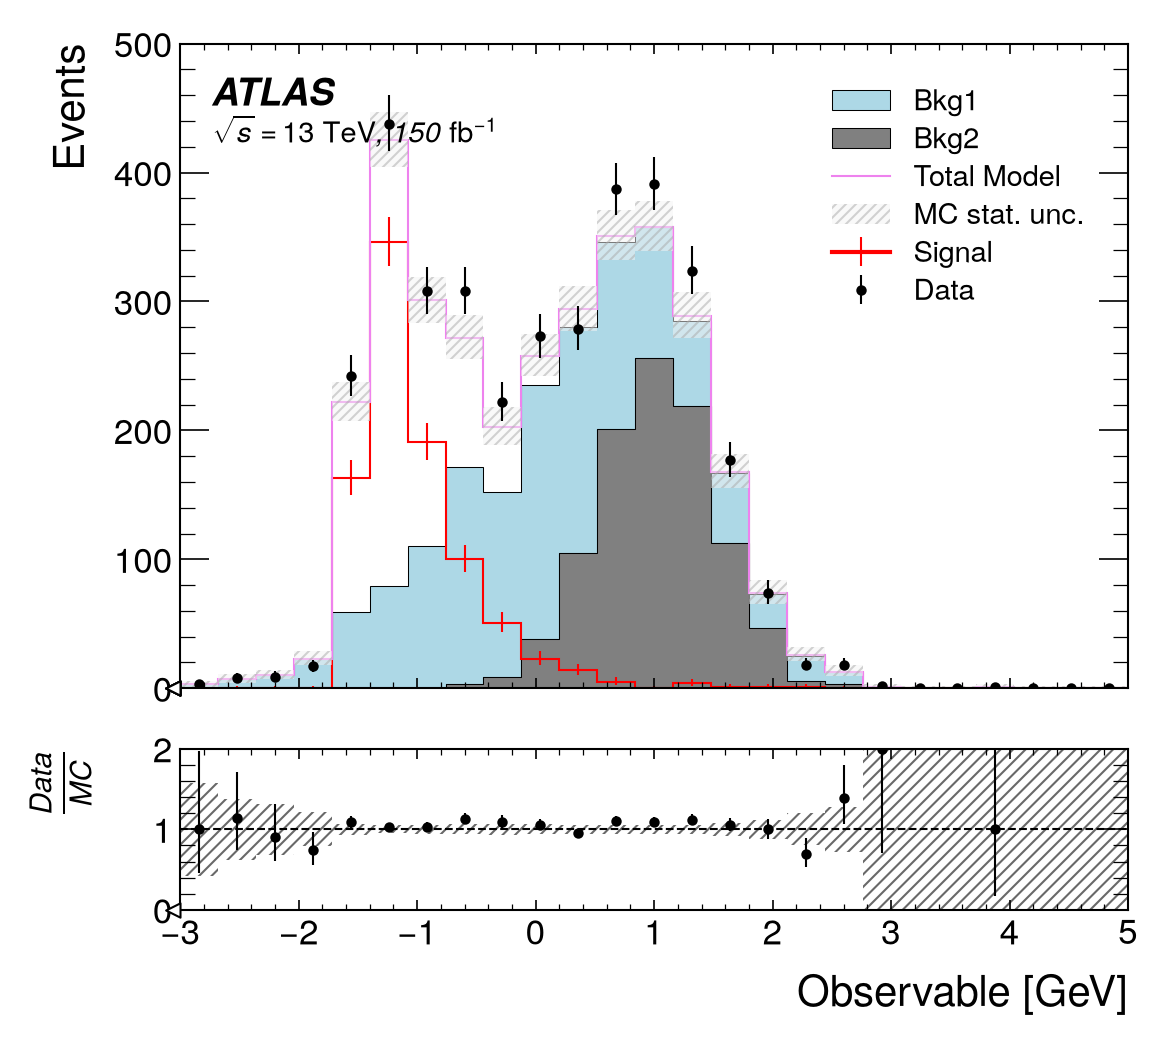
# Generate signal, backgrounds, and data
x1 = np.random.normal(0, 1, 1400)
x2 = np.random.normal(1, 0.5, 1000)
x3 = np.random.exponential(0.5, 900) - 1.5
data_x = np.random.choice([*x1, *x2, *x3], size=3500, replace=True)
h_bkg1 = hist.new.Reg(25, -3, 5).Weight().fill(x1)
h_bkg2 = hist.new.Reg(25, -3, 5).Weight().fill(x2)
h_signal = hist.new.Reg(25, -3, 5).Weight().fill(x3)
h_data = hist.new.Reg(25, -3, 5).Weight().fill(data_x)

# Create comparison plot
fig, ax_main, ax_comparison = mh.comp.data_model(
 data_hist=h_data,
 stacked_components=[h_bkg2, h_bkg1, h_signal],
 stacked_labels=['Bkg2', 'Bkg1', 'Signal'],
 xlabel='Observable [GeV]',
 ylabel='Events',
 plot_only='ax_main' # Only plot the comparison axis (works with 'ax_comparison' as well).
)
mh.atlas.label(data=True, lumi=150, ax=ax_main)
mh.mpl_magic(soft_fail=True)
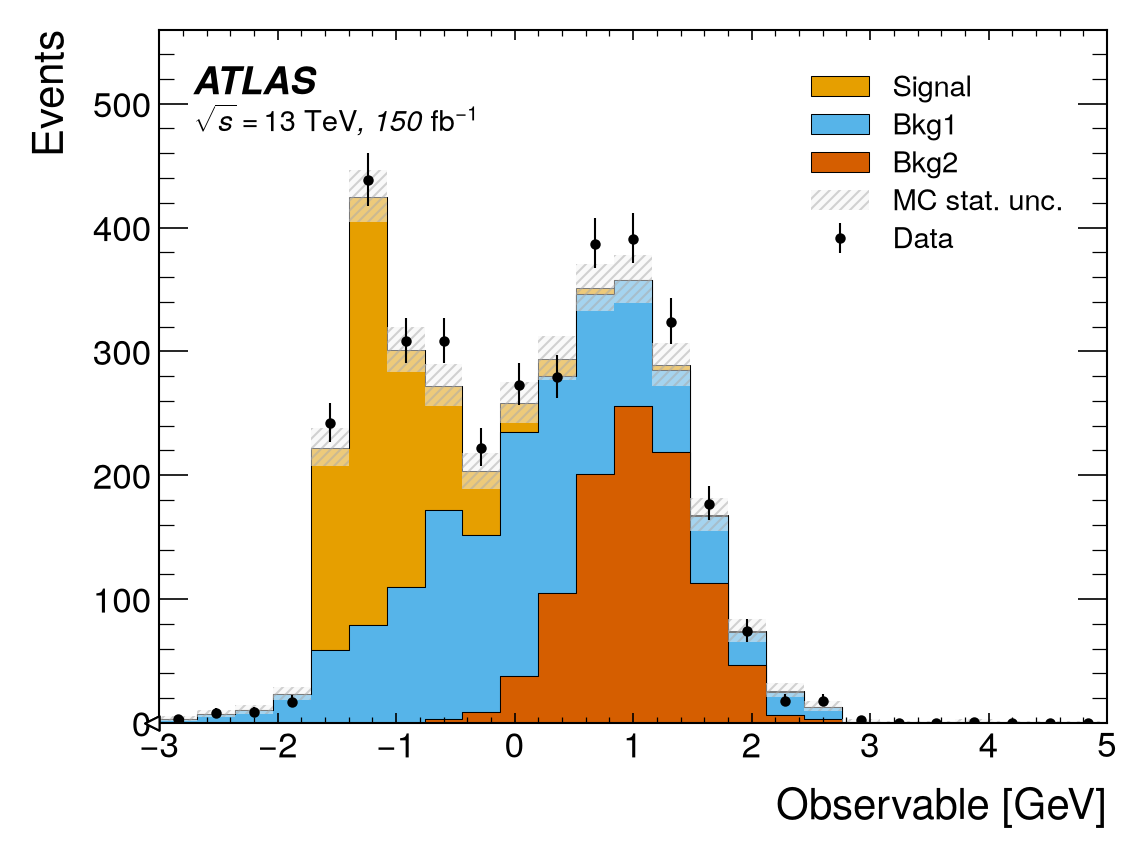
# Generate signal, backgrounds, and data
x1 = np.random.normal(0, 1, 1400)
x2 = np.random.normal(1, 0.5, 1000)
x3 = np.random.exponential(0.5, 900) - 1.5
data_x = np.random.choice([*x1, *x2, *x3], size=3500, replace=True)
h_bkg1 = hist.new.Reg(25, -3, 5).Weight().fill(x1)
h_bkg2 = hist.new.Reg(25, -3, 5).Weight().fill(x2)
h_signal = hist.new.Reg(25, -3, 5).Weight().fill(x3)
h_data = hist.new.Reg(25, -3, 5).Weight().fill(data_x)

# Create comparison plot
fig, ax_main, ax_comp = mh.comp.data_model(
 data_hist=h_data,
 stacked_components=[h_bkg2, h_bkg1, h_signal],
 stacked_labels=['Bkg2', 'Bkg1', 'Signal'],
 xlabel='Observable [GeV]',
 ylabel='Events',
 comparison='pull' # Accept any comparison from mh.comp.comparison()
)
mh.lhcb.label(data=True, lumi=50, ax=ax_main)
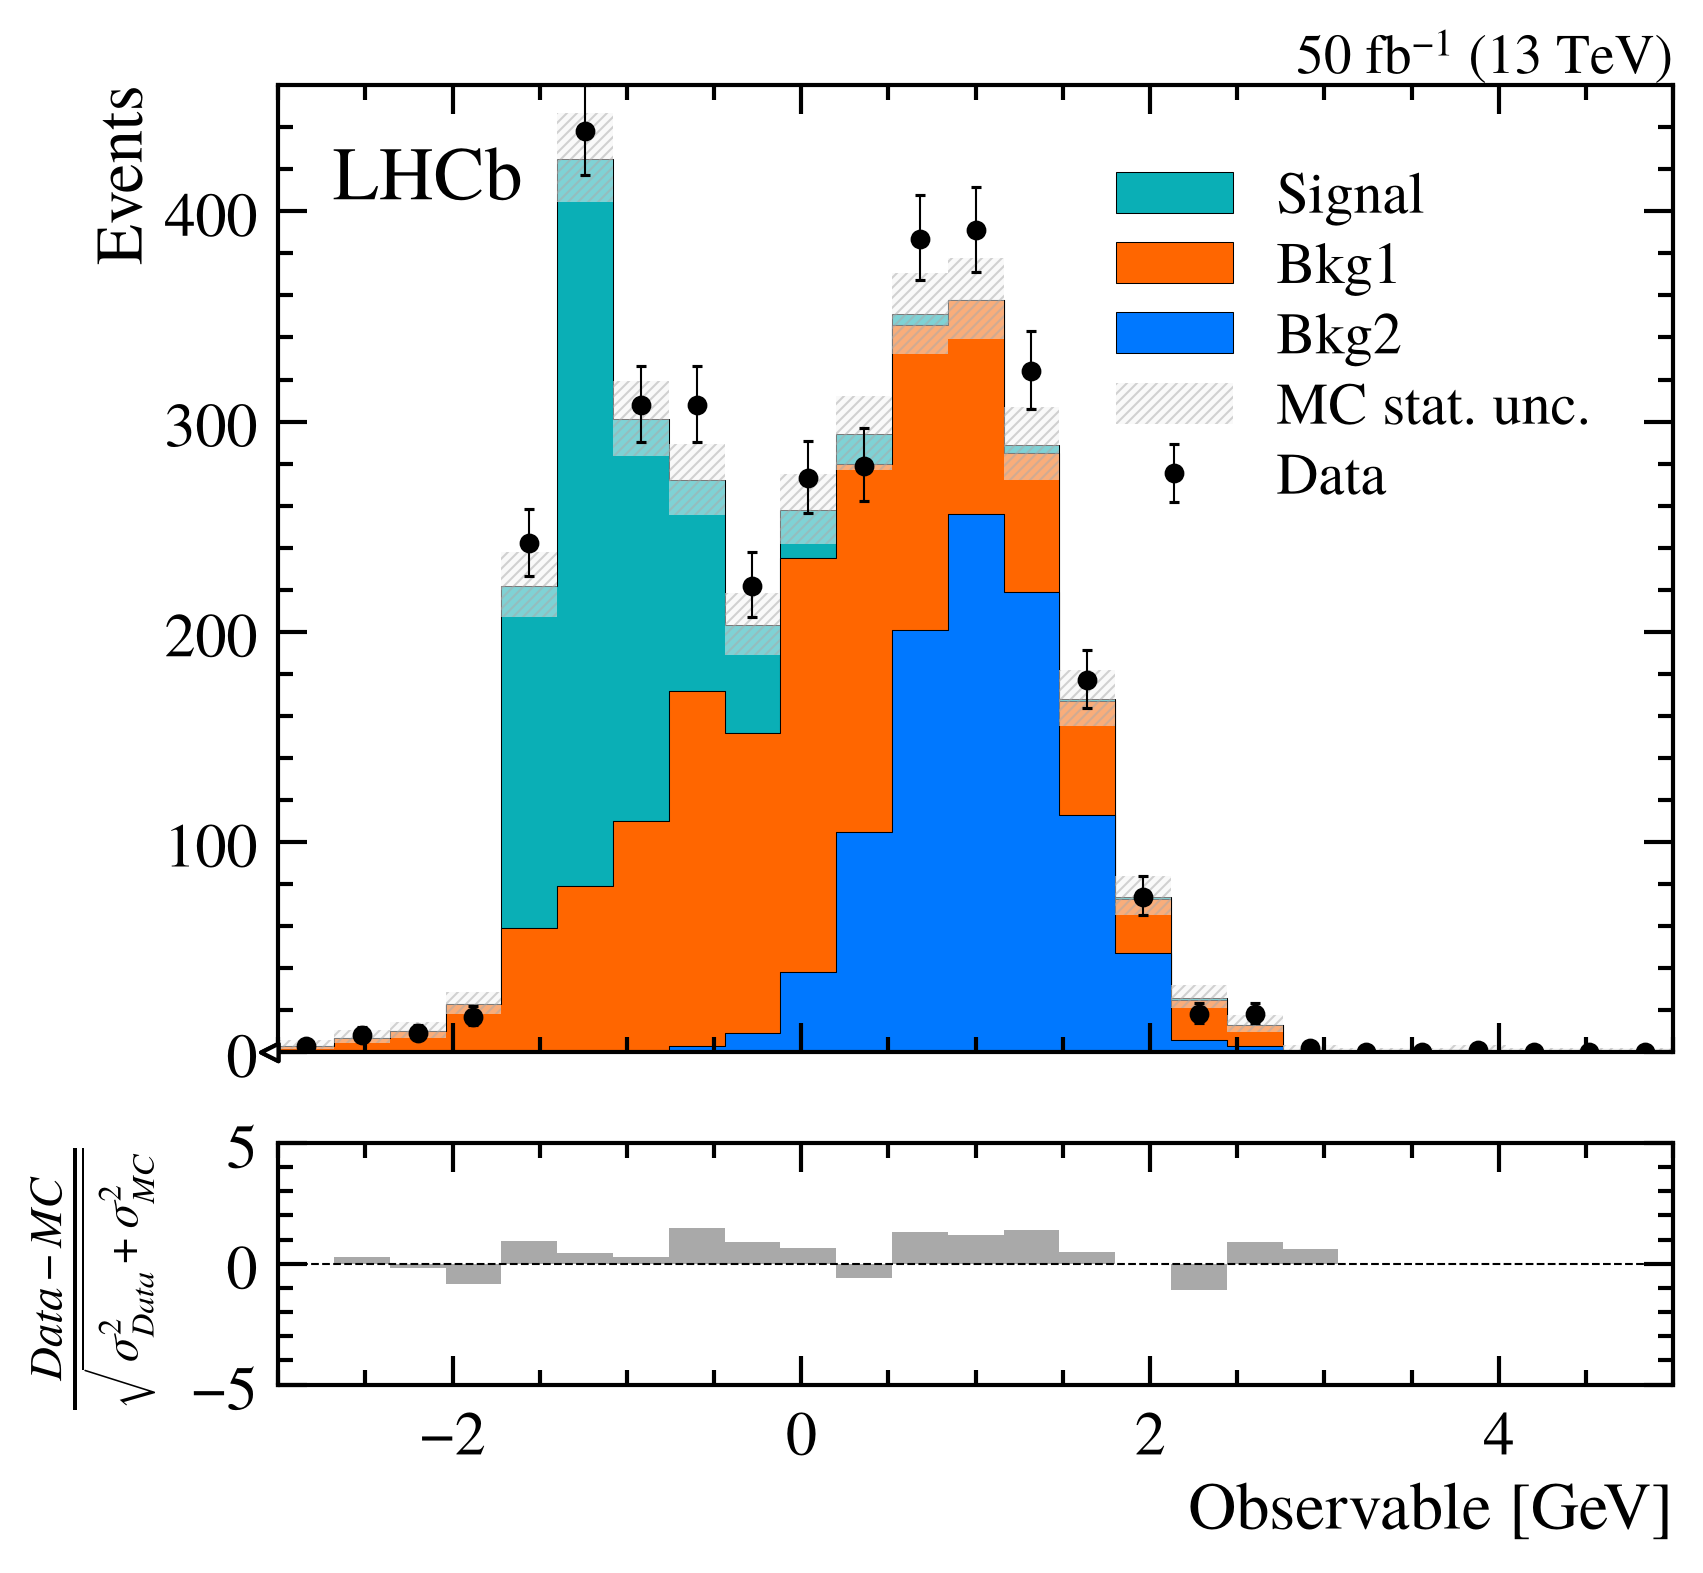
# Generate signal, backgrounds, and data
x1 = np.random.normal(0, 1, 1400)
x2 = np.random.normal(1, 0.5, 1000)
x3 = np.random.exponential(0.5, 900) - 1.5
data_x = np.random.choice([*x1, *x2, *x3], size=3500, replace=True)
h_bkg1 = hist.new.Reg(25, -3, 5).Weight().fill(x1)
h_bkg2 = hist.new.Reg(25, -3, 5).Weight().fill(x2)
h_signal = hist.new.Reg(25, -3, 5).Weight().fill(x3)
h_data = hist.new.Reg(25, -3, 5).Weight().fill(data_x)

# Create comparison plot
fig, ax_main, ax_comp = mh.comp.data_model(
 data_hist=h_data,
 stacked_components=[h_bkg2, h_bkg1, h_signal],
 stacked_labels=['Bkg2', 'Bkg1', 'Signal'],
 xlabel='Observable [GeV]',
 ylabel='Events',
 model_uncertainty=False, # Set the model uncertainty to zero
 comparison='pull', # The pull formula is updated automatically
)
mh.lhcb.label(data=True, lumi=50, ax=ax_main)
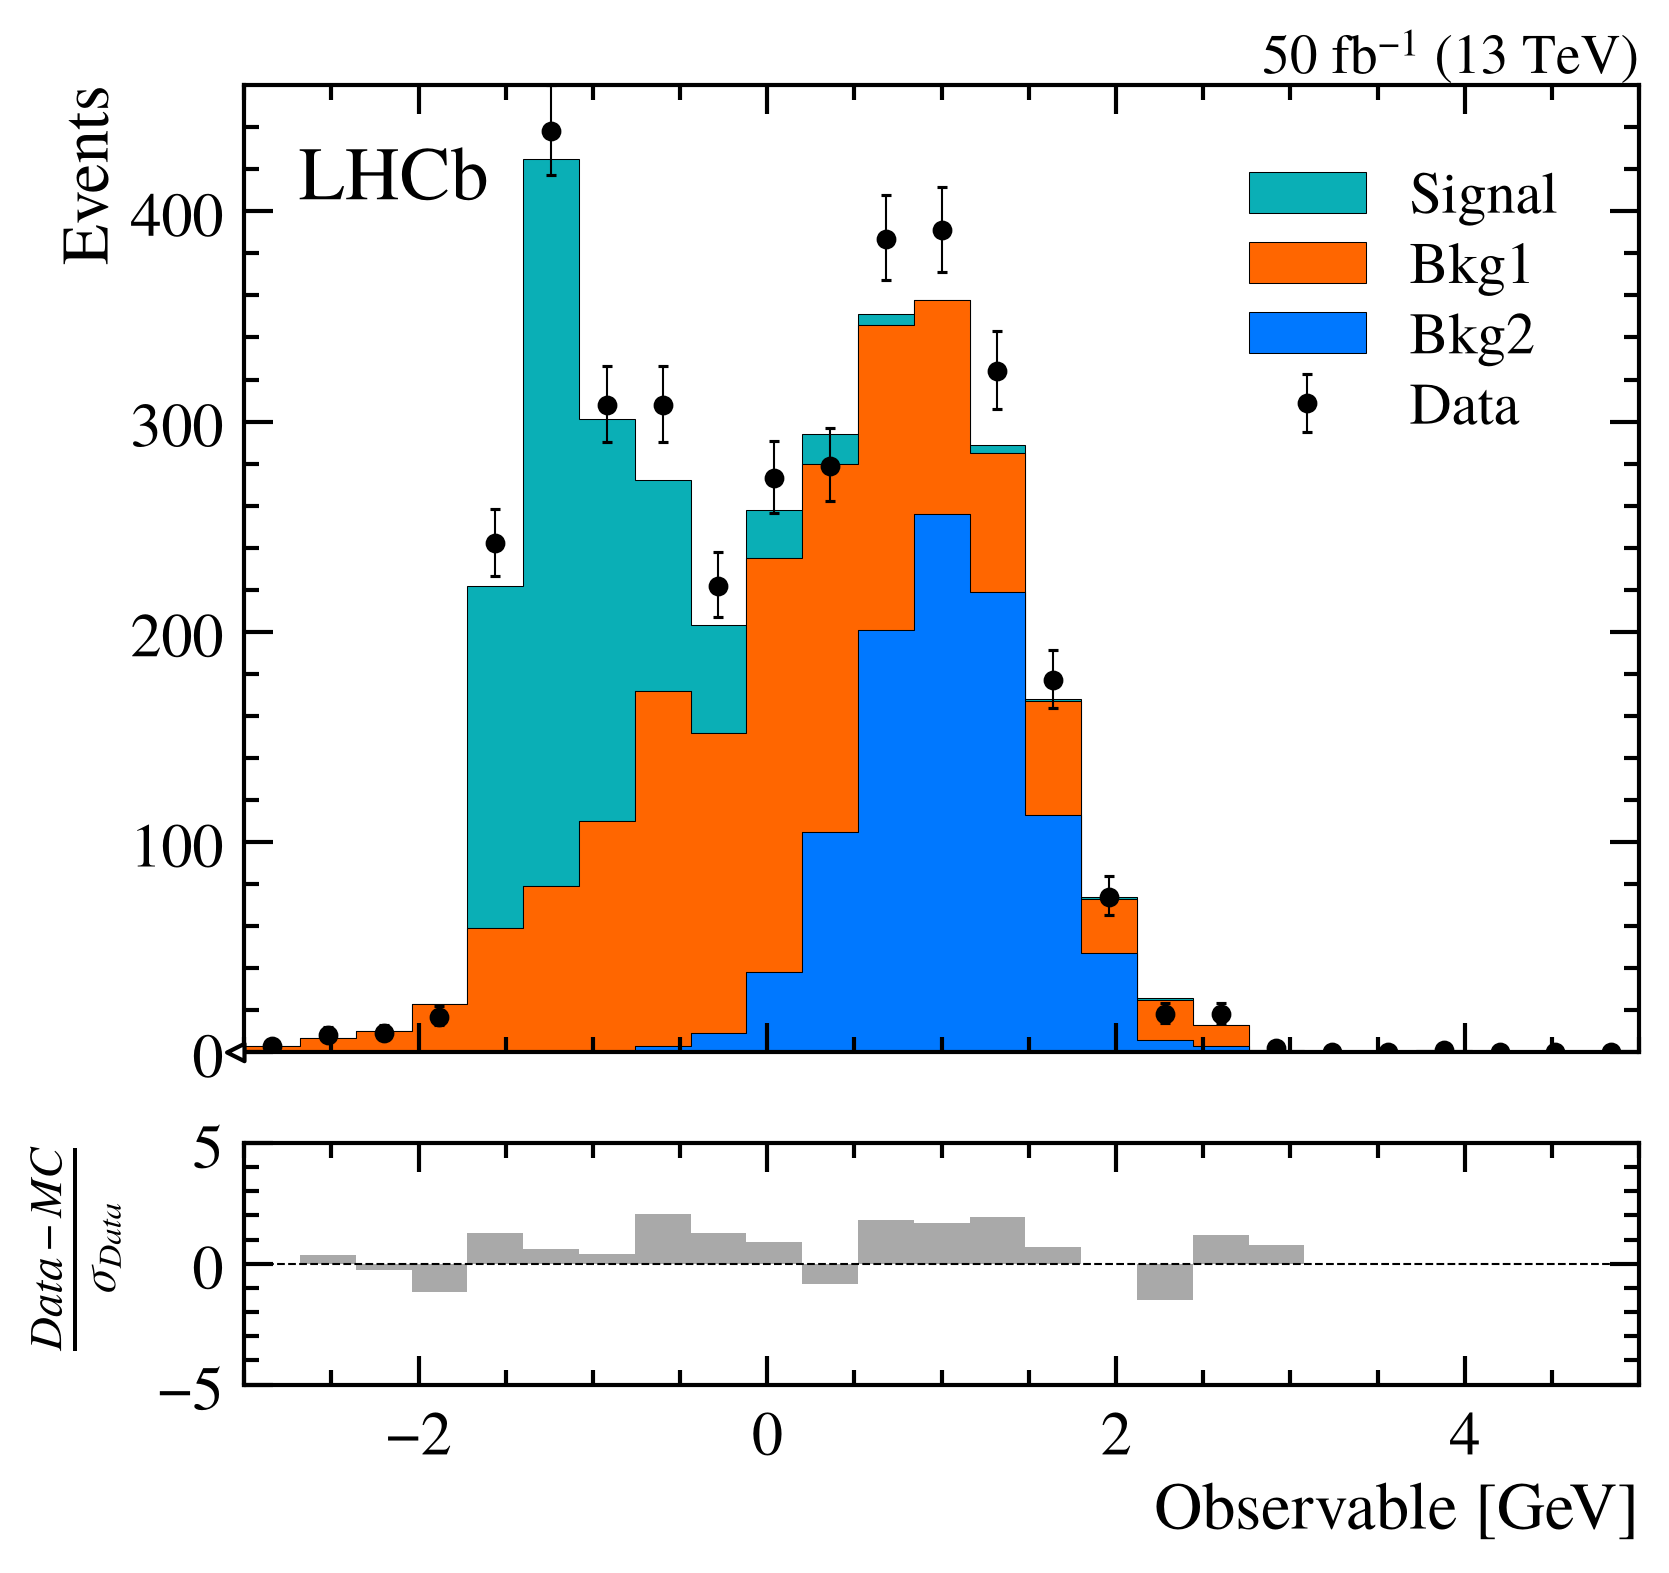
# Generate signal, backgrounds, and data
x1 = np.random.normal(0, 1, 1400)
x2 = np.random.normal(1, 0.5, 1000)
x3 = np.random.exponential(0.5, 900) - 1.5
data_x = np.random.choice([*x1, *x2, *x3], size=3500, replace=True)
h_bkg1 = hist.new.Reg(25, -3, 5).Weight().fill(x1)
h_bkg2 = hist.new.Reg(25, -3, 5).Weight().fill(x2)
h_signal = hist.new.Reg(25, -3, 5).Weight().fill(x3)
h_data = hist.new.Reg(25, -3, 5).Weight().fill(data_x)

# Create comparison plot
fig, ax_main, ax_comp = mh.comp.data_model(
 data_hist=h_data,
 stacked_components=[h_bkg2, h_bkg1],
 stacked_labels=['Bkg2', 'Bkg1'],
 stacked_colors=['grey', 'lightblue'],
 unstacked_components=[h_signal],
 unstacked_labels=['Signal'],
 unstacked_colors=['red'],
 model_sum_kwargs={"show": True, "label": "Total Model", "color": "violet"}, # Just like stacked_components_kwargs and unstacked_components_kwargs, you can pass kwargs for the model sum line
 xlabel='Observable [GeV]',
 ylabel='Events'
)
mh.lhcb.label(data=True, lumi=50, ax=ax_main)
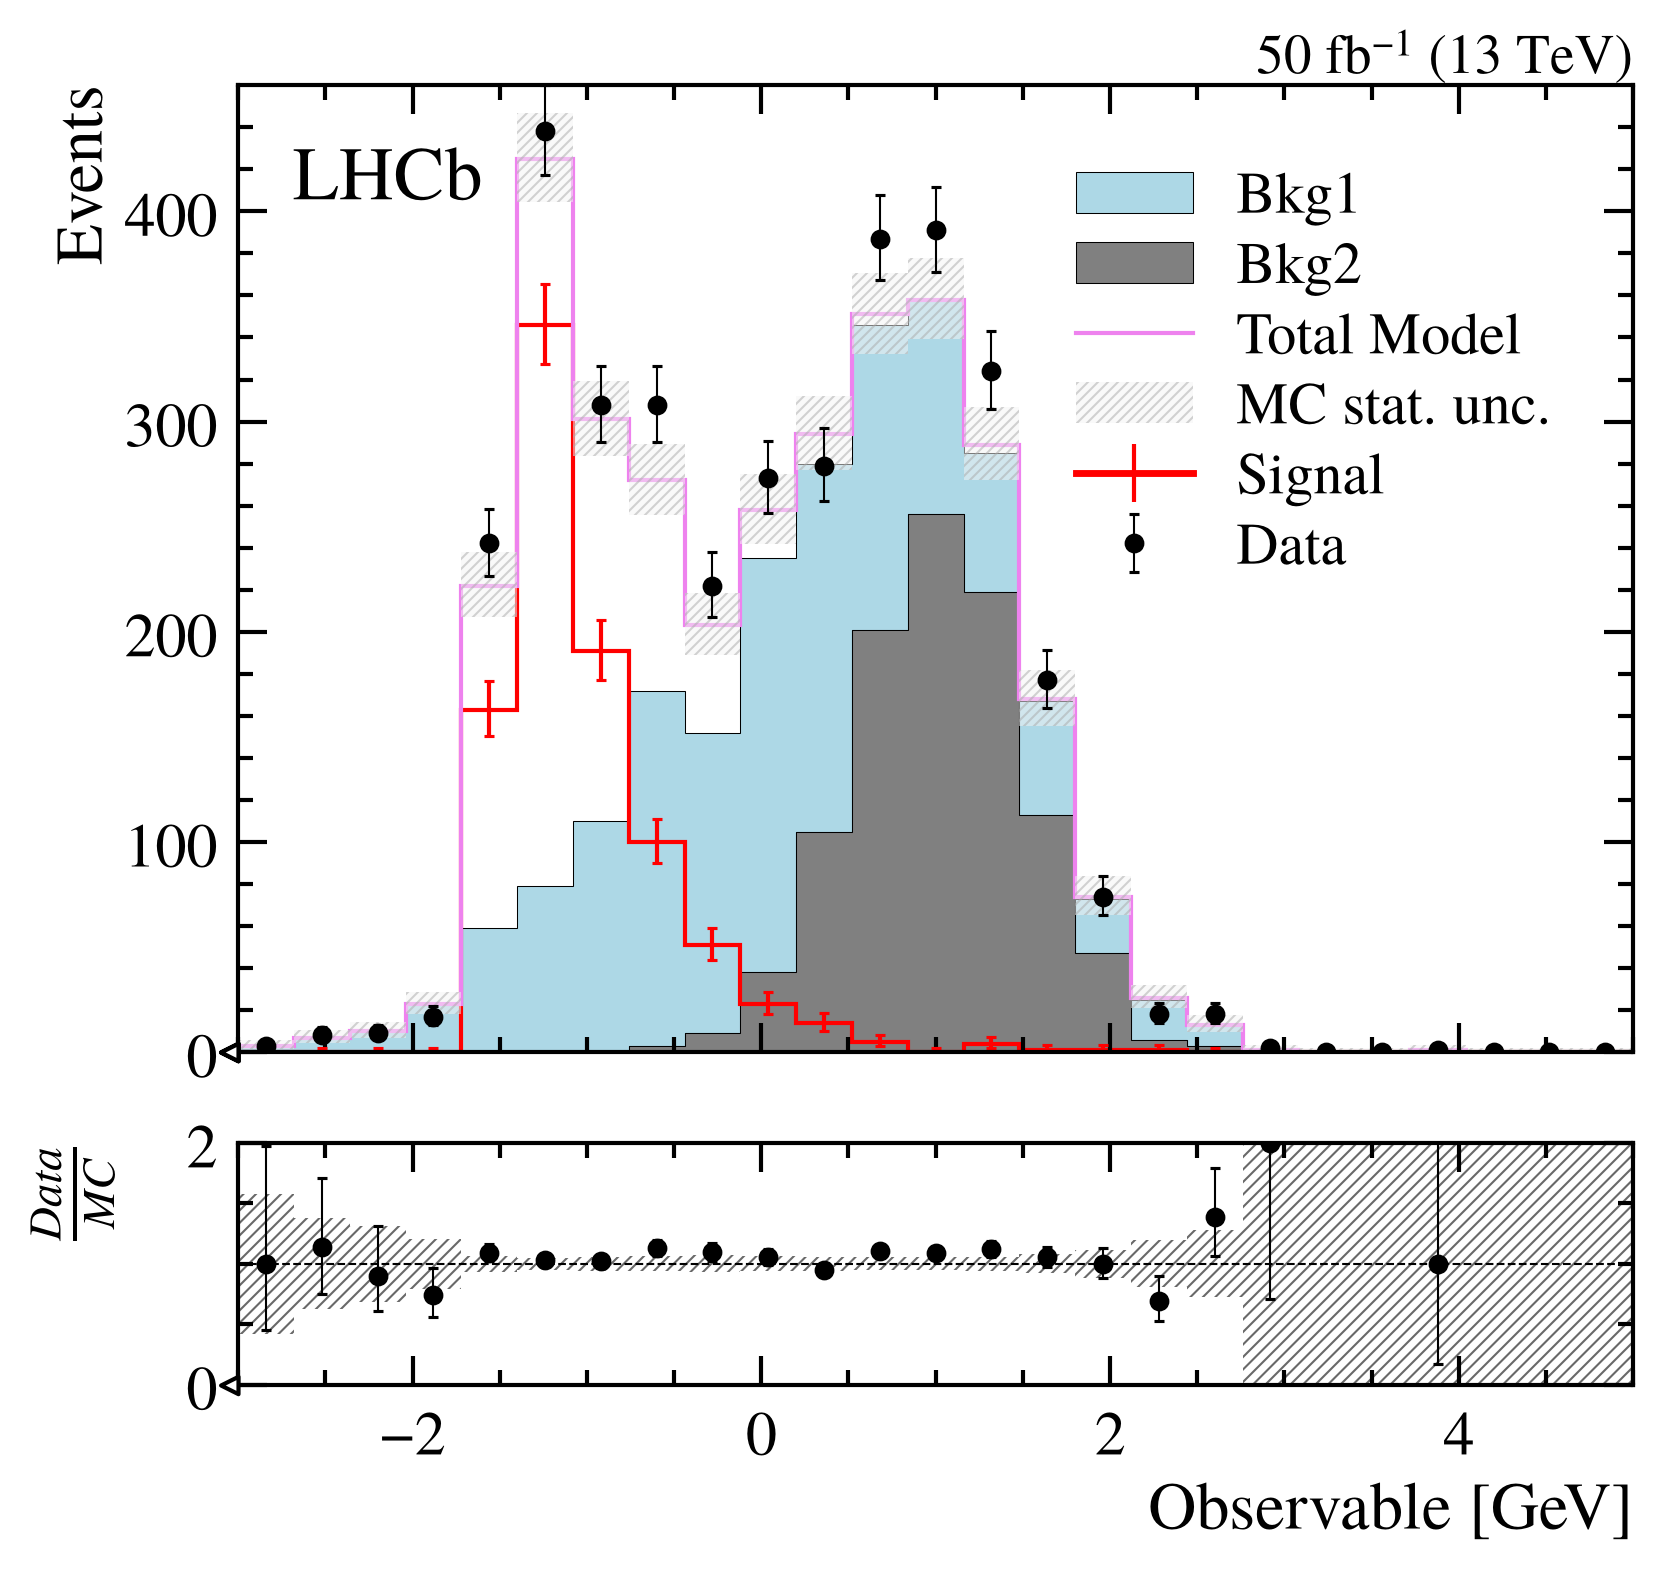
# Generate signal, backgrounds, and data
x1 = np.random.normal(0, 1, 1400)
x2 = np.random.normal(1, 0.5, 1000)
x3 = np.random.exponential(0.5, 900) - 1.5
data_x = np.random.choice([*x1, *x2, *x3], size=3500, replace=True)
h_bkg1 = hist.new.Reg(25, -3, 5).Weight().fill(x1)
h_bkg2 = hist.new.Reg(25, -3, 5).Weight().fill(x2)
h_signal = hist.new.Reg(25, -3, 5).Weight().fill(x3)
h_data = hist.new.Reg(25, -3, 5).Weight().fill(data_x)

# Create comparison plot
fig, ax_main, ax_comparison = mh.comp.data_model(
 data_hist=h_data,
 stacked_components=[h_bkg2, h_bkg1, h_signal],
 stacked_labels=['Bkg2', 'Bkg1', 'Signal'],
 xlabel='Observable [GeV]',
 ylabel='Events',
 plot_only='ax_main' # Only plot the comparison axis (works with 'ax_comparison' as well).
)
mh.lhcb.label(data=True, lumi=50, ax=ax_main)
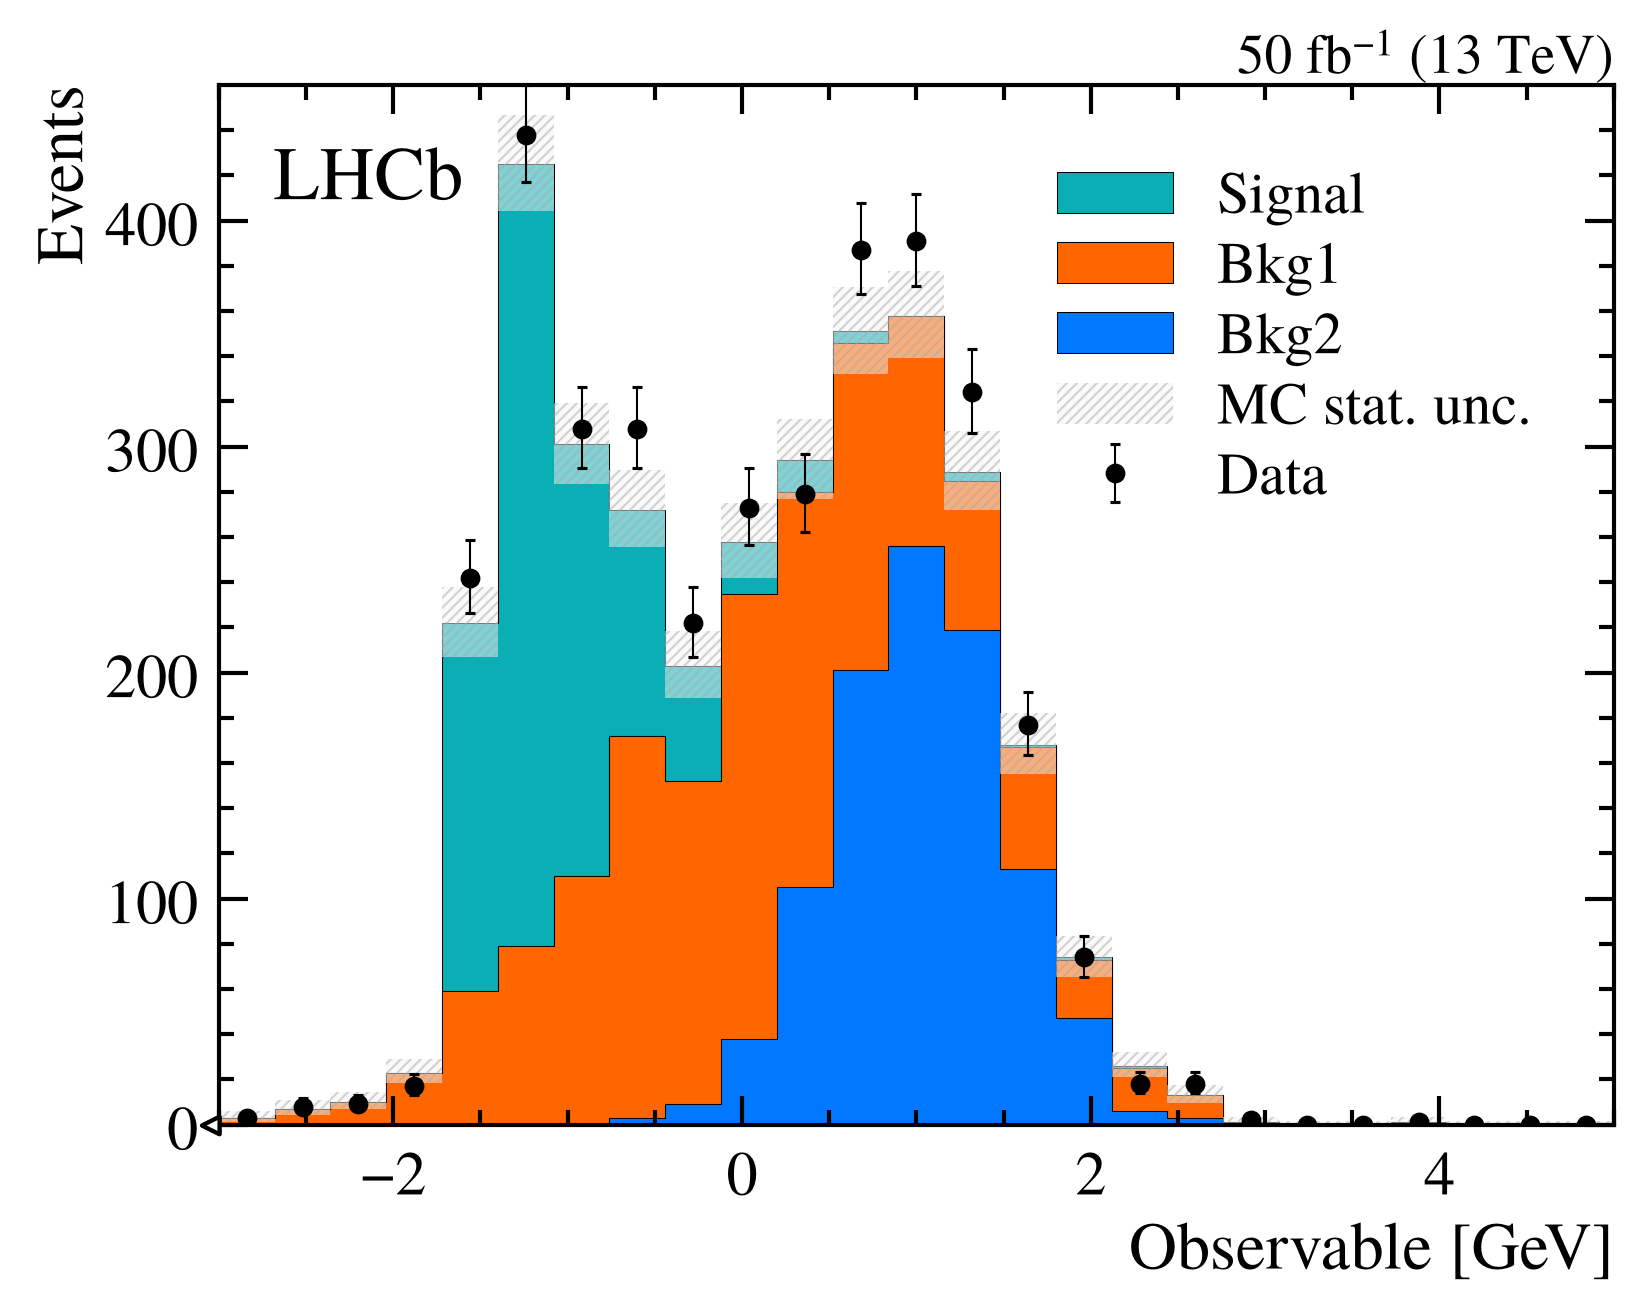
# Generate signal, backgrounds, and data
x1 = np.random.normal(0, 1, 1400)
x2 = np.random.normal(1, 0.5, 1000)
x3 = np.random.exponential(0.5, 900) - 1.5
data_x = np.random.choice([*x1, *x2, *x3], size=3500, replace=True)
h_bkg1 = hist.new.Reg(25, -3, 5).Weight().fill(x1)
h_bkg2 = hist.new.Reg(25, -3, 5).Weight().fill(x2)
h_signal = hist.new.Reg(25, -3, 5).Weight().fill(x3)
h_data = hist.new.Reg(25, -3, 5).Weight().fill(data_x)

# Create comparison plot
fig, ax_main, ax_comp = mh.comp.data_model(
 data_hist=h_data,
 stacked_components=[h_bkg2, h_bkg1, h_signal],
 stacked_labels=['Bkg2', 'Bkg1', 'Signal'],
 xlabel='Observable [GeV]',
 ylabel='Events',
 comparison='pull' # Accept any comparison from mh.comp.comparison()
)
mh.alice.label(data=True, lumi=100, ax=ax_main)
mh.mpl_magic(soft_fail=True)
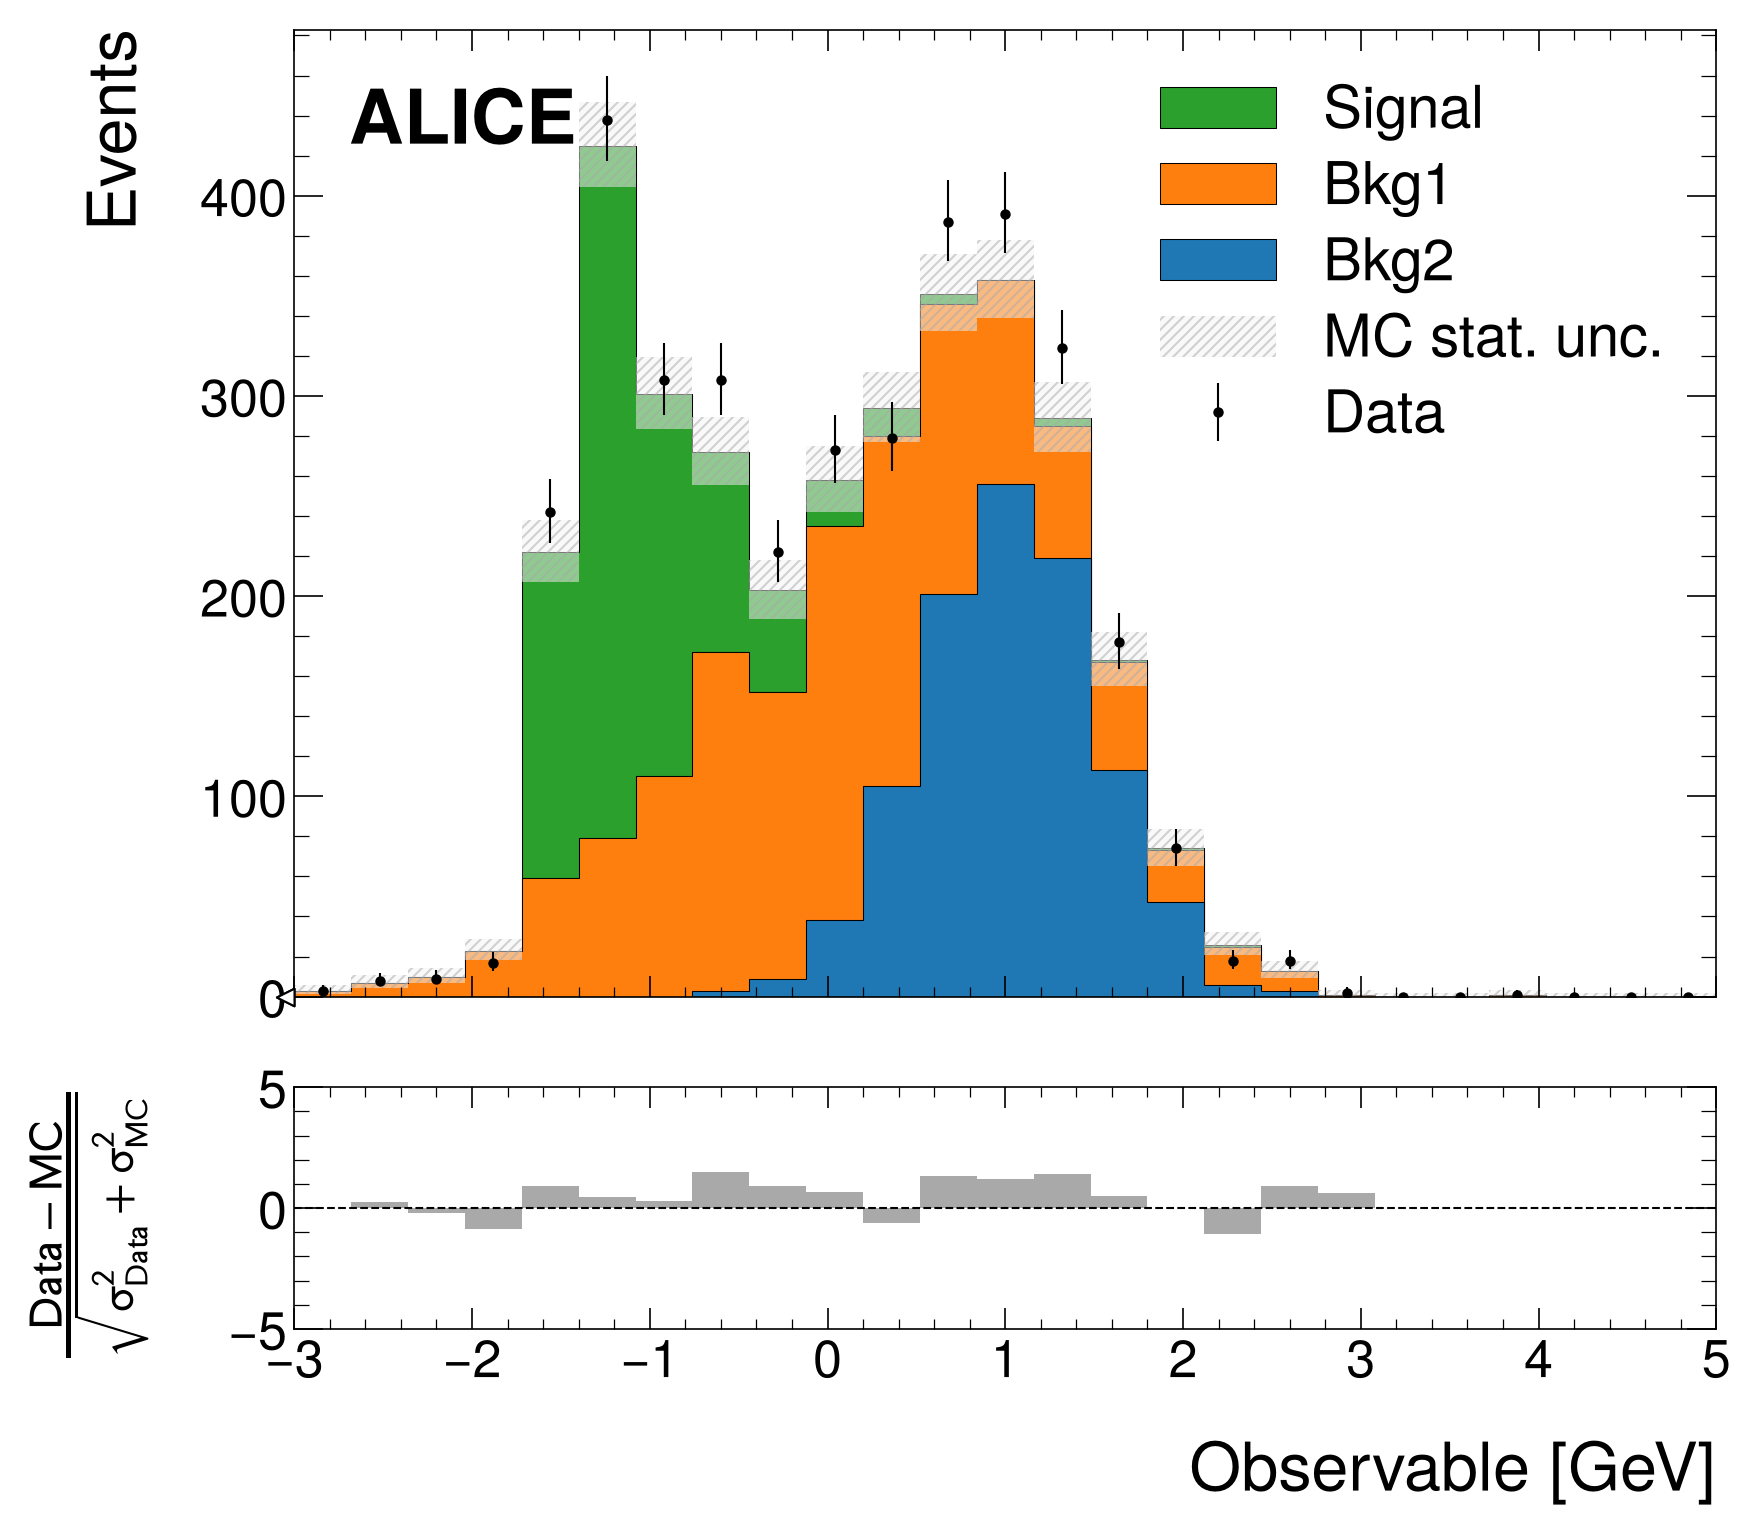
# Generate signal, backgrounds, and data
x1 = np.random.normal(0, 1, 1400)
x2 = np.random.normal(1, 0.5, 1000)
x3 = np.random.exponential(0.5, 900) - 1.5
data_x = np.random.choice([*x1, *x2, *x3], size=3500, replace=True)
h_bkg1 = hist.new.Reg(25, -3, 5).Weight().fill(x1)
h_bkg2 = hist.new.Reg(25, -3, 5).Weight().fill(x2)
h_signal = hist.new.Reg(25, -3, 5).Weight().fill(x3)
h_data = hist.new.Reg(25, -3, 5).Weight().fill(data_x)

# Create comparison plot
fig, ax_main, ax_comp = mh.comp.data_model(
 data_hist=h_data,
 stacked_components=[h_bkg2, h_bkg1, h_signal],
 stacked_labels=['Bkg2', 'Bkg1', 'Signal'],
 xlabel='Observable [GeV]',
 ylabel='Events',
 model_uncertainty=False, # Set the model uncertainty to zero
 comparison='pull', # The pull formula is updated automatically
)
mh.alice.label(data=True, lumi=100, ax=ax_main)
mh.mpl_magic(soft_fail=True)
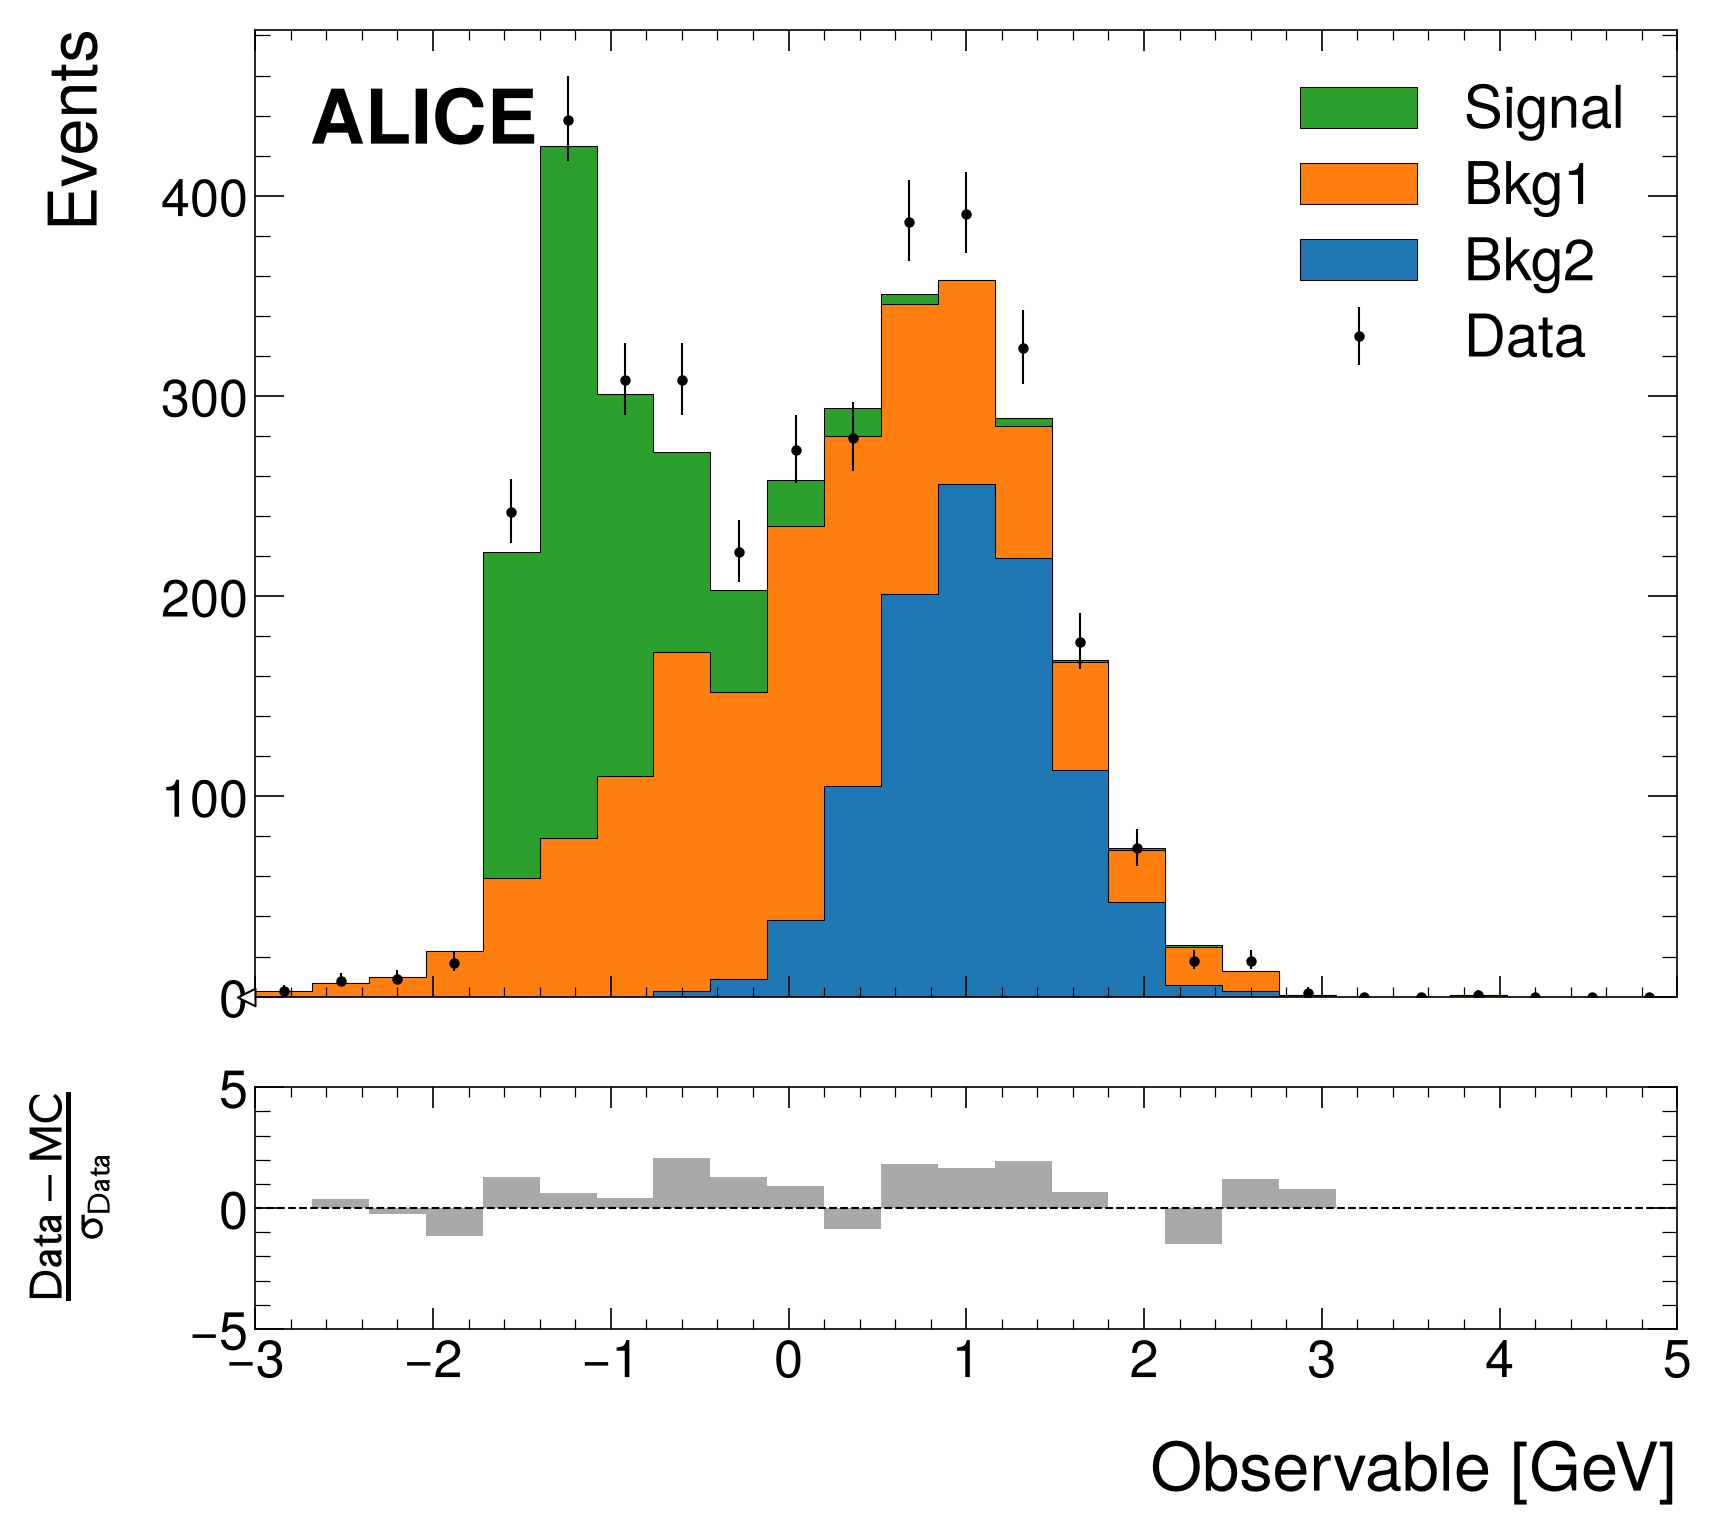
# Generate signal, backgrounds, and data
x1 = np.random.normal(0, 1, 1400)
x2 = np.random.normal(1, 0.5, 1000)
x3 = np.random.exponential(0.5, 900) - 1.5
data_x = np.random.choice([*x1, *x2, *x3], size=3500, replace=True)
h_bkg1 = hist.new.Reg(25, -3, 5).Weight().fill(x1)
h_bkg2 = hist.new.Reg(25, -3, 5).Weight().fill(x2)
h_signal = hist.new.Reg(25, -3, 5).Weight().fill(x3)
h_data = hist.new.Reg(25, -3, 5).Weight().fill(data_x)

# Create comparison plot
fig, ax_main, ax_comp = mh.comp.data_model(
 data_hist=h_data,
 stacked_components=[h_bkg2, h_bkg1],
 stacked_labels=['Bkg2', 'Bkg1'],
 stacked_colors=['grey', 'lightblue'],
 unstacked_components=[h_signal],
 unstacked_labels=['Signal'],
 unstacked_colors=['red'],
 model_sum_kwargs={"show": True, "label": "Total Model", "color": "violet"}, # Just like stacked_components_kwargs and unstacked_components_kwargs, you can pass kwargs for the model sum line
 xlabel='Observable [GeV]',
 ylabel='Events'
)
mh.alice.label(data=True, lumi=100, ax=ax_main)
mh.mpl_magic(soft_fail=True)
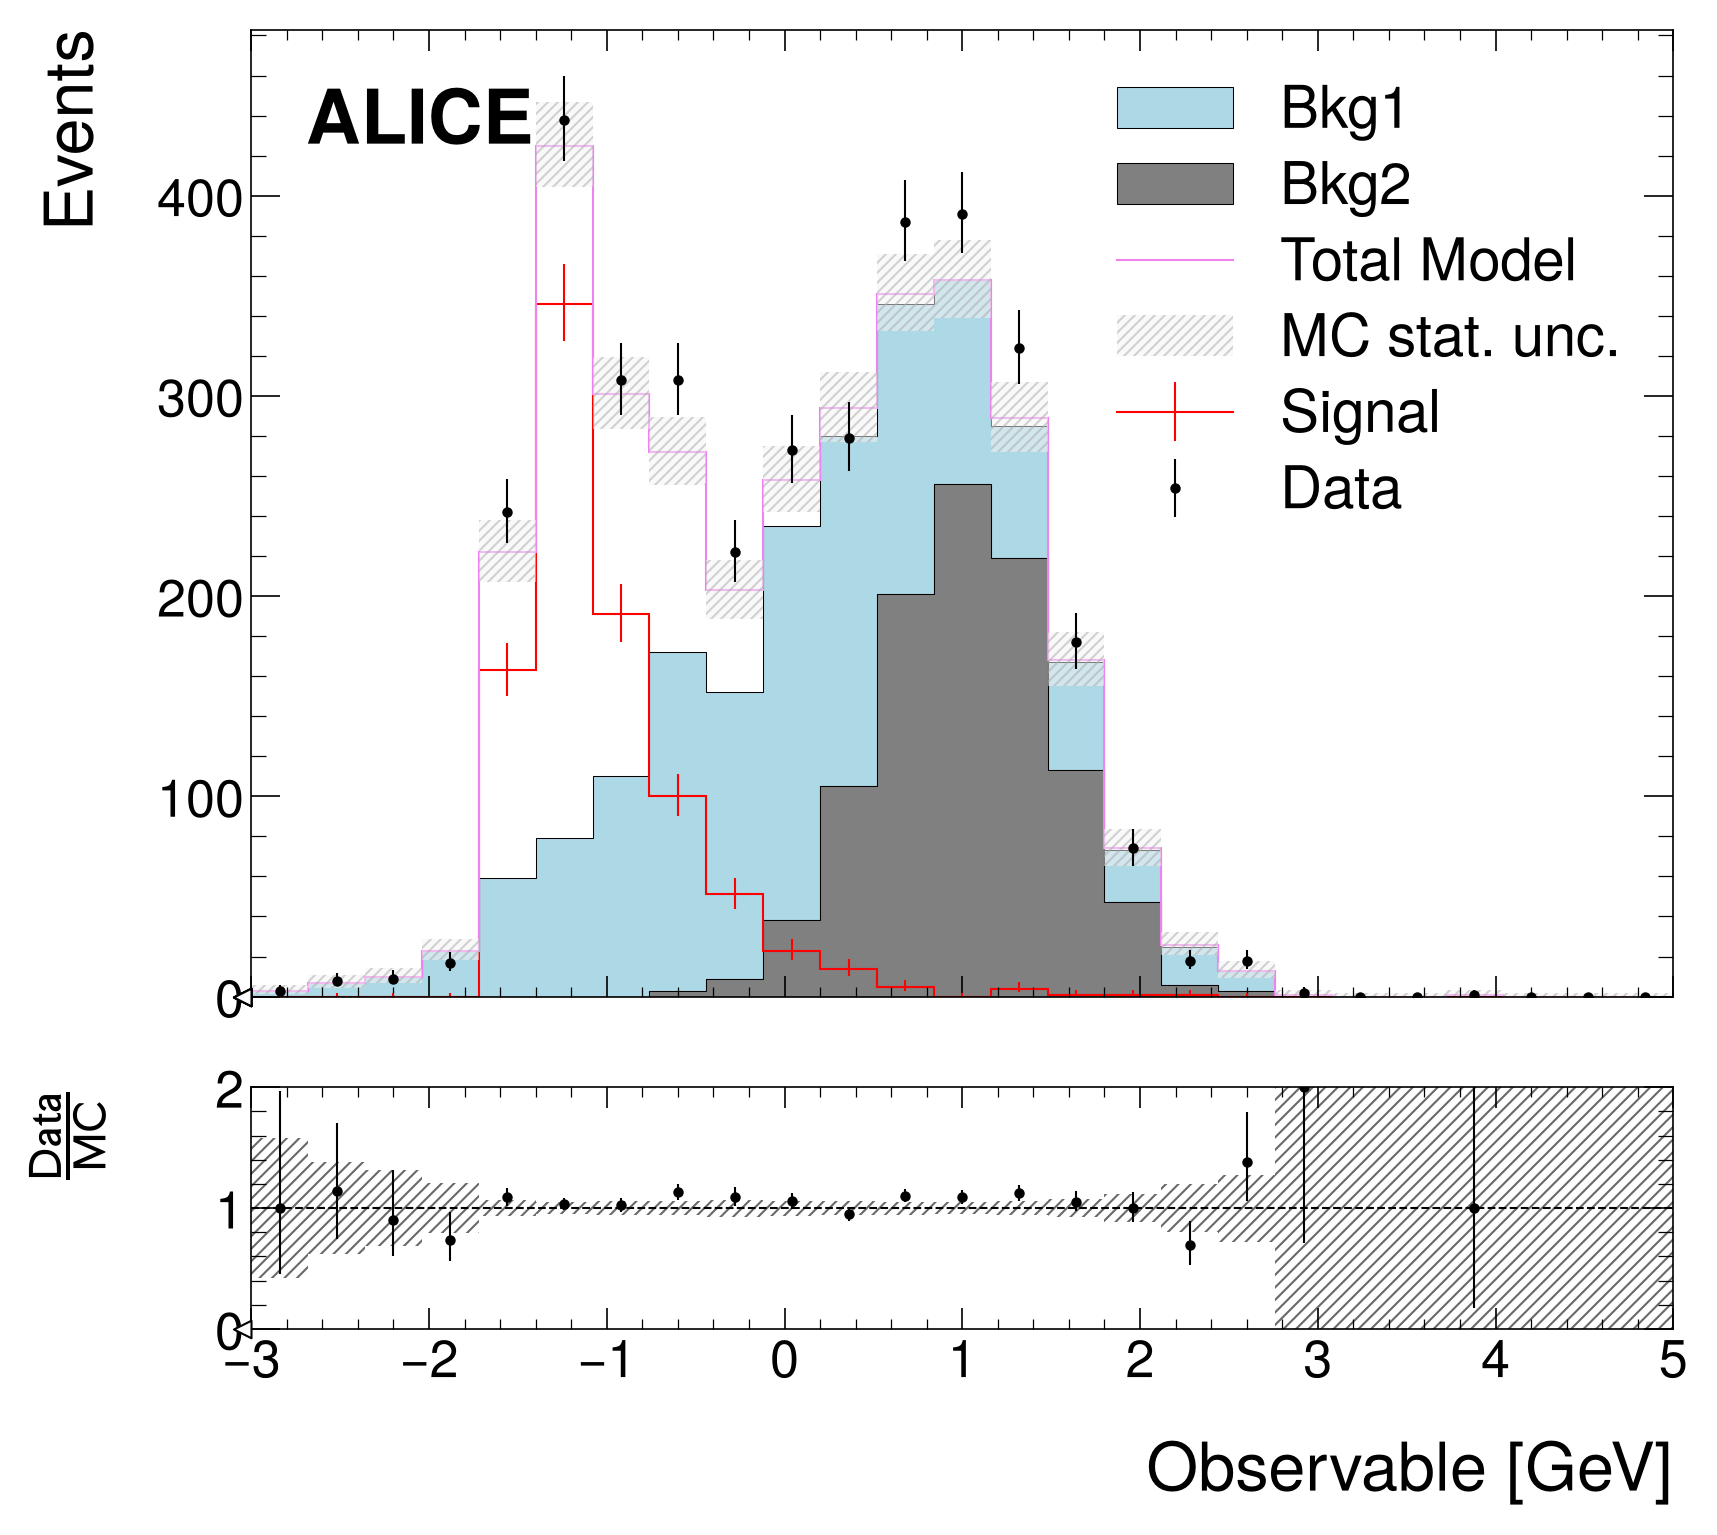
# Generate signal, backgrounds, and data
x1 = np.random.normal(0, 1, 1400)
x2 = np.random.normal(1, 0.5, 1000)
x3 = np.random.exponential(0.5, 900) - 1.5
data_x = np.random.choice([*x1, *x2, *x3], size=3500, replace=True)
h_bkg1 = hist.new.Reg(25, -3, 5).Weight().fill(x1)
h_bkg2 = hist.new.Reg(25, -3, 5).Weight().fill(x2)
h_signal = hist.new.Reg(25, -3, 5).Weight().fill(x3)
h_data = hist.new.Reg(25, -3, 5).Weight().fill(data_x)

# Create comparison plot
fig, ax_main, ax_comparison = mh.comp.data_model(
 data_hist=h_data,
 stacked_components=[h_bkg2, h_bkg1, h_signal],
 stacked_labels=['Bkg2', 'Bkg1', 'Signal'],
 xlabel='Observable [GeV]',
 ylabel='Events',
 plot_only='ax_main' # Only plot the comparison axis (works with 'ax_comparison' as well).
)
mh.alice.label(data=True, lumi=100, ax=ax_main)
mh.mpl_magic(soft_fail=True)
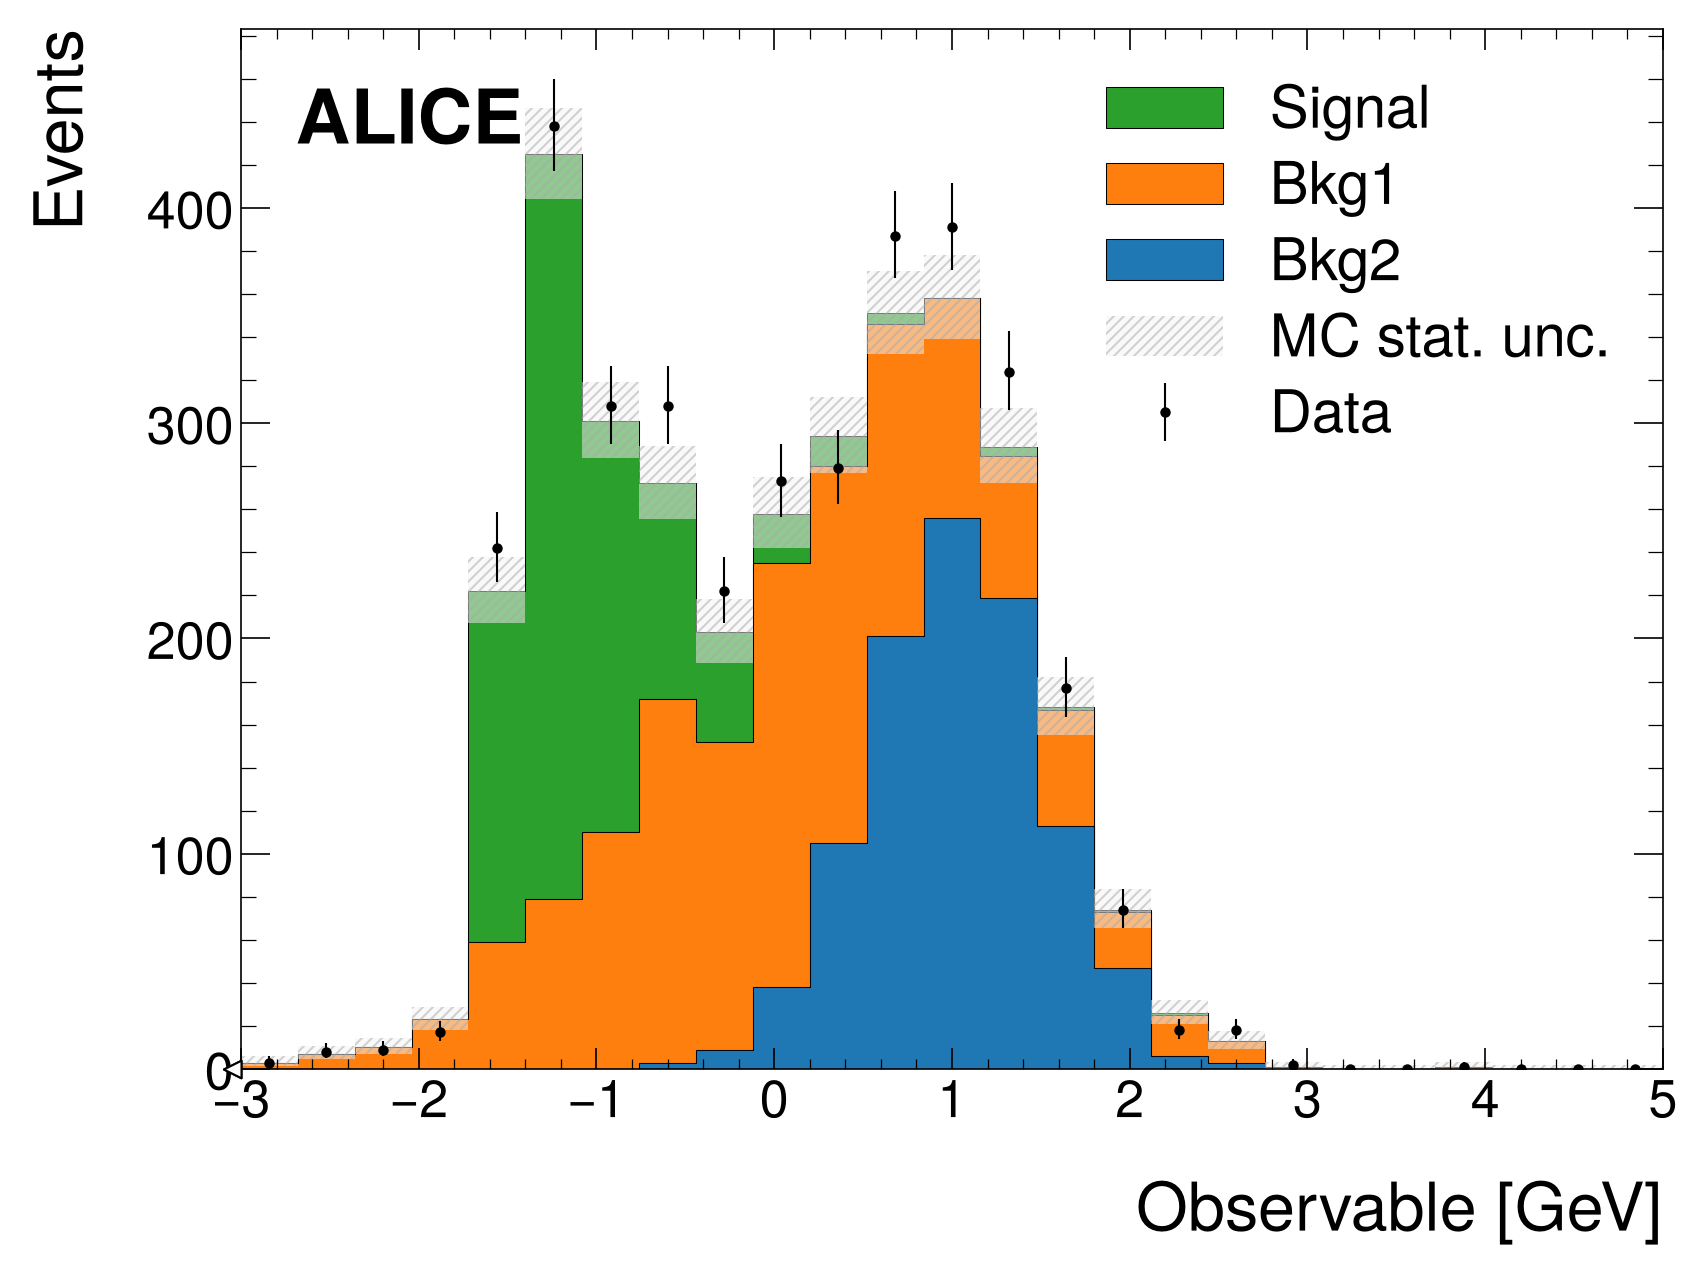
# Generate signal, backgrounds, and data
x1 = np.random.normal(0, 1, 1400)
x2 = np.random.normal(1, 0.5, 1000)
x3 = np.random.exponential(0.5, 900) - 1.5
data_x = np.random.choice([*x1, *x2, *x3], size=3500, replace=True)
h_bkg1 = hist.new.Reg(25, -3, 5).Weight().fill(x1)
h_bkg2 = hist.new.Reg(25, -3, 5).Weight().fill(x2)
h_signal = hist.new.Reg(25, -3, 5).Weight().fill(x3)
h_data = hist.new.Reg(25, -3, 5).Weight().fill(data_x)

# Create comparison plot
fig, ax_main, ax_comp = mh.comp.data_model(
 data_hist=h_data,
 stacked_components=[h_bkg2, h_bkg1, h_signal],
 stacked_labels=['Bkg2', 'Bkg1', 'Signal'],
 xlabel='Observable [GeV]',
 ylabel='Events',
 comparison='pull' # Accept any comparison from mh.comp.comparison()
)
mh.dune.label(data=True, lumi=100, ax=ax_main)
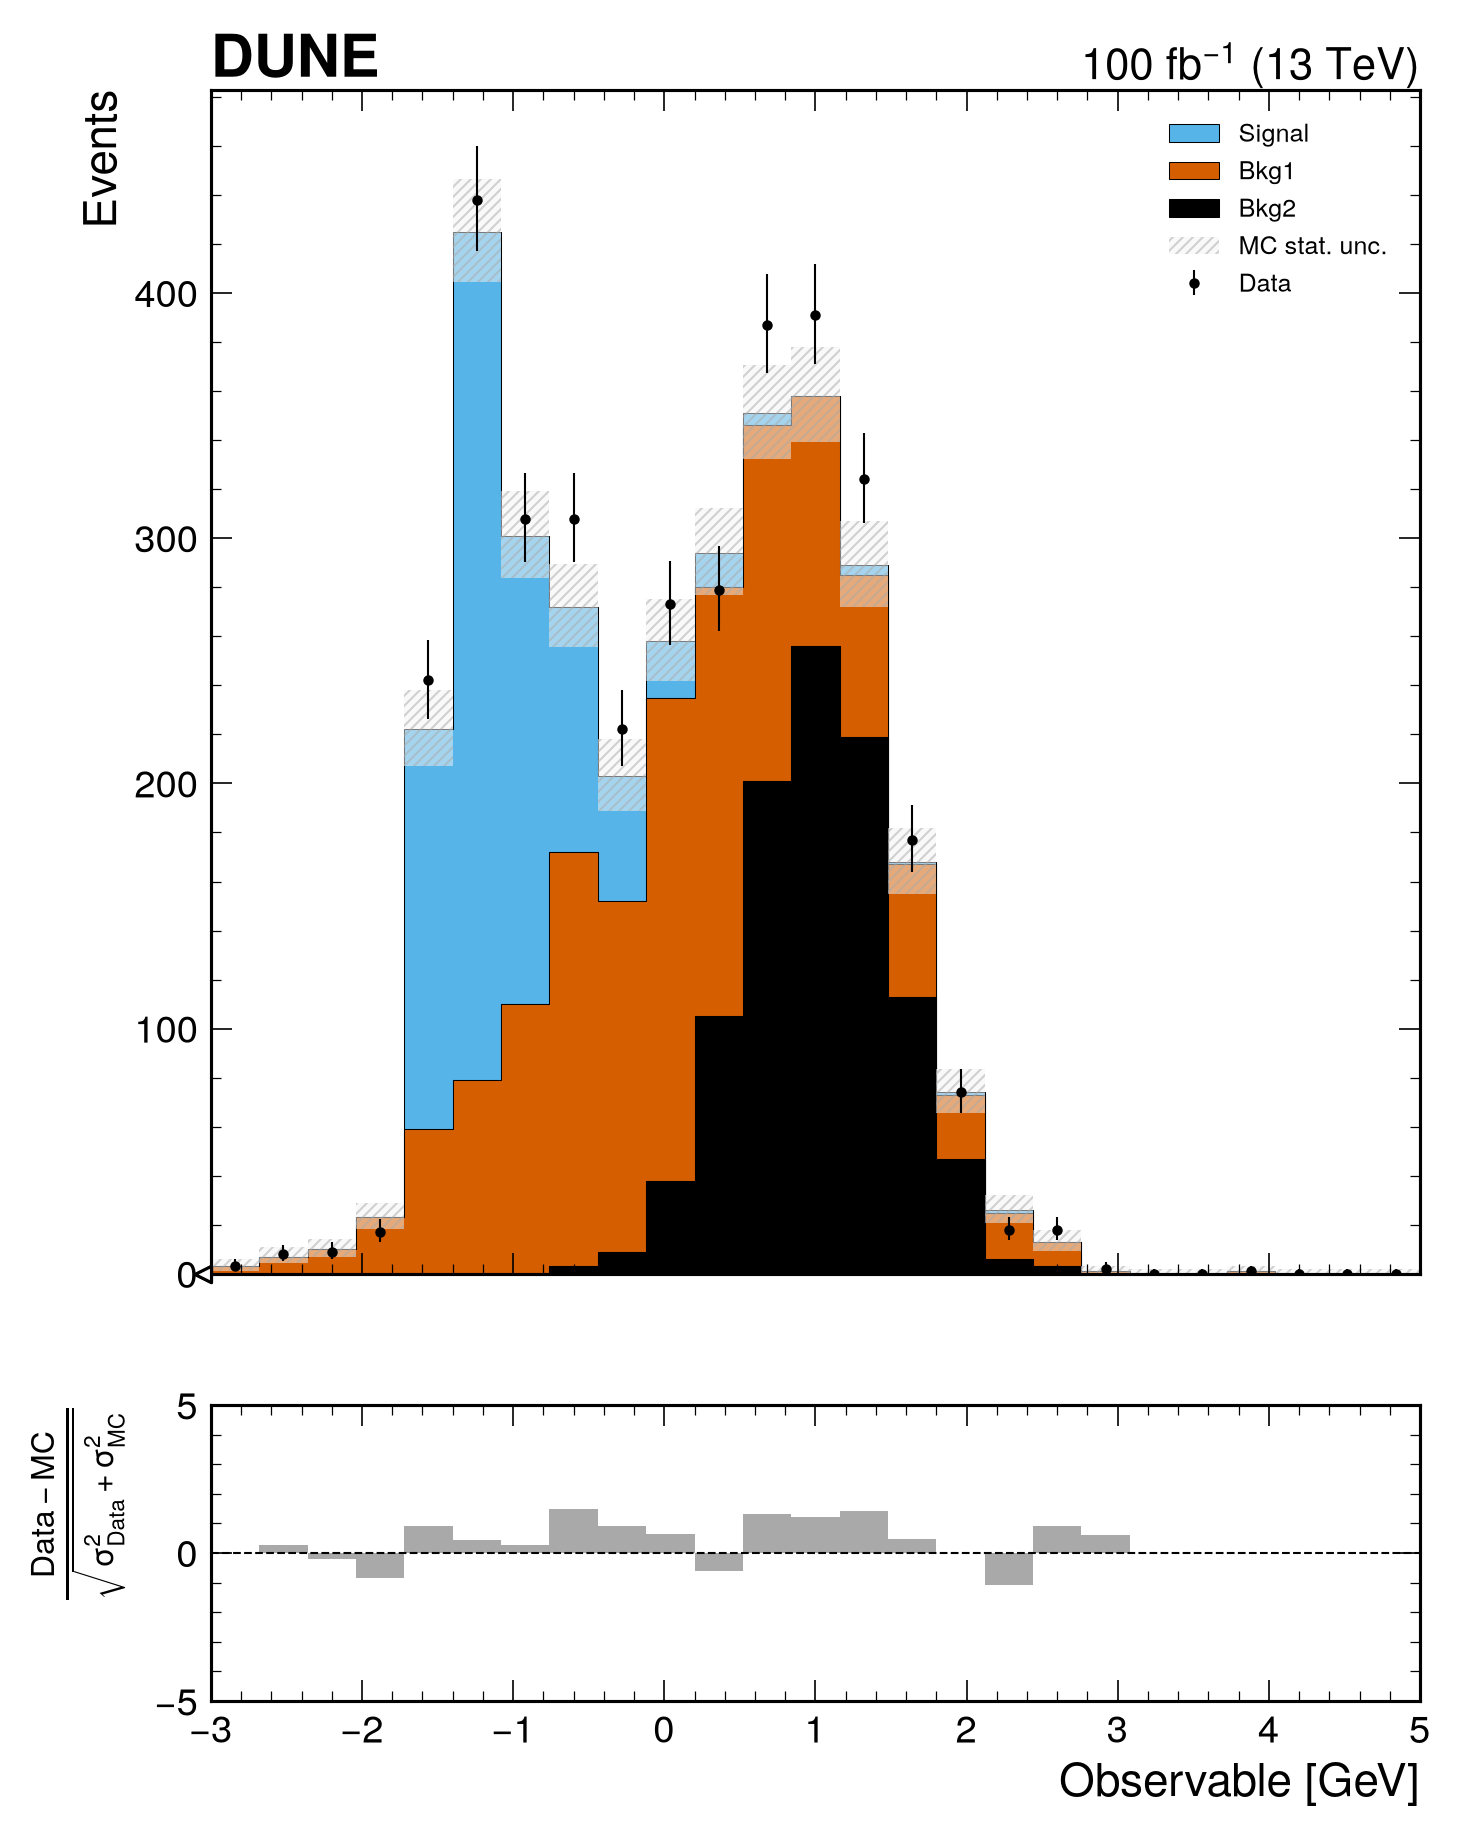
# Generate signal, backgrounds, and data
x1 = np.random.normal(0, 1, 1400)
x2 = np.random.normal(1, 0.5, 1000)
x3 = np.random.exponential(0.5, 900) - 1.5
data_x = np.random.choice([*x1, *x2, *x3], size=3500, replace=True)
h_bkg1 = hist.new.Reg(25, -3, 5).Weight().fill(x1)
h_bkg2 = hist.new.Reg(25, -3, 5).Weight().fill(x2)
h_signal = hist.new.Reg(25, -3, 5).Weight().fill(x3)
h_data = hist.new.Reg(25, -3, 5).Weight().fill(data_x)

# Create comparison plot
fig, ax_main, ax_comp = mh.comp.data_model(
 data_hist=h_data,
 stacked_components=[h_bkg2, h_bkg1, h_signal],
 stacked_labels=['Bkg2', 'Bkg1', 'Signal'],
 xlabel='Observable [GeV]',
 ylabel='Events',
 model_uncertainty=False, # Set the model uncertainty to zero
 comparison='pull', # The pull formula is updated automatically
)
mh.dune.label(data=True, lumi=100, ax=ax_main)
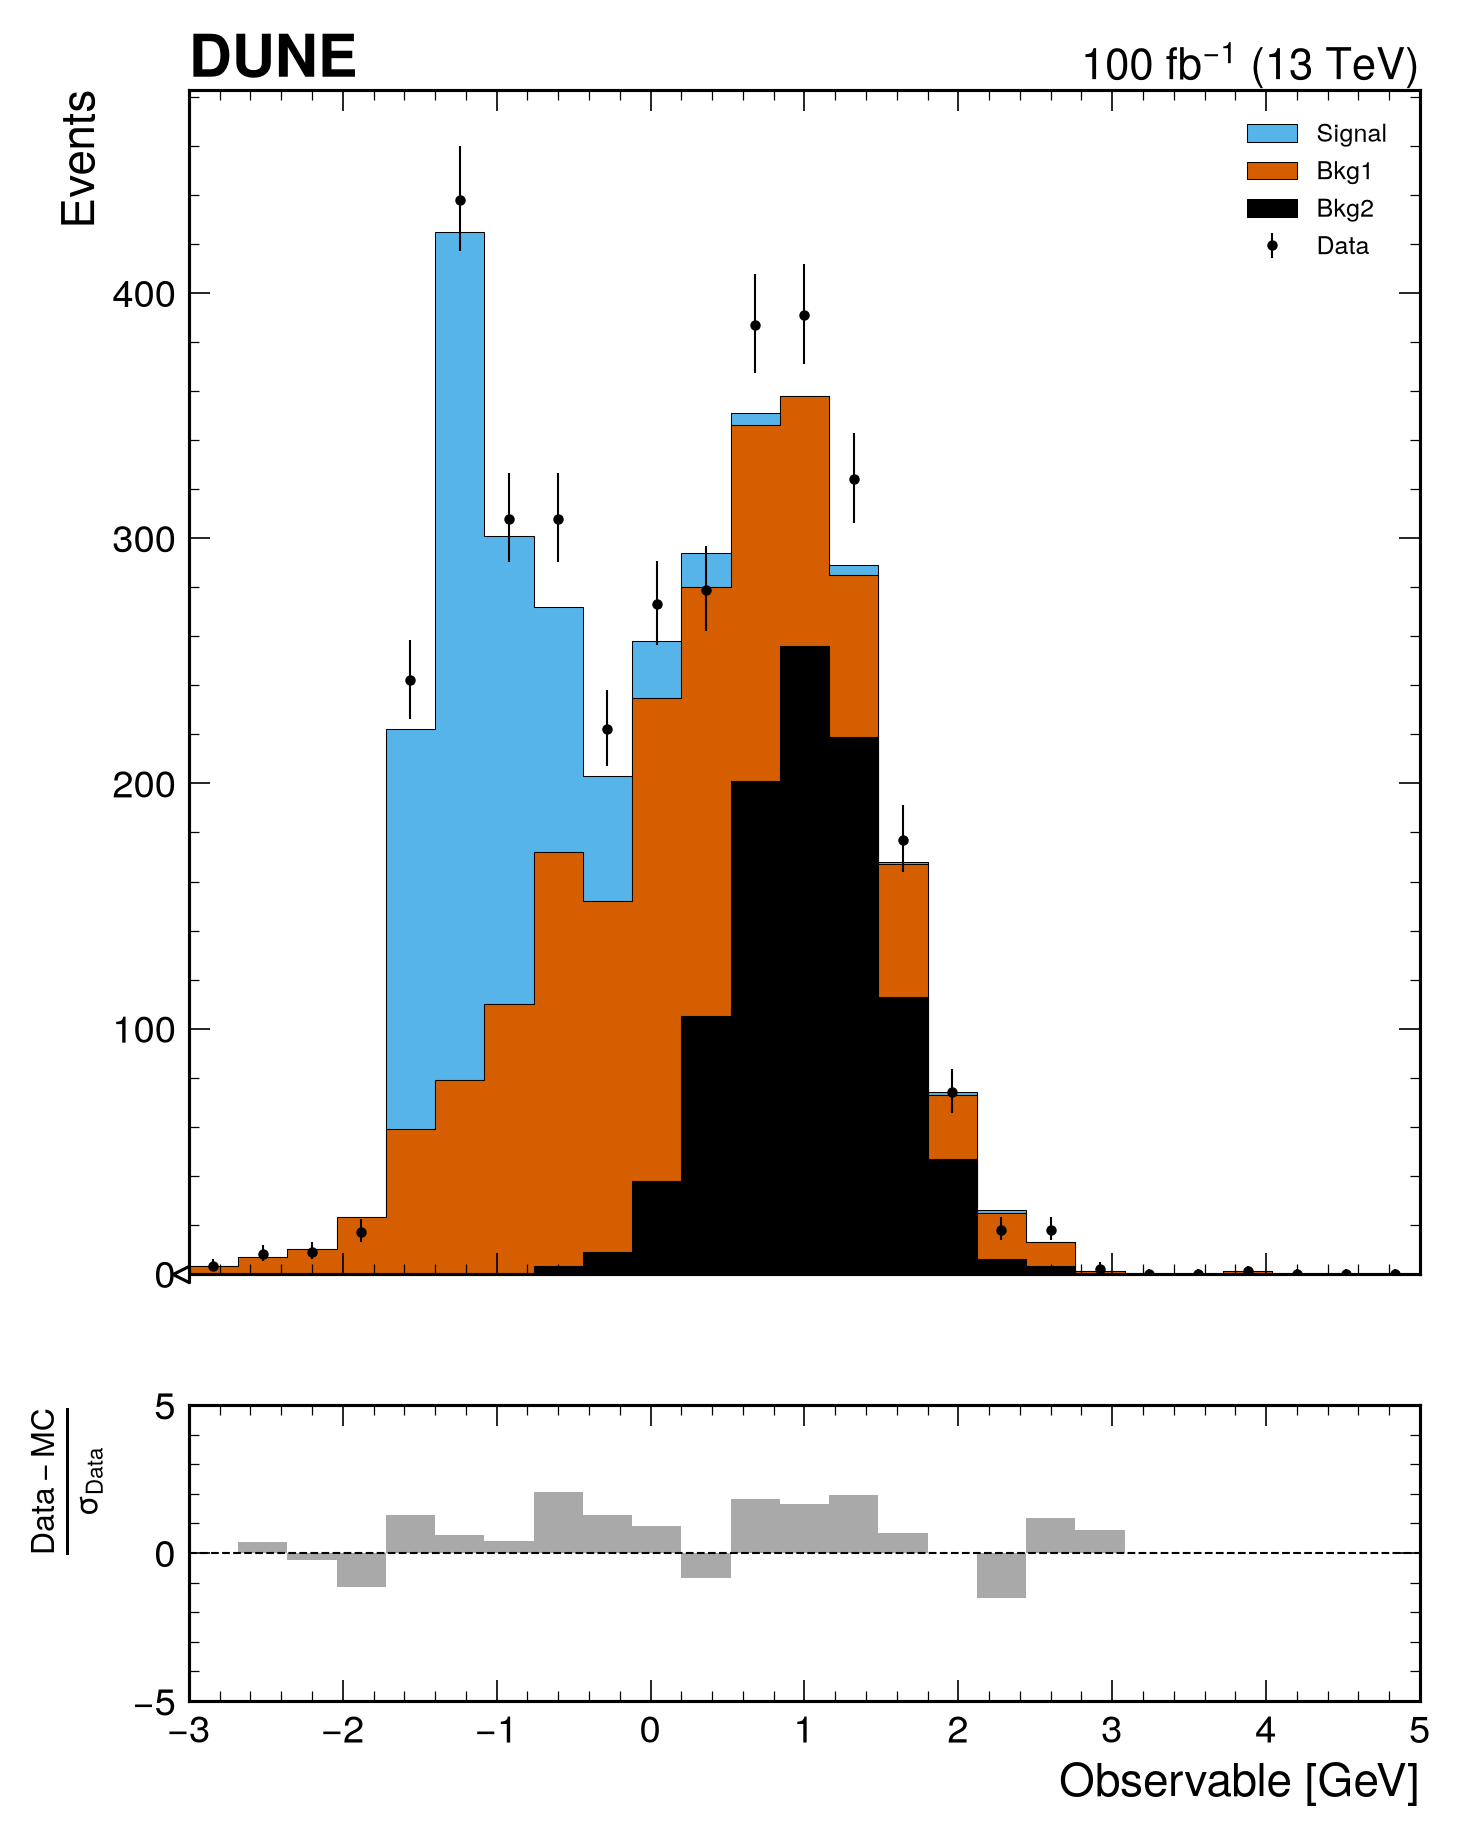
# Generate signal, backgrounds, and data
x1 = np.random.normal(0, 1, 1400)
x2 = np.random.normal(1, 0.5, 1000)
x3 = np.random.exponential(0.5, 900) - 1.5
data_x = np.random.choice([*x1, *x2, *x3], size=3500, replace=True)
h_bkg1 = hist.new.Reg(25, -3, 5).Weight().fill(x1)
h_bkg2 = hist.new.Reg(25, -3, 5).Weight().fill(x2)
h_signal = hist.new.Reg(25, -3, 5).Weight().fill(x3)
h_data = hist.new.Reg(25, -3, 5).Weight().fill(data_x)

# Create comparison plot
fig, ax_main, ax_comp = mh.comp.data_model(
 data_hist=h_data,
 stacked_components=[h_bkg2, h_bkg1],
 stacked_labels=['Bkg2', 'Bkg1'],
 stacked_colors=['grey', 'lightblue'],
 unstacked_components=[h_signal],
 unstacked_labels=['Signal'],
 unstacked_colors=['red'],
 model_sum_kwargs={"show": True, "label": "Total Model", "color": "violet"}, # Just like stacked_components_kwargs and unstacked_components_kwargs, you can pass kwargs for the model sum line
 xlabel='Observable [GeV]',
 ylabel='Events'
)
mh.dune.label(data=True, lumi=100, ax=ax_main)
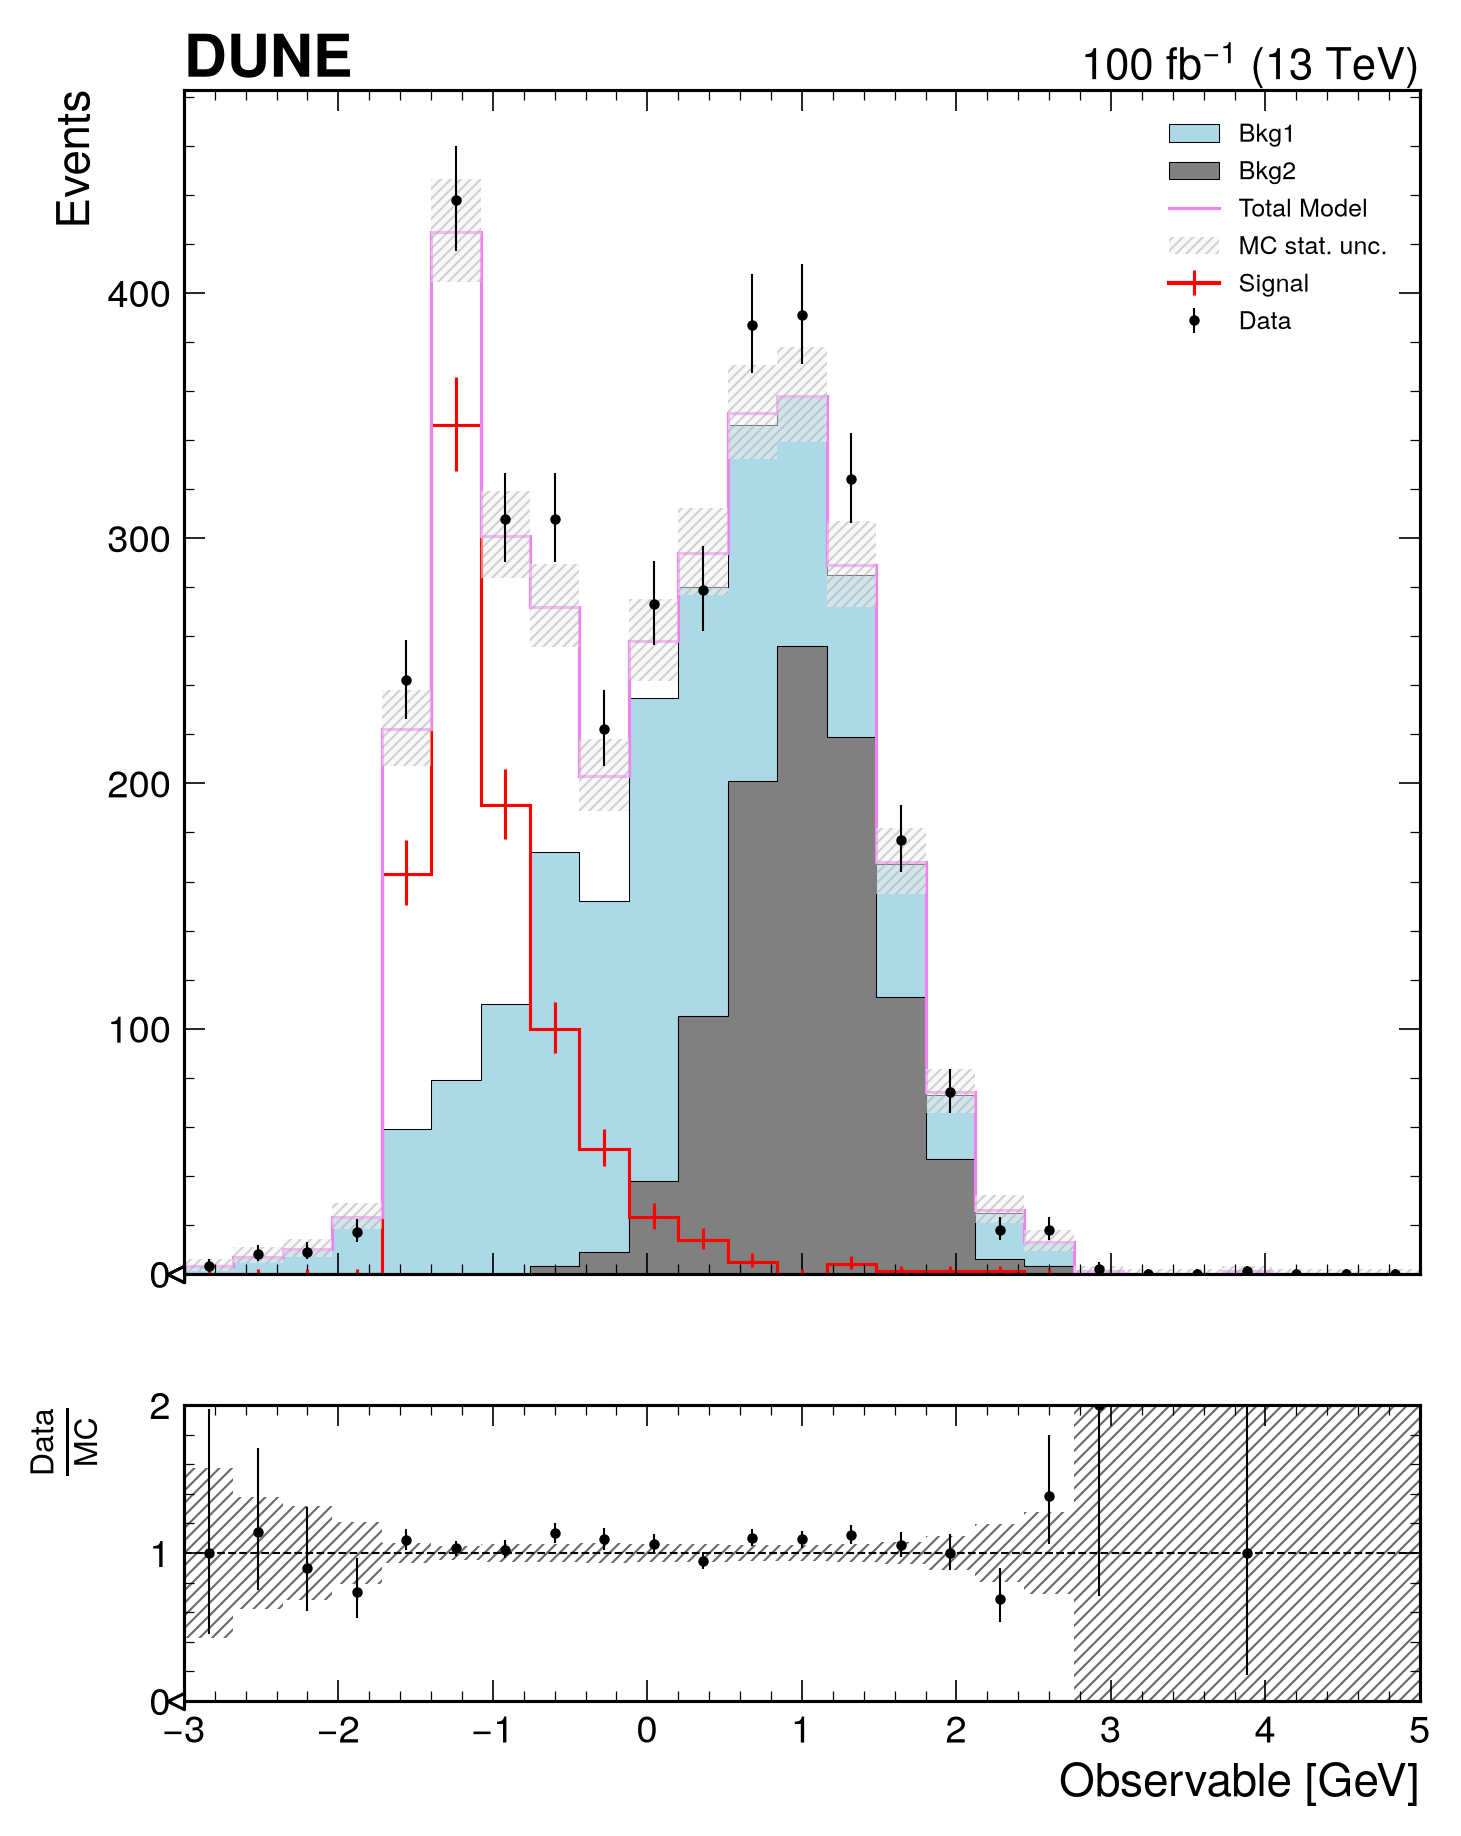
# Generate signal, backgrounds, and data
x1 = np.random.normal(0, 1, 1400)
x2 = np.random.normal(1, 0.5, 1000)
x3 = np.random.exponential(0.5, 900) - 1.5
data_x = np.random.choice([*x1, *x2, *x3], size=3500, replace=True)
h_bkg1 = hist.new.Reg(25, -3, 5).Weight().fill(x1)
h_bkg2 = hist.new.Reg(25, -3, 5).Weight().fill(x2)
h_signal = hist.new.Reg(25, -3, 5).Weight().fill(x3)
h_data = hist.new.Reg(25, -3, 5).Weight().fill(data_x)

# Create comparison plot
fig, ax_main, ax_comparison = mh.comp.data_model(
 data_hist=h_data,
 stacked_components=[h_bkg2, h_bkg1, h_signal],
 stacked_labels=['Bkg2', 'Bkg1', 'Signal'],
 xlabel='Observable [GeV]',
 ylabel='Events',
 plot_only='ax_main' # Only plot the comparison axis (works with 'ax_comparison' as well).
)
mh.dune.label(data=True, lumi=100, ax=ax_main)
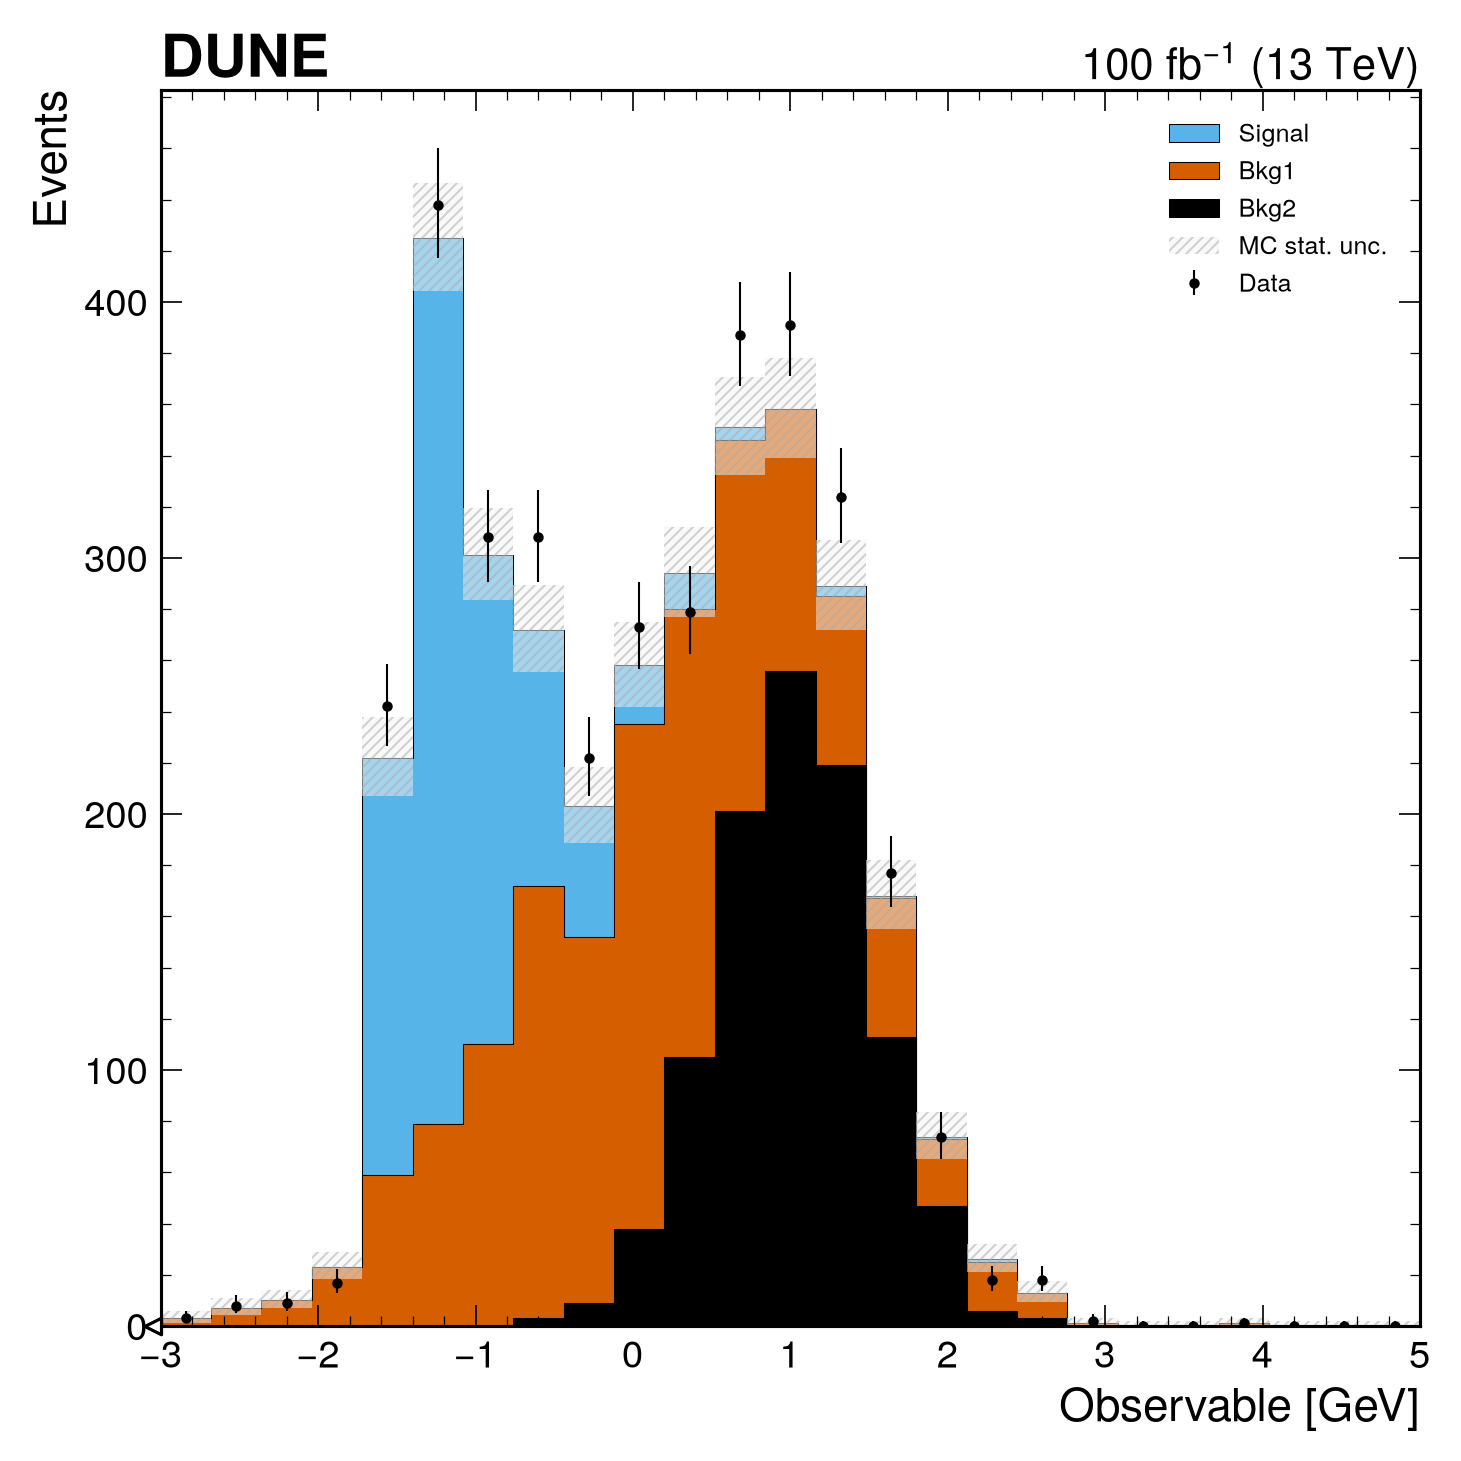
Blinding in Comparisons¤
The blind parameter is available in comparison functions (mh.comp.hists(), mh.comp.data_model()) to hide specific regions in both the main plot and the comparison panel. This is particularly useful for blind analyses where signal regions should remain hidden until the analysis is finalized.
For detailed information about blinding syntax and options, see the Blinding section in the Basic Plotting guide.
Blinding Two-Histogram Comparisons¤
Use blind with mh.comp.hists():
# Generate sample data
x1 = np.random.normal(0, 1, 1000)
x2 = np.random.normal(0, 1.05, 1000)
h1 = hist.new.Reg(25, -4, 4).Weight().fill(x1)
h2 = hist.new.Reg(25, -4, 4).Weight().fill(x2)

# Create comparison plot with blinded signal region
fig, ax_main, ax_comp = mh.comp.hists(
 h1,
 h2,
 blind=(-1.0, 1.0), # Blind the region from -1 to 1 GeV
 comparison='ratio',
 xlabel='Observable [GeV]',
 ylabel='Events',
 h1_label='Data',
 h2_label='MC'
)
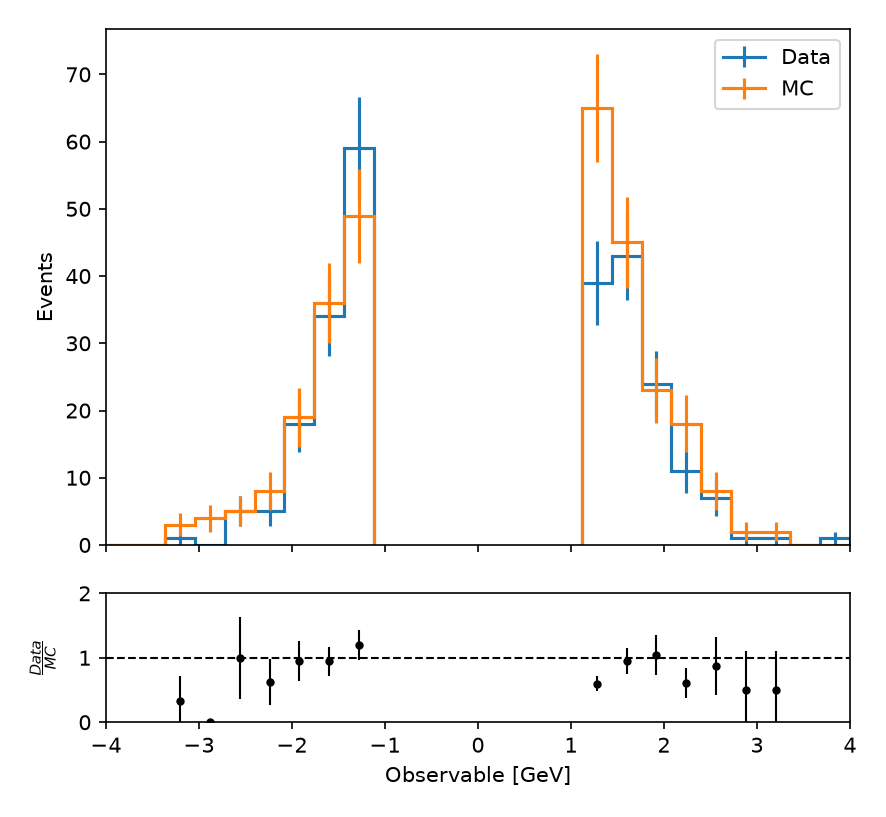
# Generate sample data
x1 = np.random.normal(0, 1, 1000)
x2 = np.random.normal(0, 1.05, 1000)
h1 = hist.new.Reg(25, -4, 4).Weight().fill(x1)
h2 = hist.new.Reg(25, -4, 4).Weight().fill(x2)

# Create comparison plot with blinded signal region
fig, ax_main, ax_comp = mh.comp.hists(
 h1,
 h2,
 blind=(-1.0, 1.0), # Blind the region from -1 to 1 GeV
 comparison='ratio',
 xlabel='Observable [GeV]',
 ylabel='Events',
 h1_label='Data',
 h2_label='MC'
)
txt_obj = mh.add_text('plothist', loc='over left', ax=ax_main)
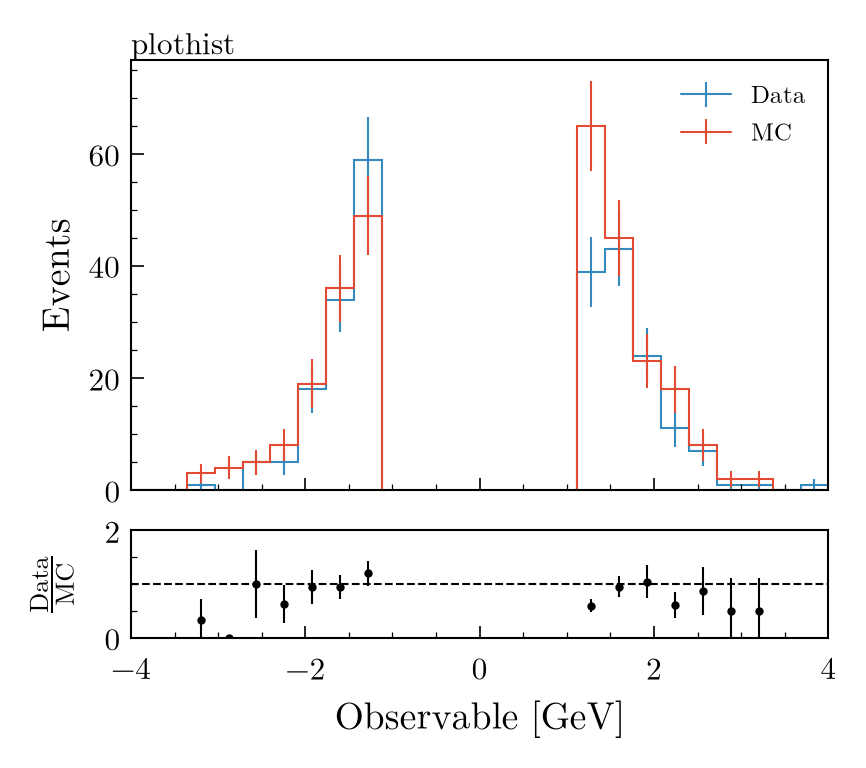
# Generate sample data
x1 = np.random.normal(0, 1, 1000)
x2 = np.random.normal(0, 1.05, 1000)
h1 = hist.new.Reg(25, -4, 4).Weight().fill(x1)
h2 = hist.new.Reg(25, -4, 4).Weight().fill(x2)

# Create comparison plot with blinded signal region
fig, ax_main, ax_comp = mh.comp.hists(
 h1,
 h2,
 blind=(-1.0, 1.0), # Blind the region from -1 to 1 GeV
 comparison='ratio',
 xlabel='Observable [GeV]',
 ylabel='Events',
 h1_label='Data',
 h2_label='MC'
)
mh.cms.label(data=True, ax=ax_main)
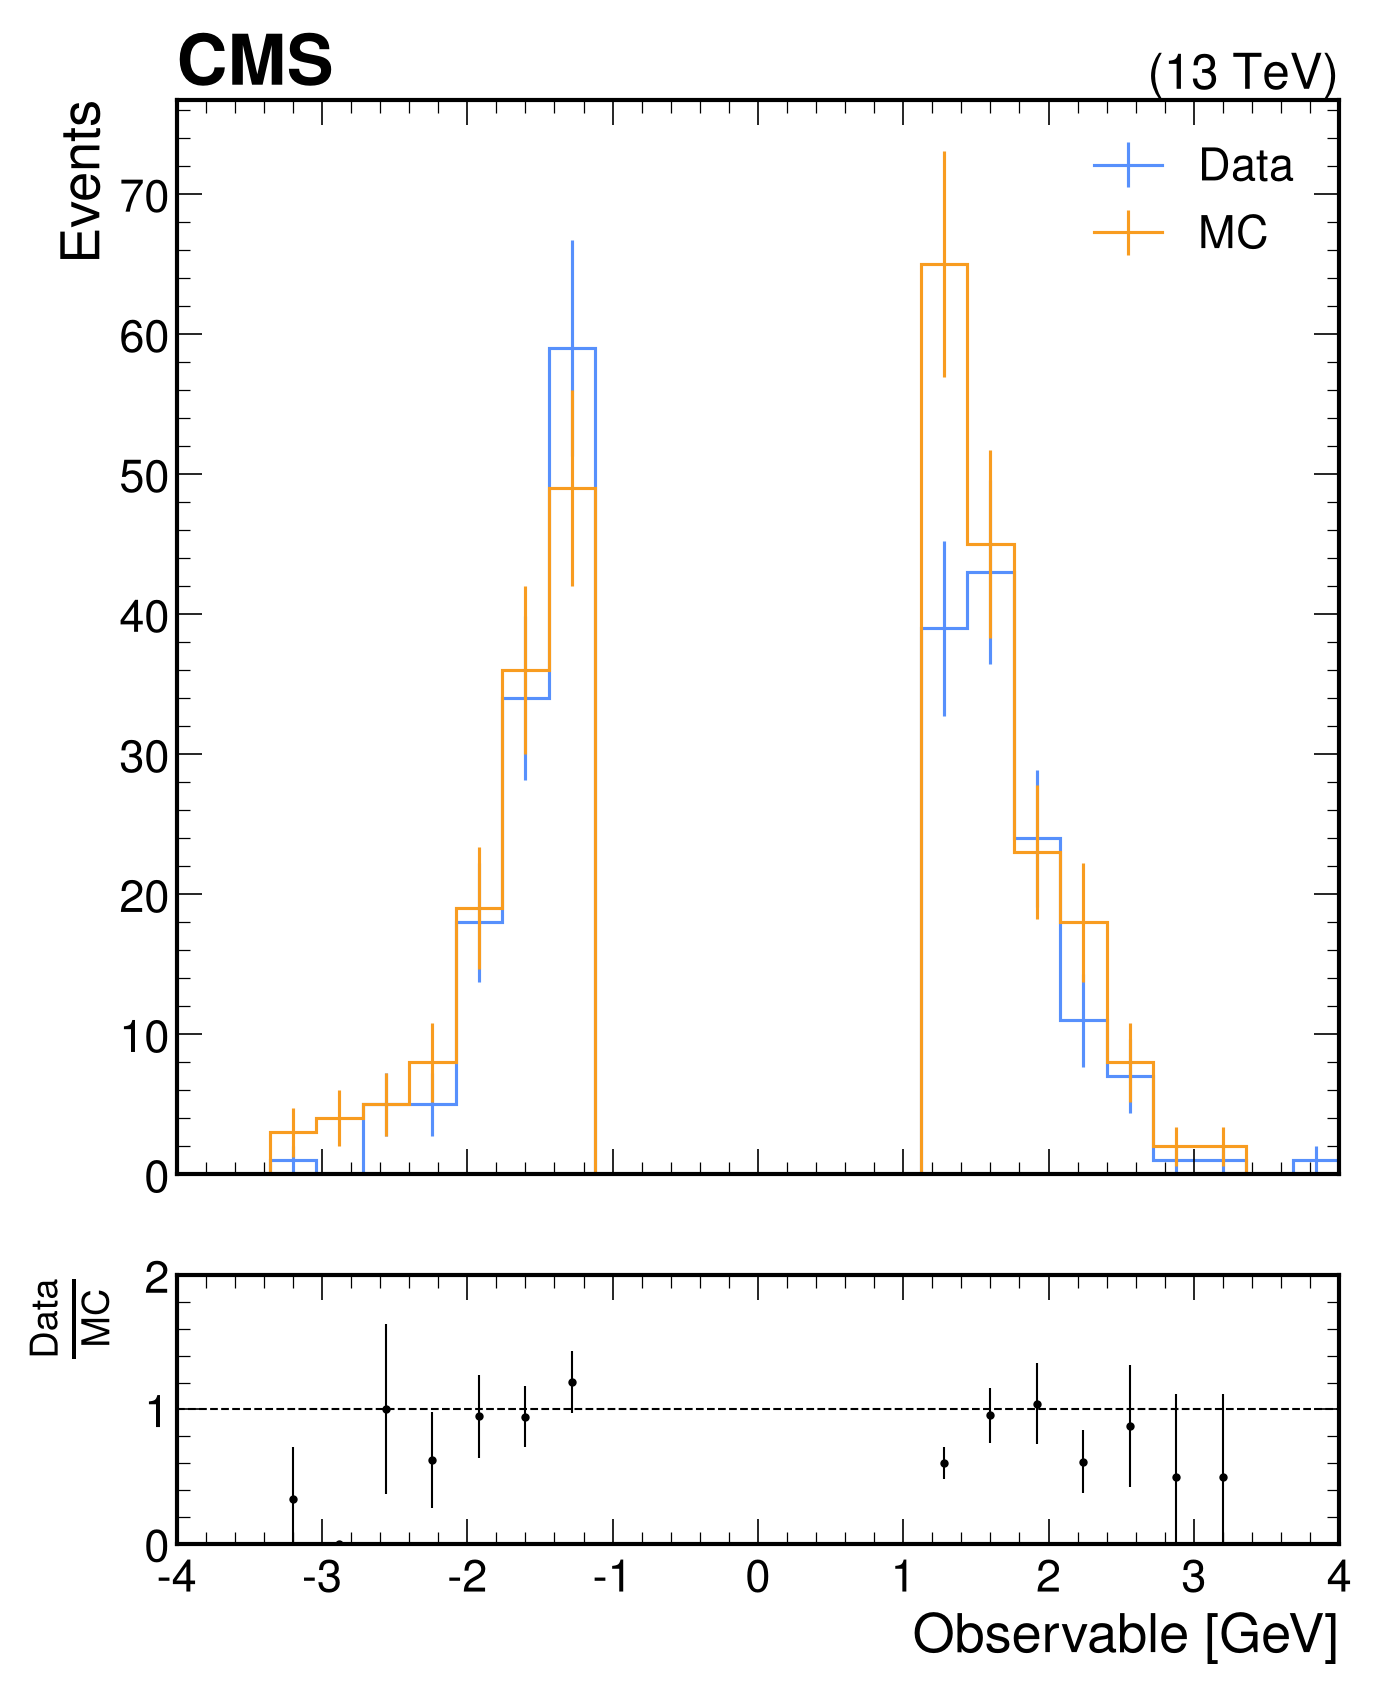
# Generate sample data
x1 = np.random.normal(0, 1, 1000)
x2 = np.random.normal(0, 1.05, 1000)
h1 = hist.new.Reg(25, -4, 4).Weight().fill(x1)
h2 = hist.new.Reg(25, -4, 4).Weight().fill(x2)

# Create comparison plot with blinded signal region
fig, ax_main, ax_comp = mh.comp.hists(
 h1,
 h2,
 blind=(-1.0, 1.0), # Blind the region from -1 to 1 GeV
 comparison='ratio',
 xlabel='Observable [GeV]',
 ylabel='Events',
 h1_label='Data',
 h2_label='MC'
)
mh.atlas.label(data=True, ax=ax_main)
mh.mpl_magic(soft_fail=True)
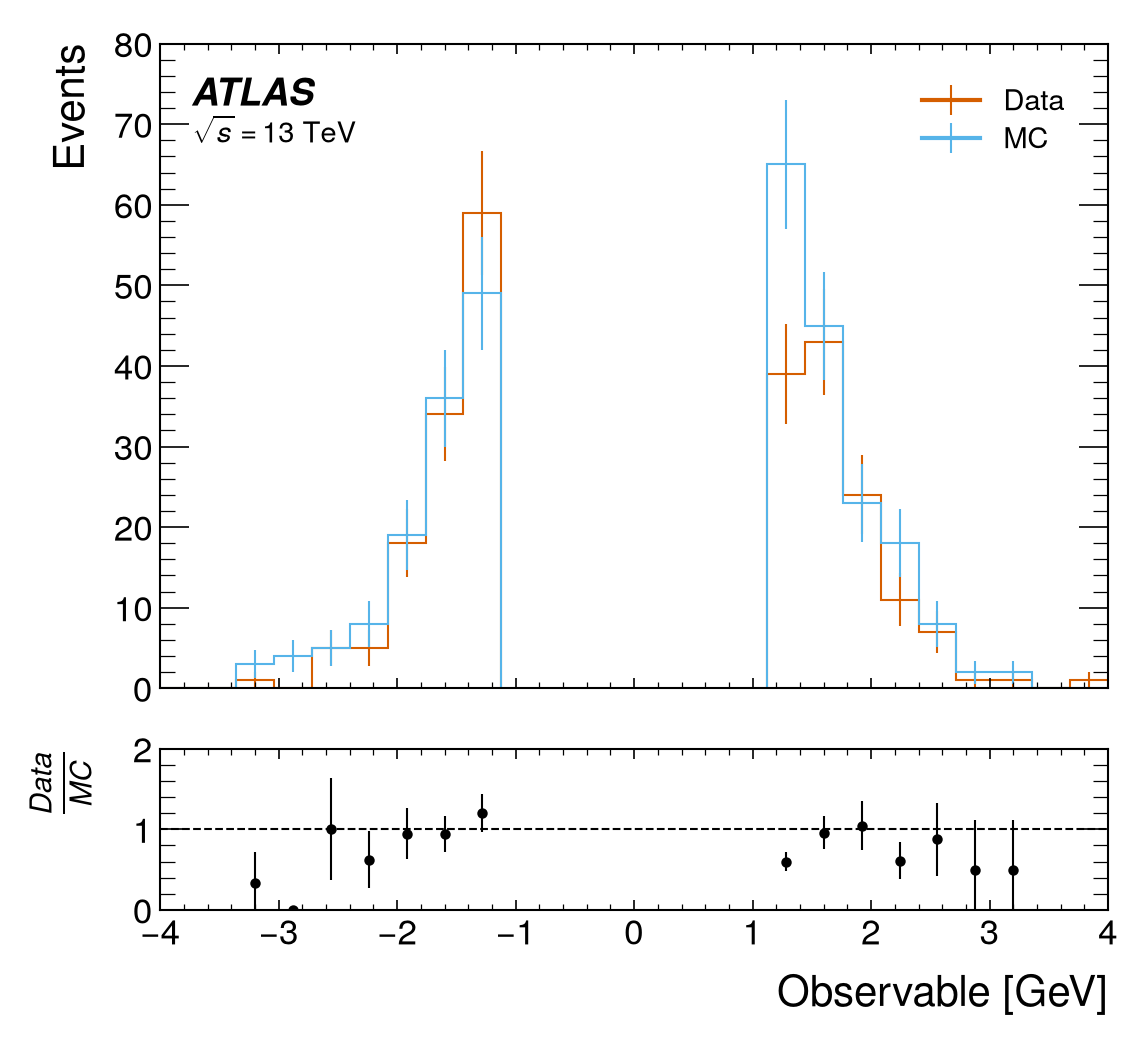
# Generate sample data
x1 = np.random.normal(0, 1, 1000)
x2 = np.random.normal(0, 1.05, 1000)
h1 = hist.new.Reg(25, -4, 4).Weight().fill(x1)
h2 = hist.new.Reg(25, -4, 4).Weight().fill(x2)

# Create comparison plot with blinded signal region
fig, ax_main, ax_comp = mh.comp.hists(
 h1,
 h2,
 blind=(-1.0, 1.0), # Blind the region from -1 to 1 GeV
 comparison='ratio',
 xlabel='Observable [GeV]',
 ylabel='Events',
 h1_label='Data',
 h2_label='MC'
)
mh.lhcb.label(data=True, ax=ax_main)
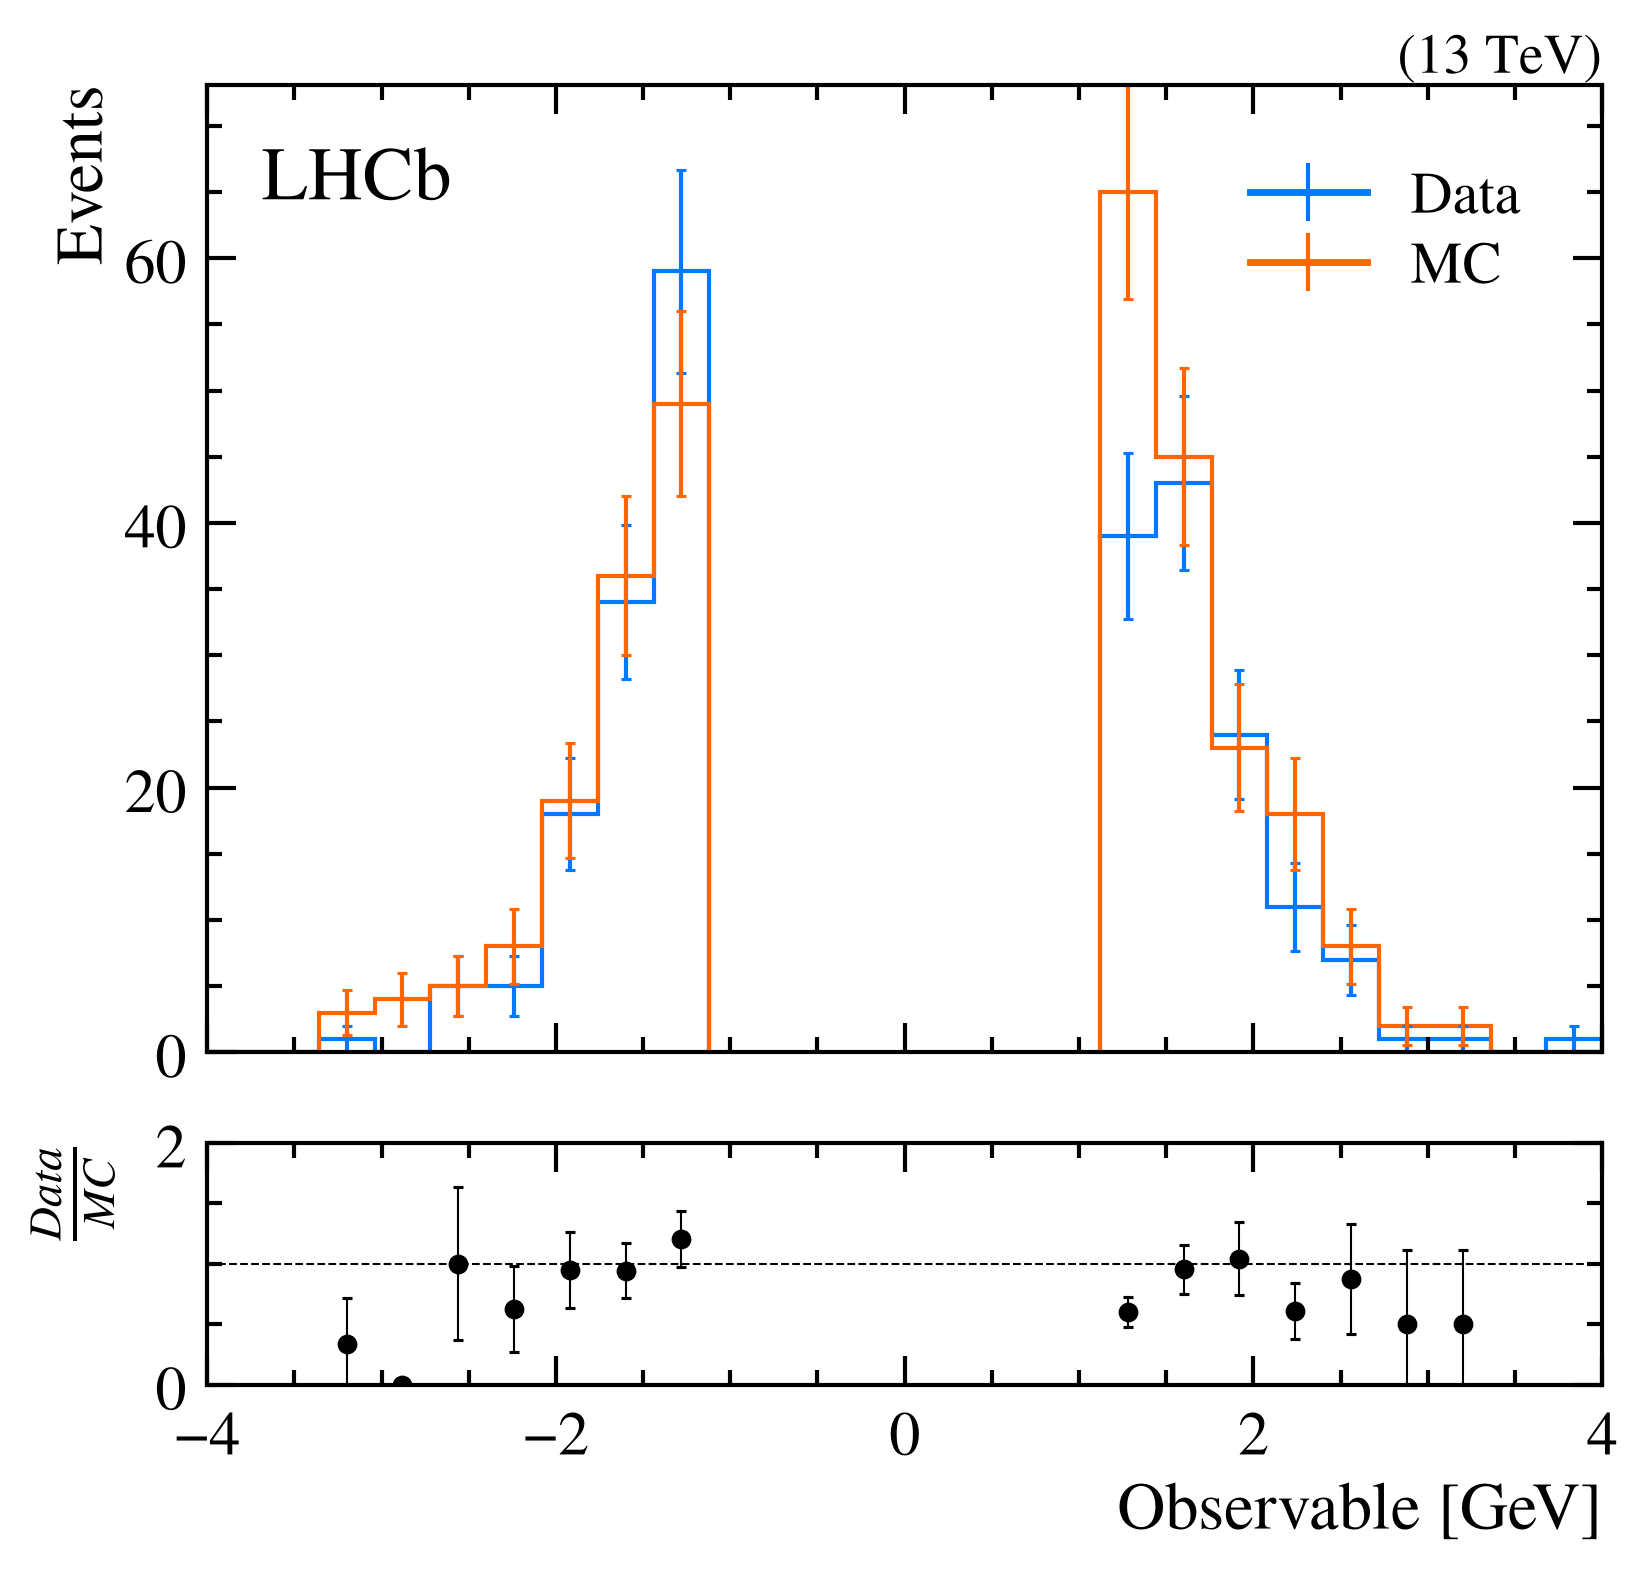
# Generate sample data
x1 = np.random.normal(0, 1, 1000)
x2 = np.random.normal(0, 1.05, 1000)
h1 = hist.new.Reg(25, -4, 4).Weight().fill(x1)
h2 = hist.new.Reg(25, -4, 4).Weight().fill(x2)

# Create comparison plot with blinded signal region
fig, ax_main, ax_comp = mh.comp.hists(
 h1,
 h2,
 blind=(-1.0, 1.0), # Blind the region from -1 to 1 GeV
 comparison='ratio',
 xlabel='Observable [GeV]',
 ylabel='Events',
 h1_label='Data',
 h2_label='MC'
)
mh.alice.label(data=True, ax=ax_main)
mh.mpl_magic(soft_fail=True)
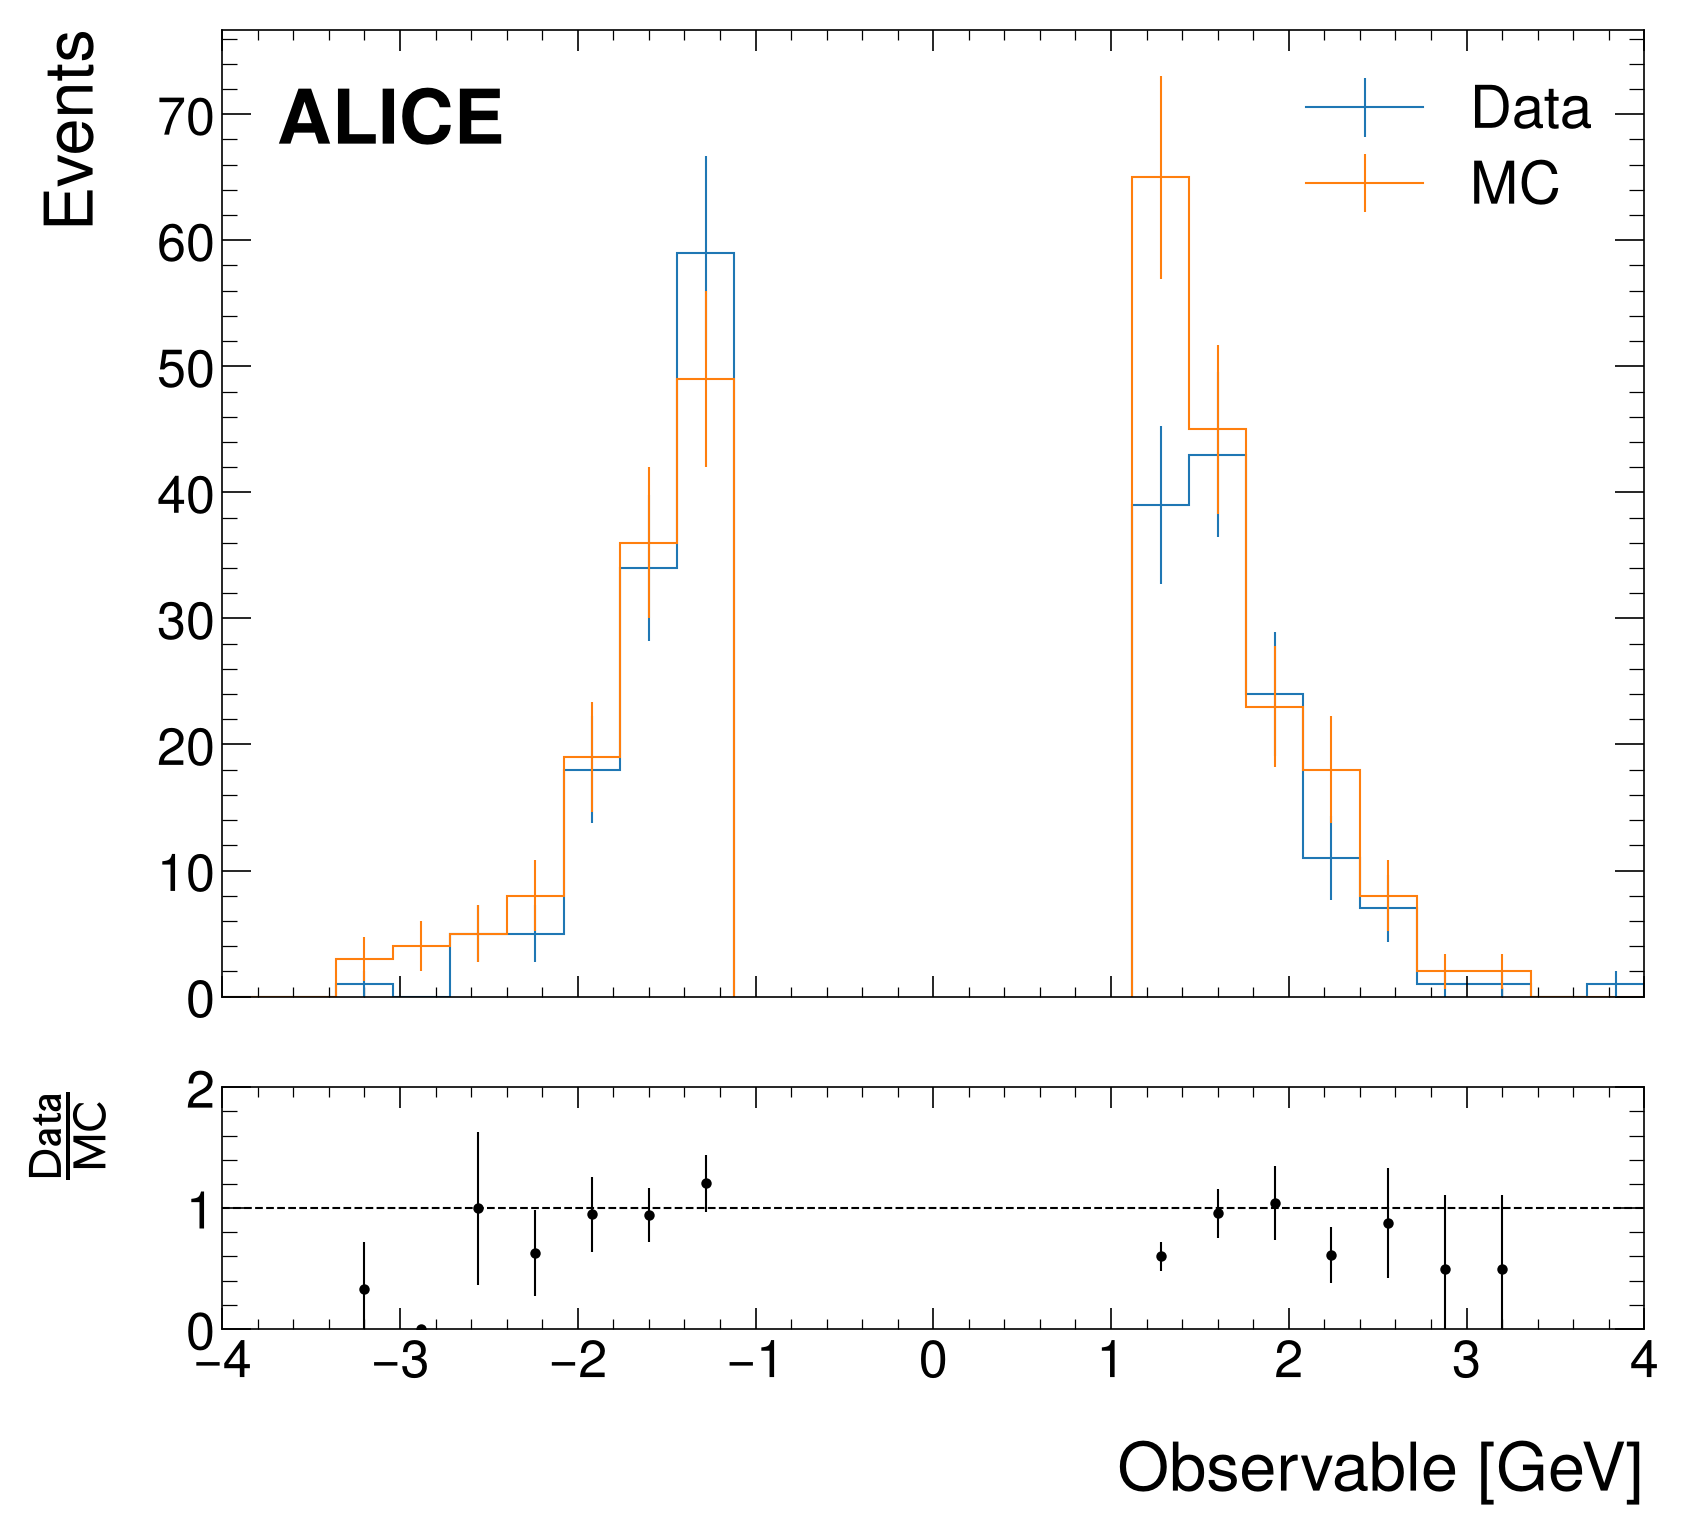
# Generate sample data
x1 = np.random.normal(0, 1, 1000)
x2 = np.random.normal(0, 1.05, 1000)
h1 = hist.new.Reg(25, -4, 4).Weight().fill(x1)
h2 = hist.new.Reg(25, -4, 4).Weight().fill(x2)

# Create comparison plot with blinded signal region
fig, ax_main, ax_comp = mh.comp.hists(
 h1,
 h2,
 blind=(-1.0, 1.0), # Blind the region from -1 to 1 GeV
 comparison='ratio',
 xlabel='Observable [GeV]',
 ylabel='Events',
 h1_label='Data',
 h2_label='MC'
)
mh.dune.label(data=True, ax=ax_main)
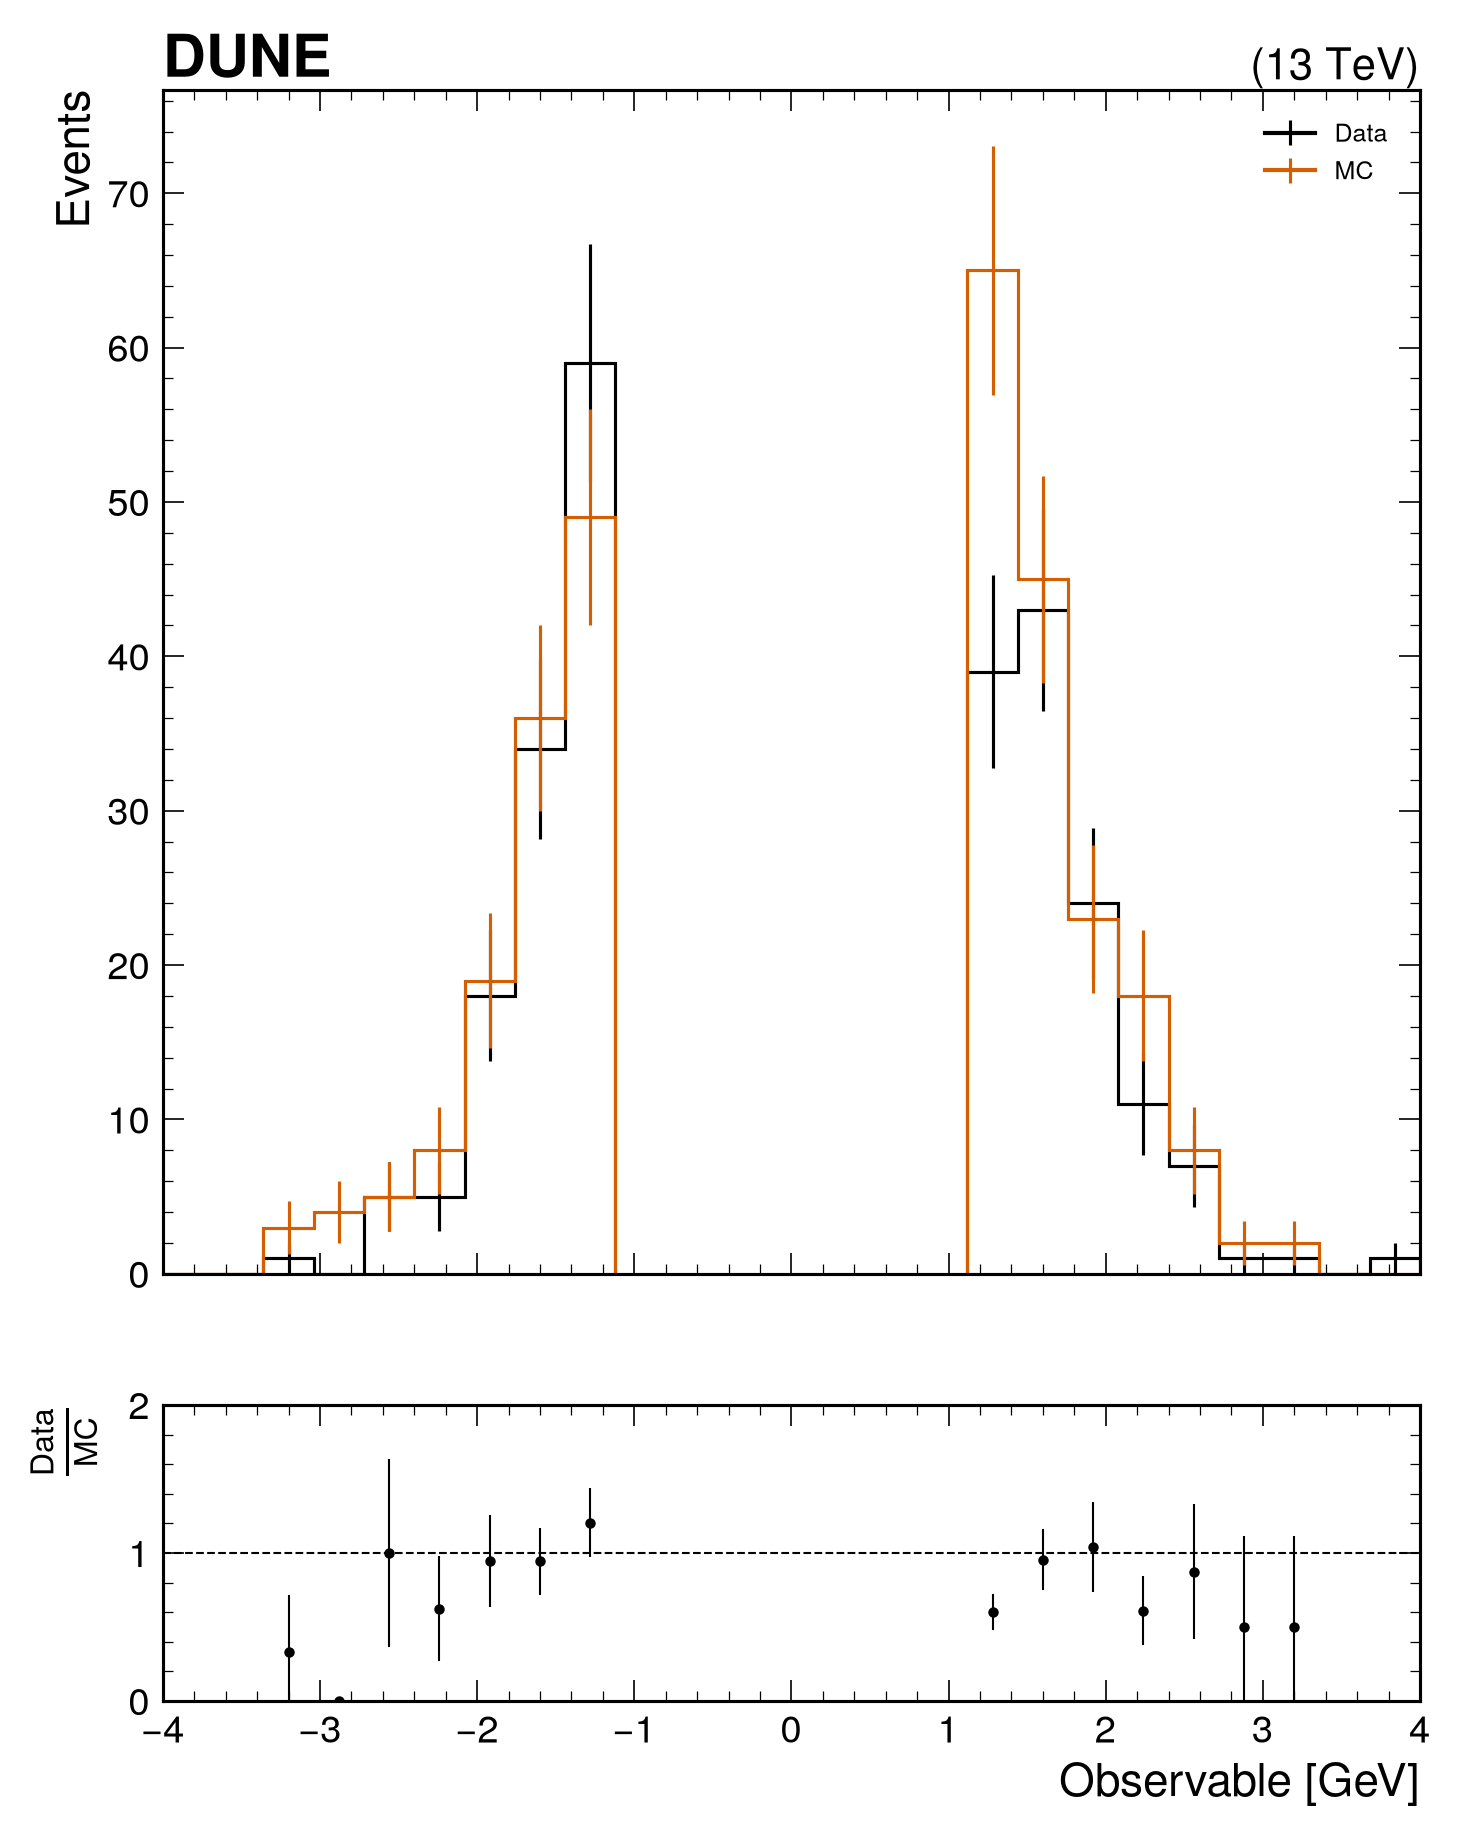
Blinding Data-Model Comparisons¤
Use blind with mh.comp.data_model() to blind signal regions in data-model comparisons:
# Generate sample background and data
bkg1 = np.random.exponential(2.0, 800)
bkg2 = np.random.exponential(1.5, 600)
data = np.concatenate([
 np.random.exponential(2.0, 800),
 np.random.exponential(1.5, 600)
])

# Create histograms
h_bkg1 = hist.new.Reg(30, 0, 10).Weight().fill(bkg1)
h_bkg2 = hist.new.Reg(30, 0, 10).Weight().fill(bkg2)
h_data = hist.new.Reg(30, 0, 10).Weight().fill(data)

# Create comparison plot with blinded region
fig, ax_main, ax_comp = mh.comp.data_model(
 h_data,
 stacked_components=[h_bkg1, h_bkg2],
 stacked_labels=['Background 1', 'Background 2'],
 blind=(2.0, 4.0), # Blind potential signal region
 xlabel='Observable [GeV]',
 ylabel='Events',
 data_label='Data',
 comparison='split_ratio'
)
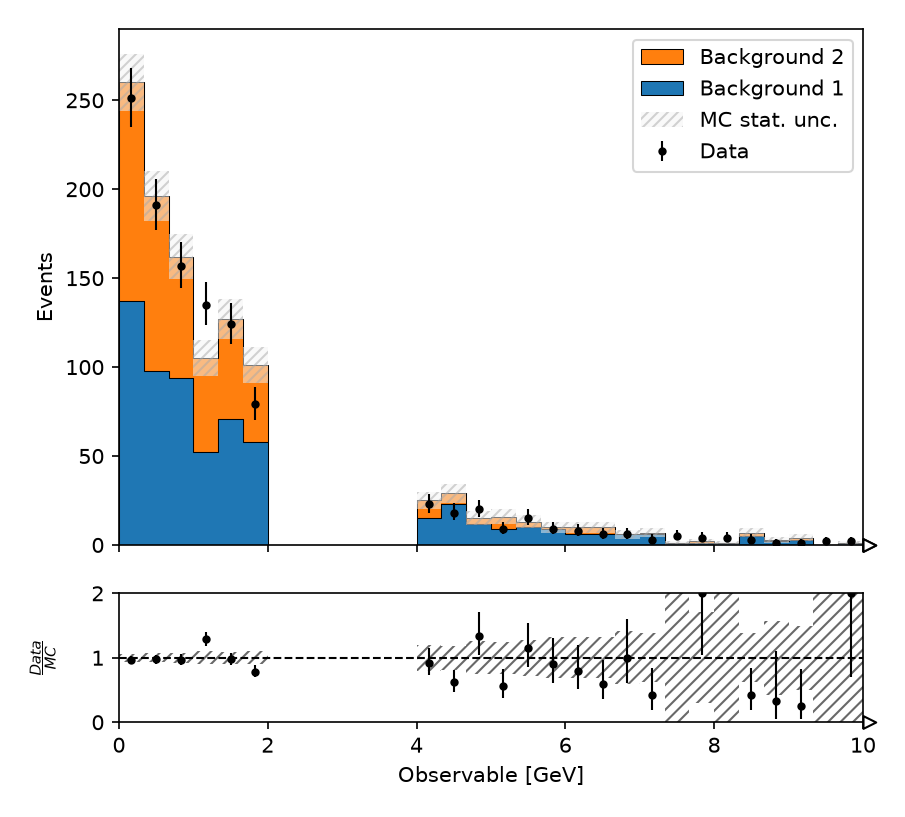
# Generate sample background and data
bkg1 = np.random.exponential(2.0, 800)
bkg2 = np.random.exponential(1.5, 600)
data = np.concatenate([
 np.random.exponential(2.0, 800),
 np.random.exponential(1.5, 600)
])

# Create histograms
h_bkg1 = hist.new.Reg(30, 0, 10).Weight().fill(bkg1)
h_bkg2 = hist.new.Reg(30, 0, 10).Weight().fill(bkg2)
h_data = hist.new.Reg(30, 0, 10).Weight().fill(data)

# Create comparison plot with blinded region
fig, ax_main, ax_comp = mh.comp.data_model(
 h_data,
 stacked_components=[h_bkg1, h_bkg2],
 stacked_labels=['Background 1', 'Background 2'],
 blind=(2.0, 4.0), # Blind potential signal region
 xlabel='Observable [GeV]',
 ylabel='Events',
 data_label='Data',
 comparison='split_ratio'
)
txt_obj = mh.add_text('plothist', loc='over left', ax=ax_main)
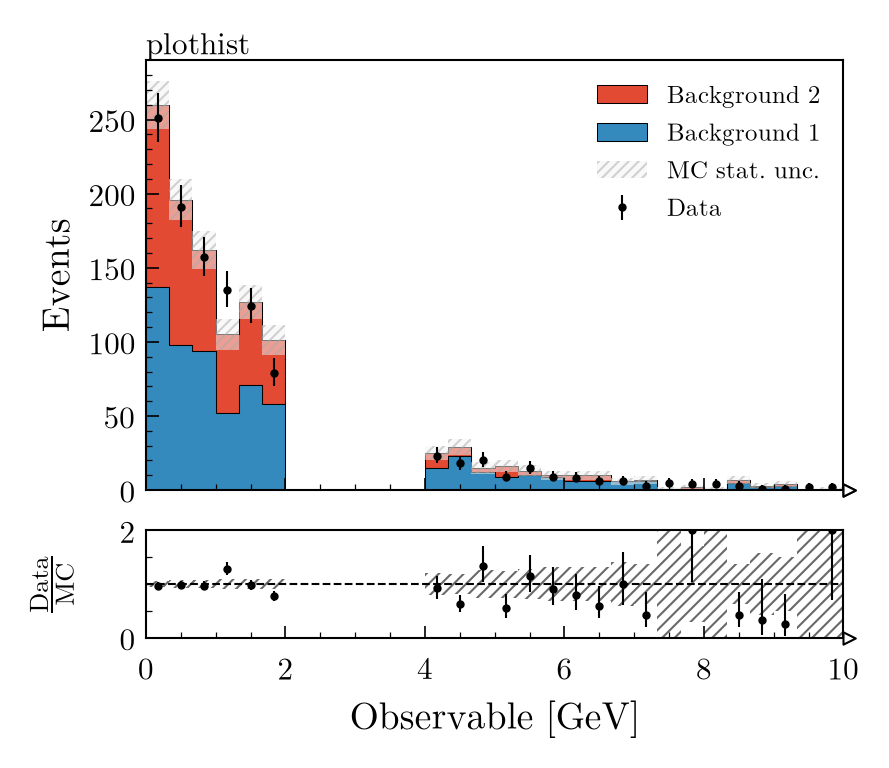
# Generate sample background and data
bkg1 = np.random.exponential(2.0, 800)
bkg2 = np.random.exponential(1.5, 600)
data = np.concatenate([
 np.random.exponential(2.0, 800),
 np.random.exponential(1.5, 600)
])

# Create histograms
h_bkg1 = hist.new.Reg(30, 0, 10).Weight().fill(bkg1)
h_bkg2 = hist.new.Reg(30, 0, 10).Weight().fill(bkg2)
h_data = hist.new.Reg(30, 0, 10).Weight().fill(data)

# Create comparison plot with blinded region
fig, ax_main, ax_comp = mh.comp.data_model(
 h_data,
 stacked_components=[h_bkg1, h_bkg2],
 stacked_labels=['Background 1', 'Background 2'],
 blind=(2.0, 4.0), # Blind potential signal region
 xlabel='Observable [GeV]',
 ylabel='Events',
 data_label='Data',
 comparison='split_ratio'
)
mh.cms.label(data=True, ax=ax_main)
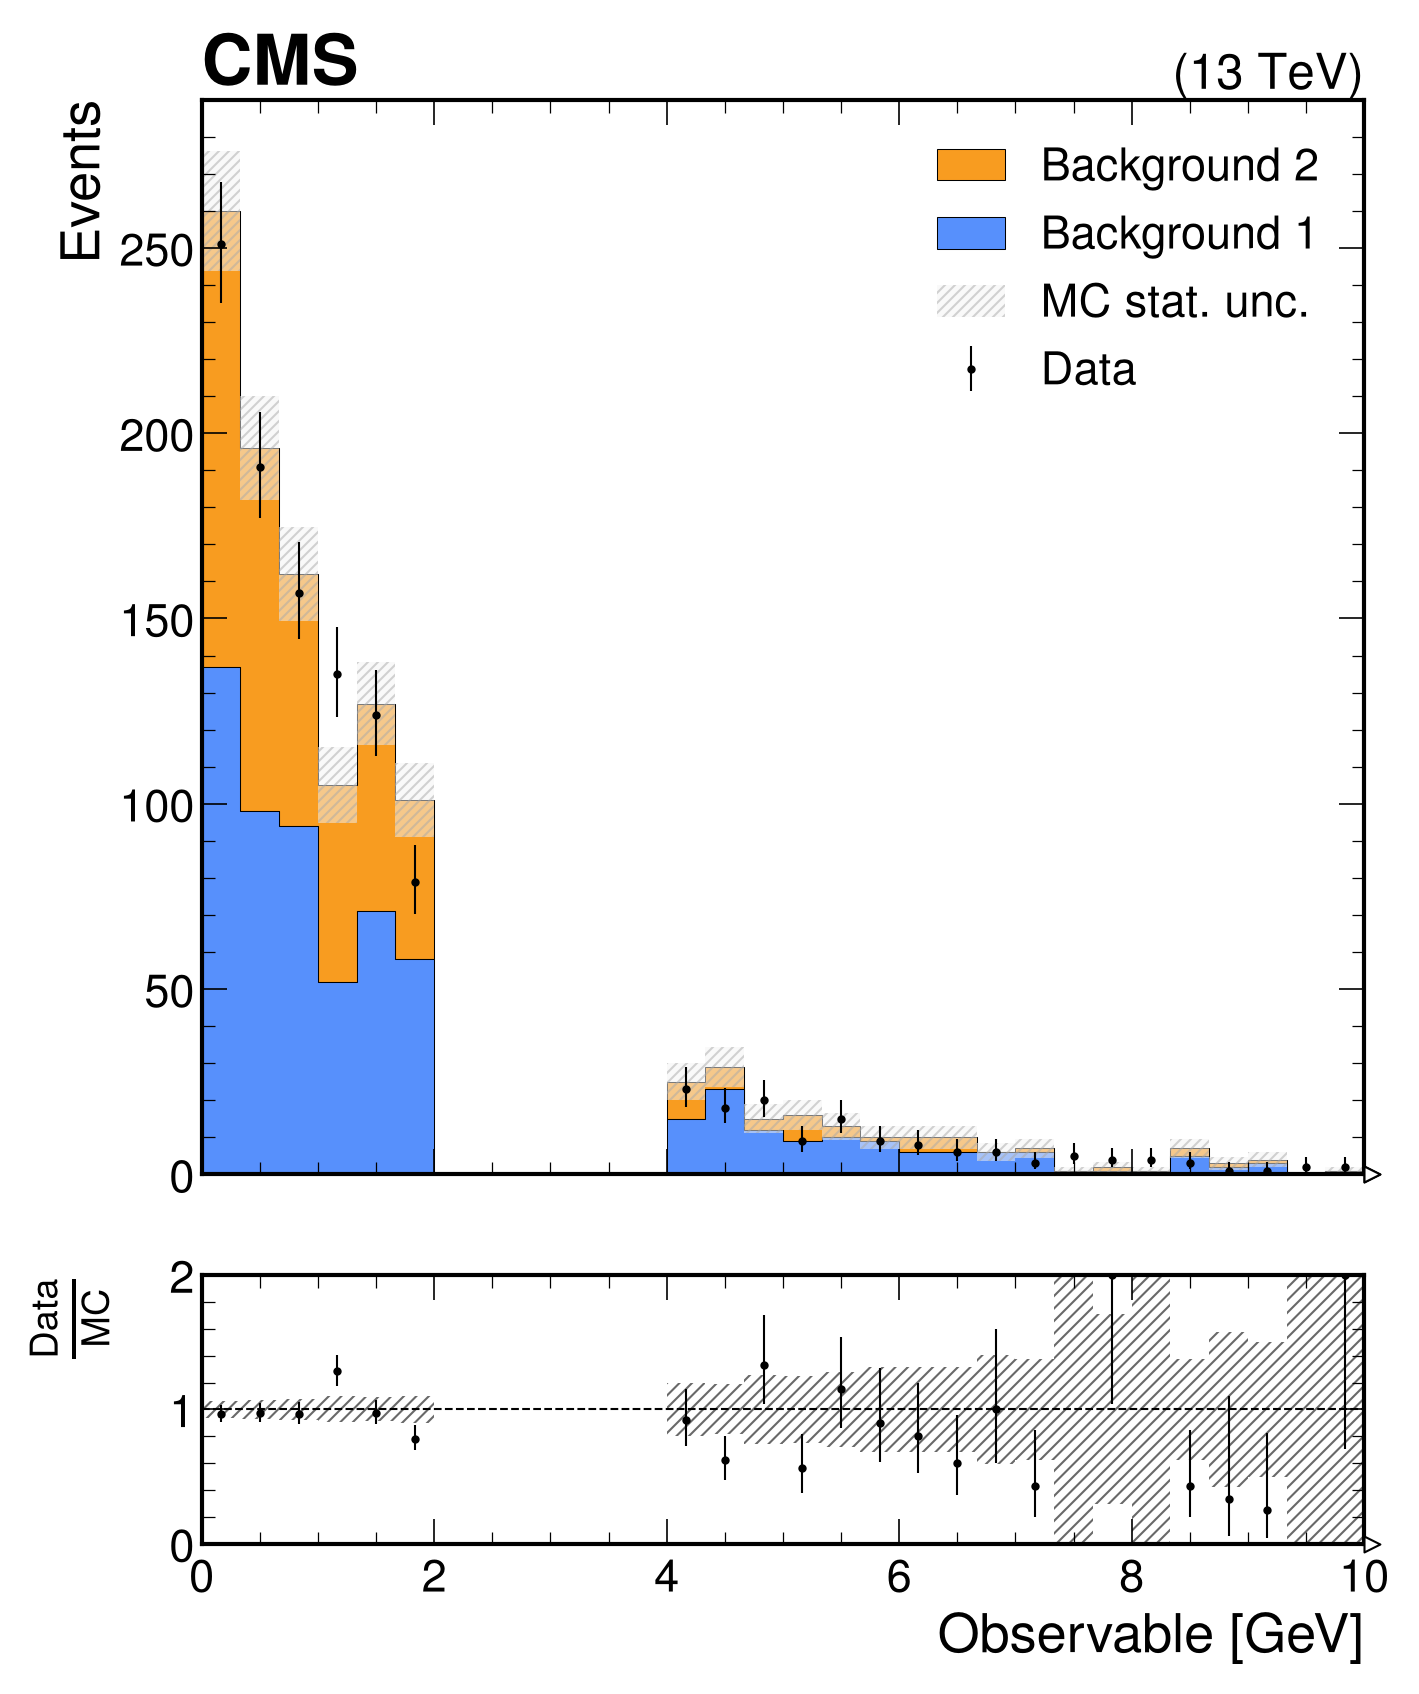
# Generate sample background and data
bkg1 = np.random.exponential(2.0, 800)
bkg2 = np.random.exponential(1.5, 600)
data = np.concatenate([
 np.random.exponential(2.0, 800),
 np.random.exponential(1.5, 600)
])

# Create histograms
h_bkg1 = hist.new.Reg(30, 0, 10).Weight().fill(bkg1)
h_bkg2 = hist.new.Reg(30, 0, 10).Weight().fill(bkg2)
h_data = hist.new.Reg(30, 0, 10).Weight().fill(data)

# Create comparison plot with blinded region
fig, ax_main, ax_comp = mh.comp.data_model(
 h_data,
 stacked_components=[h_bkg1, h_bkg2],
 stacked_labels=['Background 1', 'Background 2'],
 blind=(2.0, 4.0), # Blind potential signal region
 xlabel='Observable [GeV]',
 ylabel='Events',
 data_label='Data',
 comparison='split_ratio'
)
mh.atlas.label(data=True, ax=ax_main)
mh.mpl_magic(soft_fail=True)
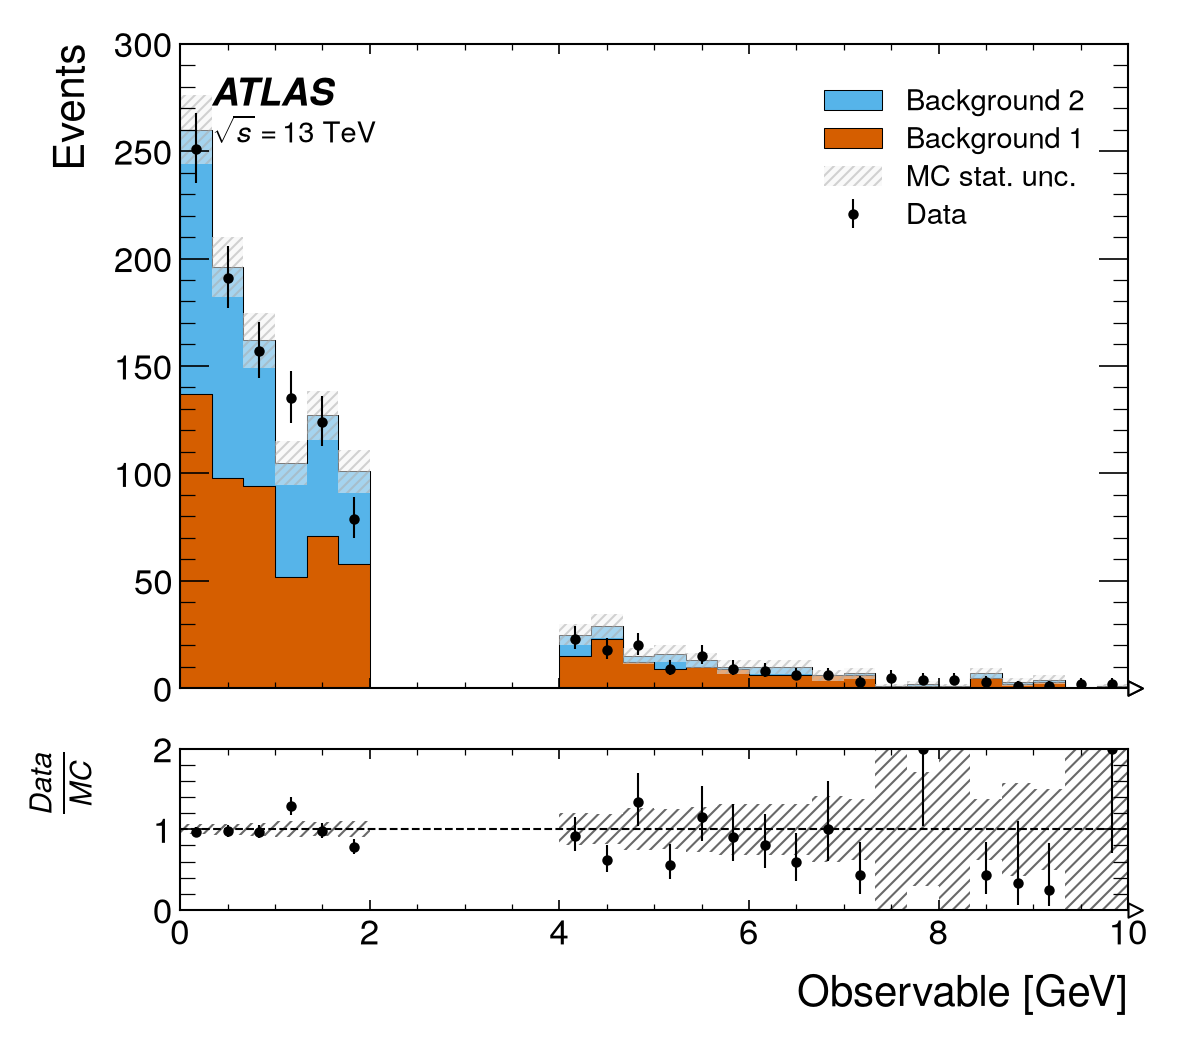
# Generate sample background and data
bkg1 = np.random.exponential(2.0, 800)
bkg2 = np.random.exponential(1.5, 600)
data = np.concatenate([
 np.random.exponential(2.0, 800),
 np.random.exponential(1.5, 600)
])

# Create histograms
h_bkg1 = hist.new.Reg(30, 0, 10).Weight().fill(bkg1)
h_bkg2 = hist.new.Reg(30, 0, 10).Weight().fill(bkg2)
h_data = hist.new.Reg(30, 0, 10).Weight().fill(data)

# Create comparison plot with blinded region
fig, ax_main, ax_comp = mh.comp.data_model(
 h_data,
 stacked_components=[h_bkg1, h_bkg2],
 stacked_labels=['Background 1', 'Background 2'],
 blind=(2.0, 4.0), # Blind potential signal region
 xlabel='Observable [GeV]',
 ylabel='Events',
 data_label='Data',
 comparison='split_ratio'
)
mh.lhcb.label(data=True, ax=ax_main)
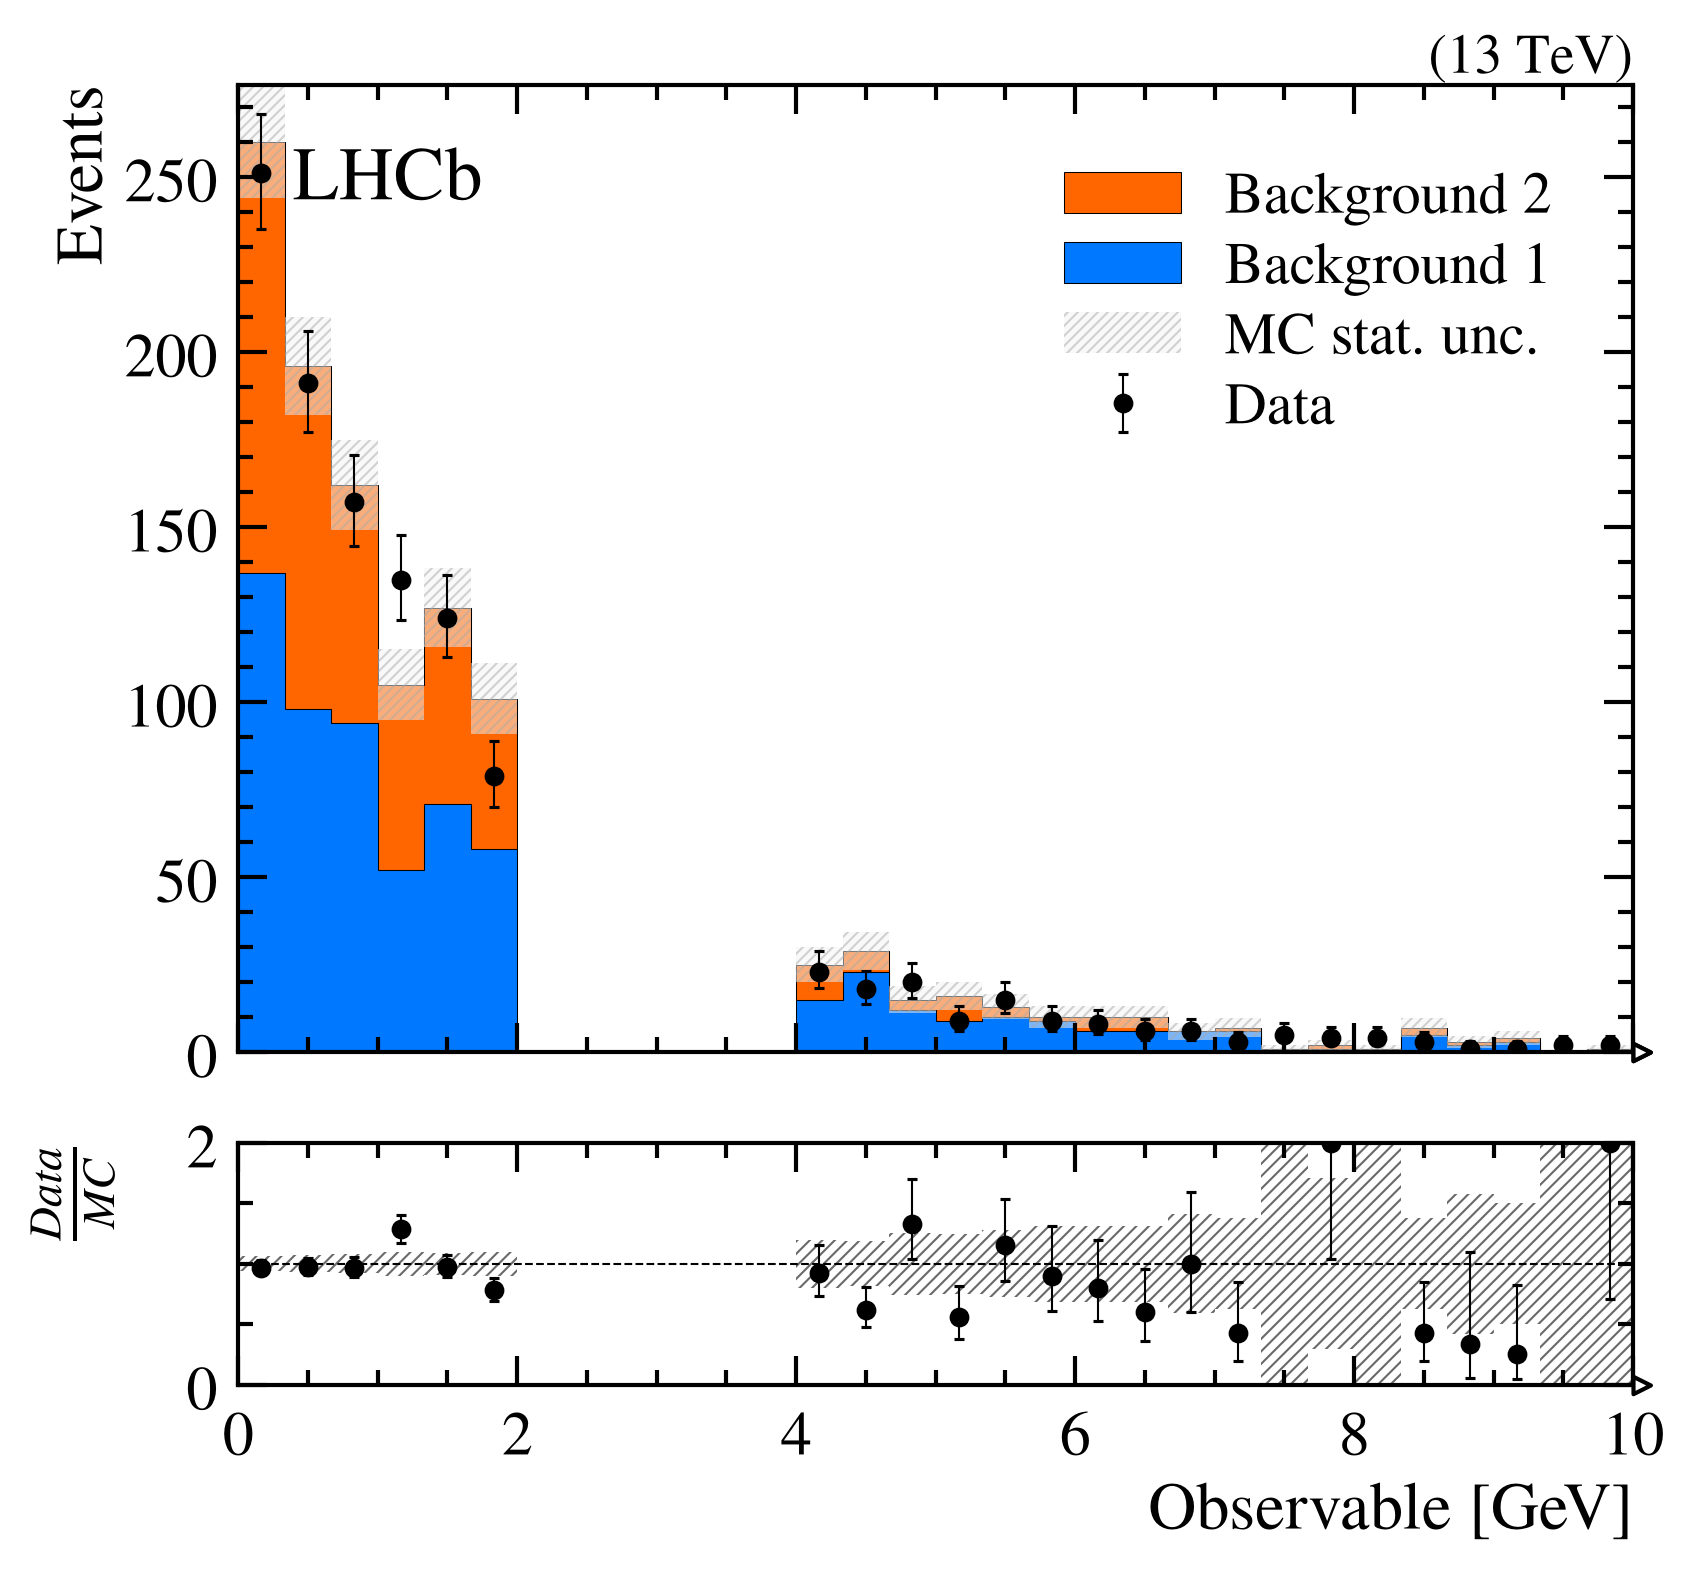
# Generate sample background and data
bkg1 = np.random.exponential(2.0, 800)
bkg2 = np.random.exponential(1.5, 600)
data = np.concatenate([
 np.random.exponential(2.0, 800),
 np.random.exponential(1.5, 600)
])

# Create histograms
h_bkg1 = hist.new.Reg(30, 0, 10).Weight().fill(bkg1)
h_bkg2 = hist.new.Reg(30, 0, 10).Weight().fill(bkg2)
h_data = hist.new.Reg(30, 0, 10).Weight().fill(data)

# Create comparison plot with blinded region
fig, ax_main, ax_comp = mh.comp.data_model(
 h_data,
 stacked_components=[h_bkg1, h_bkg2],
 stacked_labels=['Background 1', 'Background 2'],
 blind=(2.0, 4.0), # Blind potential signal region
 xlabel='Observable [GeV]',
 ylabel='Events',
 data_label='Data',
 comparison='split_ratio'
)
mh.alice.label(data=True, ax=ax_main)
mh.mpl_magic(soft_fail=True)
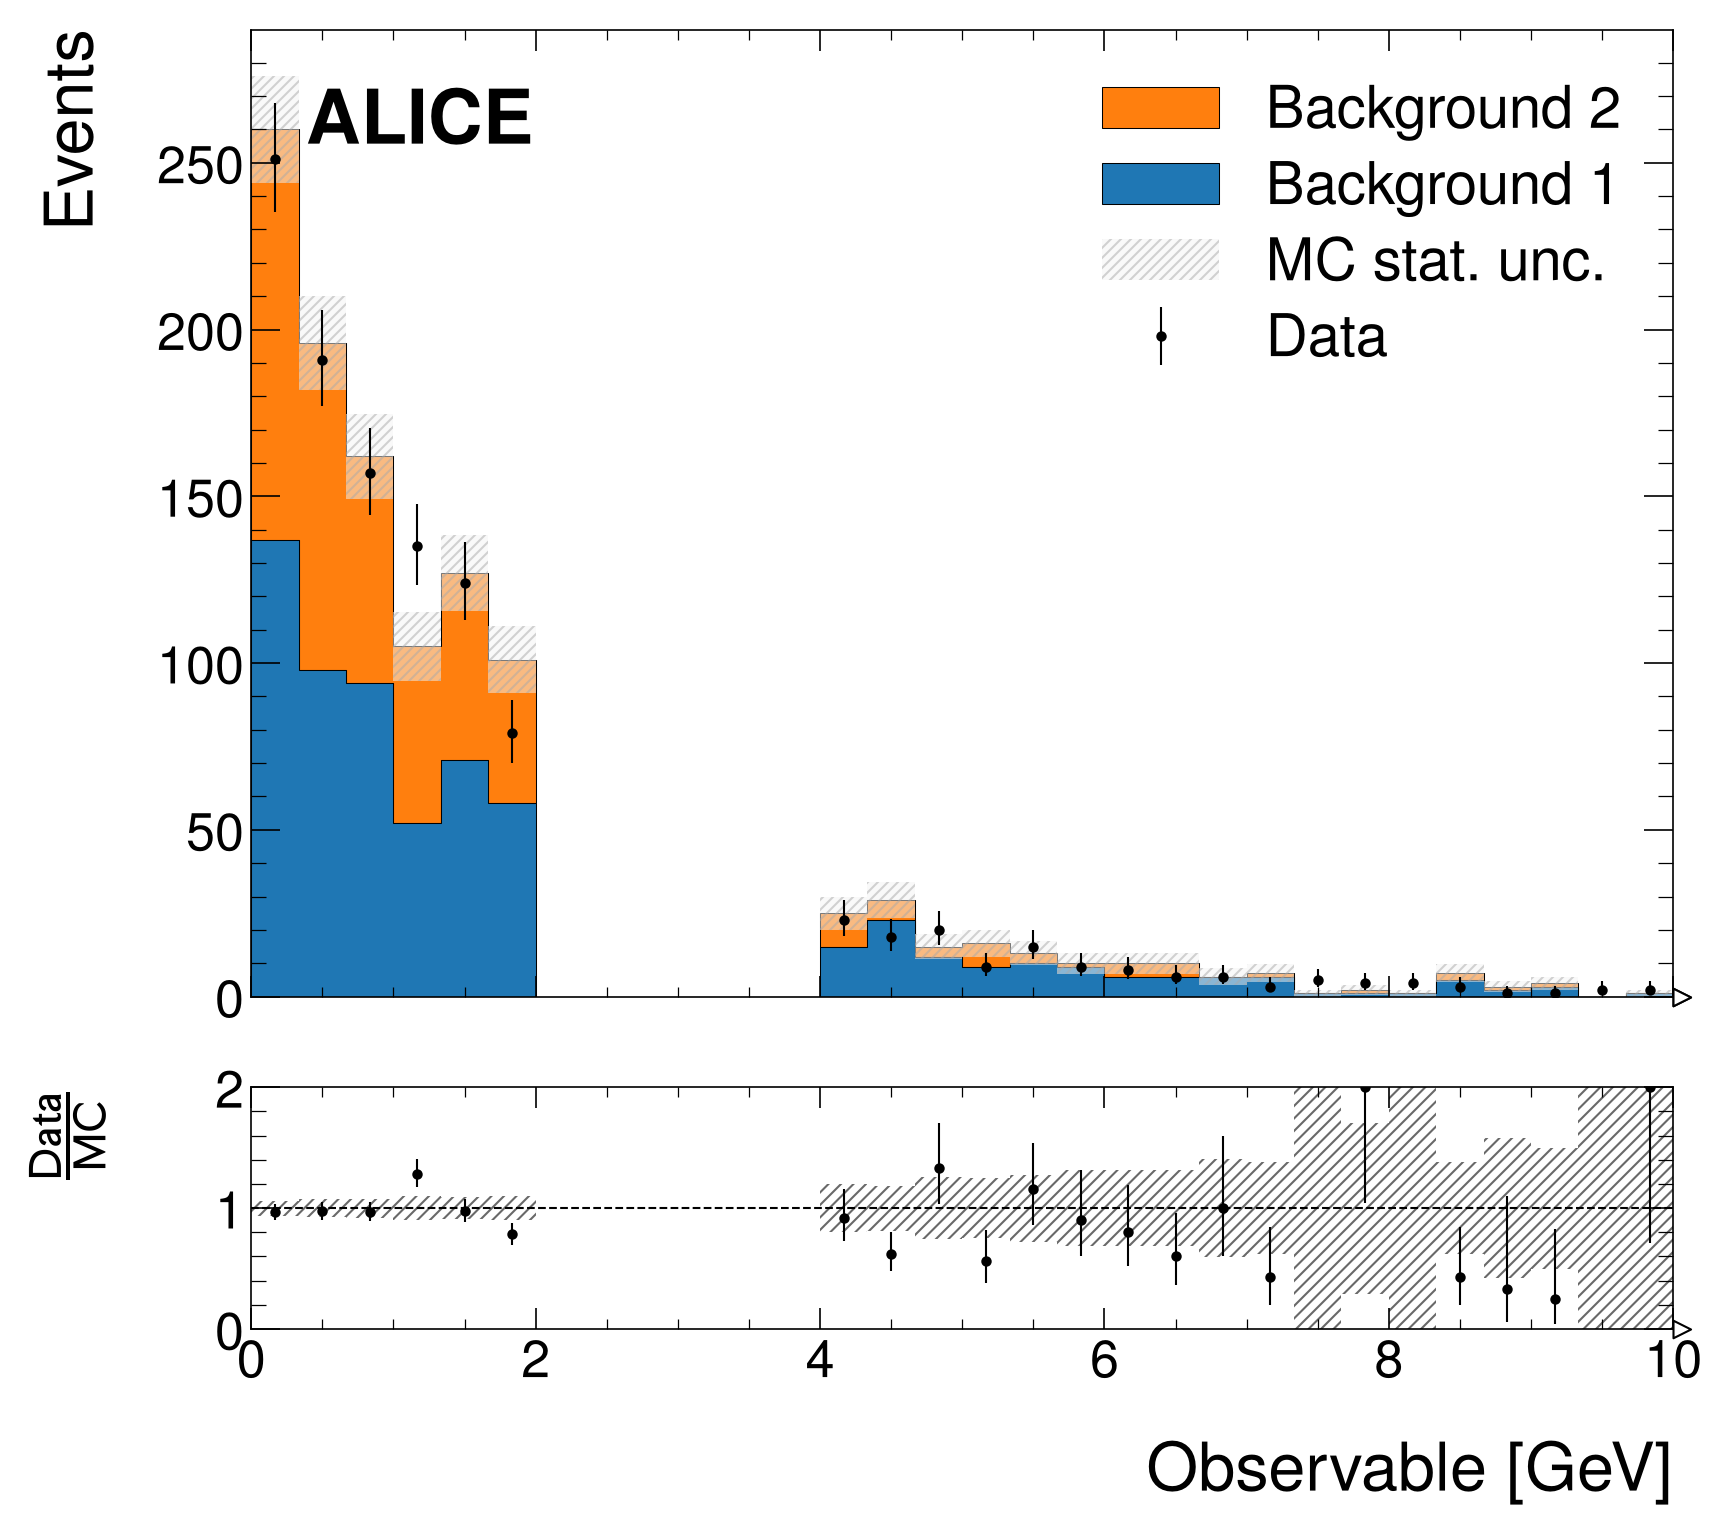
# Generate sample background and data
bkg1 = np.random.exponential(2.0, 800)
bkg2 = np.random.exponential(1.5, 600)
data = np.concatenate([
 np.random.exponential(2.0, 800),
 np.random.exponential(1.5, 600)
])

# Create histograms
h_bkg1 = hist.new.Reg(30, 0, 10).Weight().fill(bkg1)
h_bkg2 = hist.new.Reg(30, 0, 10).Weight().fill(bkg2)
h_data = hist.new.Reg(30, 0, 10).Weight().fill(data)

# Create comparison plot with blinded region
fig, ax_main, ax_comp = mh.comp.data_model(
 h_data,
 stacked_components=[h_bkg1, h_bkg2],
 stacked_labels=['Background 1', 'Background 2'],
 blind=(2.0, 4.0), # Blind potential signal region
 xlabel='Observable [GeV]',
 ylabel='Events',
 data_label='Data',
 comparison='split_ratio'
)
mh.dune.label(data=True, ax=ax_main)
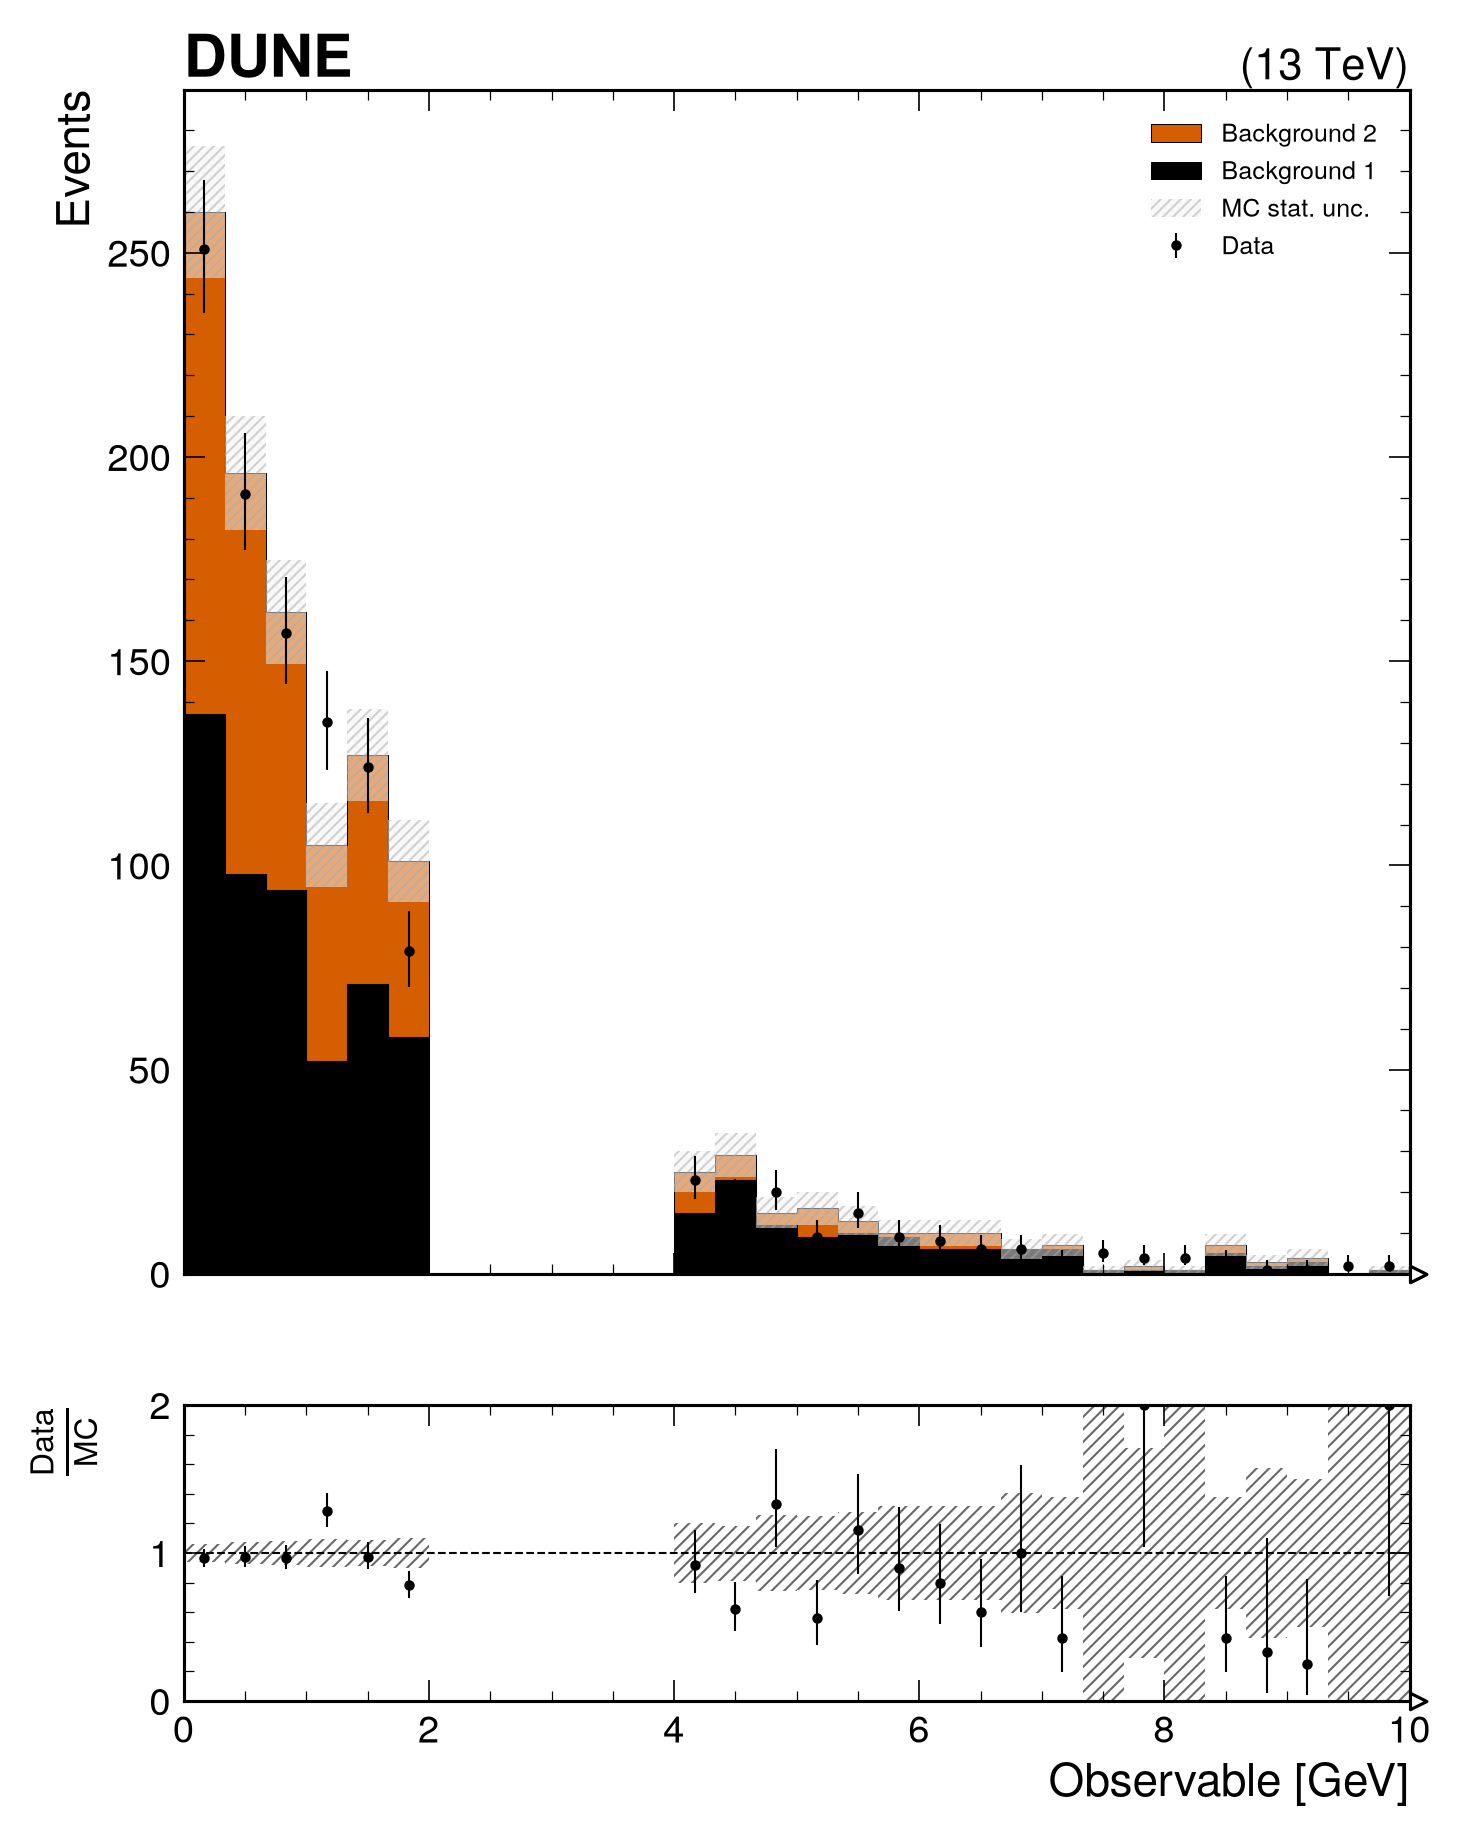
Additional examples¤
The functions are very flexible, here is some additional examples showcasing more options and use cases. For more details, see the API Reference and the Gallery.
# Generate training and testing histograms for two classes
x1_train = np.random.normal(0, 0.3, 2000)
x1_test = np.random.normal(0, 0.3, 1000)
x2_train = np.random.normal(1, 0.3, 2000)
x2_test = np.random.normal(1, 0.3, 1000)
h1_train = hist.new.Regular(30, 0, 1).Weight().fill(x1_train)
h2_train = hist.new.Regular(30, 0, 1).Weight().fill(x2_train)
h1_test = hist.new.Regular(30, 0, 1).Weight().fill(x1_test)
h2_test = hist.new.Regular(30, 0, 1).Weight().fill(x2_test)

# Since we have the histogram objects, we can normalize them directly
h1_train /= h1_train.sum().value
h2_train /= h2_train.sum().value
h1_test /= h1_test.sum().value
h2_test /= h2_test.sum().value

# Using the wrapper around subplots
fig, axes = mh.subplots(nrows=3)

colors = ["C0", "C1"]
labels = ["Bkg", "Signal"]

# Plotting on the main axis
for k_hist, h in enumerate([h1_train, h2_train, h1_test, h2_test]):
 color = colors[k_hist % 2]
 label = labels[k_hist % 2]
 yerr = False if k_hist < 2 else True # To make the plot less busy

 mh.histplot(
 h,
 color=color,
 label=label + (" $_{Train}$" if k_hist <2 else " $_{Test}$"),
 ax=axes[0],
 yerr=yerr,
 histtype="step" if k_hist < 2 else "errorbar",
 )

# Plotting comparisons on the other axes
mh.comp.comparison(
 h1_train,
 h1_test,
 ax=axes[1],
 comparison="ratio",
 h1_label="Train",
 h2_label="Test",
 color=colors[0],
)

mh.comp.comparison(
 h2_train,
 h2_test,
 ax=axes[2],
 comparison="pull",
 h1_label="Train",
 h2_label="Test",
 color=colors[1],
)

for ax in axes:
 ax.set_xlim(0, 1)

axes[0].set_ylabel("Normalized Entries")
axes[0].legend()
axes[1].set_ylabel("Ratio")
axes[2].set_ylabel("Pull")
axes[-1].set_xlabel("Feature")

fig.align_ylabels() # Align y labels
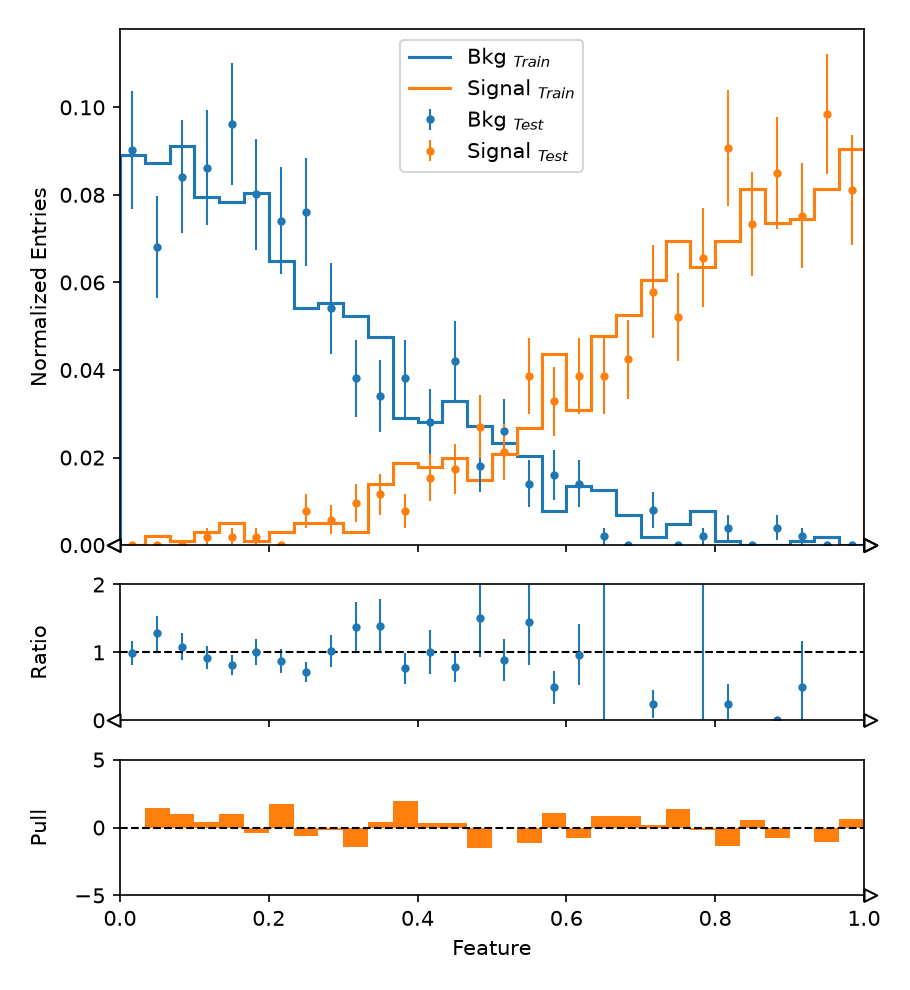
# Generate training and testing histograms for two classes
x1_train = np.random.normal(0, 0.3, 2000)
x1_test = np.random.normal(0, 0.3, 1000)
x2_train = np.random.normal(1, 0.3, 2000)
x2_test = np.random.normal(1, 0.3, 1000)
h1_train = hist.new.Regular(30, 0, 1).Weight().fill(x1_train)
h2_train = hist.new.Regular(30, 0, 1).Weight().fill(x2_train)
h1_test = hist.new.Regular(30, 0, 1).Weight().fill(x1_test)
h2_test = hist.new.Regular(30, 0, 1).Weight().fill(x2_test)

# Since we have the histogram objects, we can normalize them directly
h1_train /= h1_train.sum().value
h2_train /= h2_train.sum().value
h1_test /= h1_test.sum().value
h2_test /= h2_test.sum().value

# Using the wrapper around subplots
fig, axes = mh.subplots(nrows=3)

colors = ["C0", "C1"]
labels = ["Bkg", "Signal"]

# Plotting on the main axis
for k_hist, h in enumerate([h1_train, h2_train, h1_test, h2_test]):
 color = colors[k_hist % 2]
 label = labels[k_hist % 2]
 yerr = False if k_hist < 2 else True # To make the plot less busy

 mh.histplot(
 h,
 color=color,
 label=label + (" $_{Train}$" if k_hist <2 else " $_{Test}$"),
 ax=axes[0],
 yerr=yerr,
 histtype="step" if k_hist < 2 else "errorbar",
 )

# Plotting comparisons on the other axes
mh.comp.comparison(
 h1_train,
 h1_test,
 ax=axes[1],
 comparison="ratio",
 h1_label="Train",
 h2_label="Test",
 color=colors[0],
)

mh.comp.comparison(
 h2_train,
 h2_test,
 ax=axes[2],
 comparison="pull",
 h1_label="Train",
 h2_label="Test",
 color=colors[1],
)

for ax in axes:
 ax.set_xlim(0, 1)

axes[0].set_ylabel("Normalized Entries")
axes[0].legend()
axes[1].set_ylabel("Ratio")
axes[2].set_ylabel("Pull")
axes[-1].set_xlabel("Feature")

fig.align_ylabels() # Align y labels

txt_obj = mh.add_text('plothist', loc='over left', ax=ax_main)
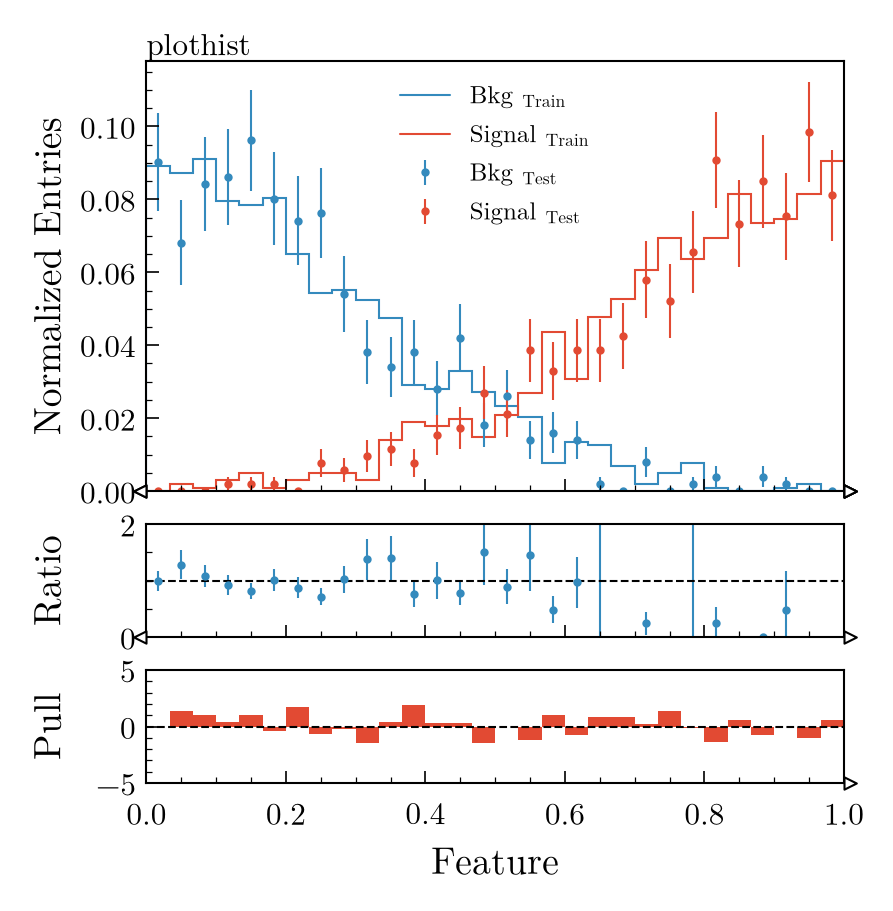
# Generate training and testing histograms for two classes
x1_train = np.random.normal(0, 0.3, 2000)
x1_test = np.random.normal(0, 0.3, 1000)
x2_train = np.random.normal(1, 0.3, 2000)
x2_test = np.random.normal(1, 0.3, 1000)
h1_train = hist.new.Regular(30, 0, 1).Weight().fill(x1_train)
h2_train = hist.new.Regular(30, 0, 1).Weight().fill(x2_train)
h1_test = hist.new.Regular(30, 0, 1).Weight().fill(x1_test)
h2_test = hist.new.Regular(30, 0, 1).Weight().fill(x2_test)

# Since we have the histogram objects, we can normalize them directly
h1_train /= h1_train.sum().value
h2_train /= h2_train.sum().value
h1_test /= h1_test.sum().value
h2_test /= h2_test.sum().value

# Using the wrapper around subplots
fig, axes = mh.subplots(nrows=3)

colors = ["C0", "C1"]
labels = ["Bkg", "Signal"]

# Plotting on the main axis
for k_hist, h in enumerate([h1_train, h2_train, h1_test, h2_test]):
 color = colors[k_hist % 2]
 label = labels[k_hist % 2]
 yerr = False if k_hist < 2 else True # To make the plot less busy

 mh.histplot(
 h,
 color=color,
 label=label + (" $_{Train}$" if k_hist <2 else " $_{Test}$"),
 ax=axes[0],
 yerr=yerr,
 histtype="step" if k_hist < 2 else "errorbar",
 )

# Plotting comparisons on the other axes
mh.comp.comparison(
 h1_train,
 h1_test,
 ax=axes[1],
 comparison="ratio",
 h1_label="Train",
 h2_label="Test",
 color=colors[0],
)

mh.comp.comparison(
 h2_train,
 h2_test,
 ax=axes[2],
 comparison="pull",
 h1_label="Train",
 h2_label="Test",
 color=colors[1],
)

for ax in axes:
 ax.set_xlim(0, 1)

axes[0].set_ylabel("Normalized Entries")
axes[0].legend()
axes[1].set_ylabel("Ratio")
axes[2].set_ylabel("Pull")
axes[-1].set_xlabel("Feature")

fig.align_ylabels() # Align y labels

mh.cms.label(data=True, ax=ax_main)
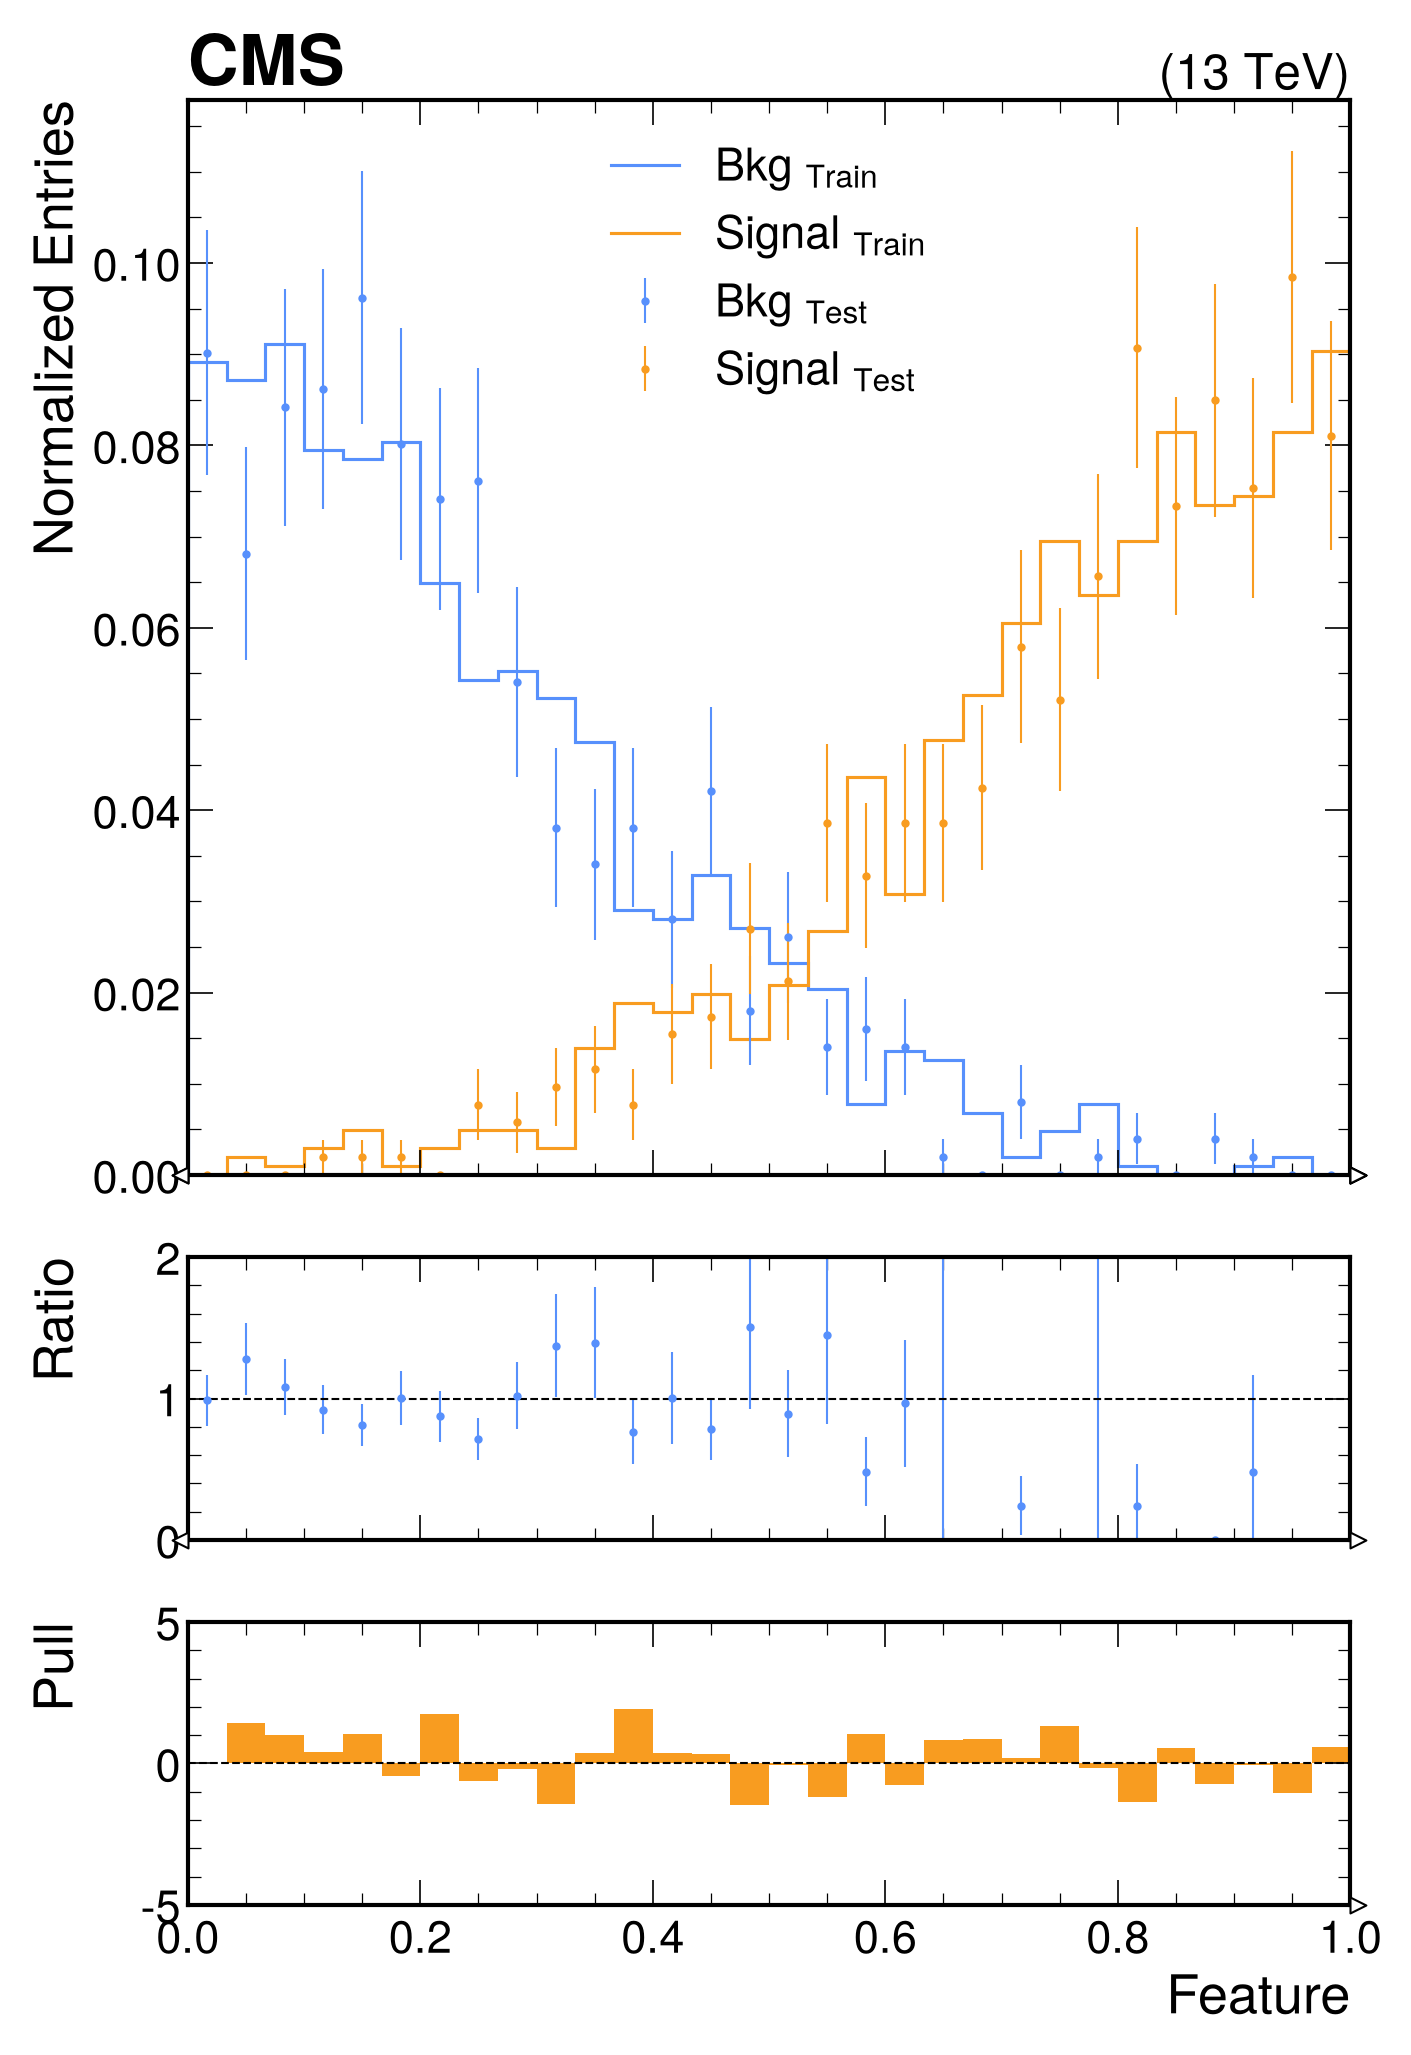
# Generate training and testing histograms for two classes
x1_train = np.random.normal(0, 0.3, 2000)
x1_test = np.random.normal(0, 0.3, 1000)
x2_train = np.random.normal(1, 0.3, 2000)
x2_test = np.random.normal(1, 0.3, 1000)
h1_train = hist.new.Regular(30, 0, 1).Weight().fill(x1_train)
h2_train = hist.new.Regular(30, 0, 1).Weight().fill(x2_train)
h1_test = hist.new.Regular(30, 0, 1).Weight().fill(x1_test)
h2_test = hist.new.Regular(30, 0, 1).Weight().fill(x2_test)

# Since we have the histogram objects, we can normalize them directly
h1_train /= h1_train.sum().value
h2_train /= h2_train.sum().value
h1_test /= h1_test.sum().value
h2_test /= h2_test.sum().value

# Using the wrapper around subplots
fig, axes = mh.subplots(nrows=3)

colors = ["C0", "C1"]
labels = ["Bkg", "Signal"]

# Plotting on the main axis
for k_hist, h in enumerate([h1_train, h2_train, h1_test, h2_test]):
 color = colors[k_hist % 2]
 label = labels[k_hist % 2]
 yerr = False if k_hist < 2 else True # To make the plot less busy

 mh.histplot(
 h,
 color=color,
 label=label + (" $_{Train}$" if k_hist <2 else " $_{Test}$"),
 ax=axes[0],
 yerr=yerr,
 histtype="step" if k_hist < 2 else "errorbar",
 )

# Plotting comparisons on the other axes
mh.comp.comparison(
 h1_train,
 h1_test,
 ax=axes[1],
 comparison="ratio",
 h1_label="Train",
 h2_label="Test",
 color=colors[0],
)

mh.comp.comparison(
 h2_train,
 h2_test,
 ax=axes[2],
 comparison="pull",
 h1_label="Train",
 h2_label="Test",
 color=colors[1],
)

for ax in axes:
 ax.set_xlim(0, 1)

axes[0].set_ylabel("Normalized Entries")
axes[0].legend()
axes[1].set_ylabel("Ratio")
axes[2].set_ylabel("Pull")
axes[-1].set_xlabel("Feature")

fig.align_ylabels() # Align y labels

mh.atlas.label(data=True, ax=ax_main)
mh.mpl_magic(soft_fail=True)
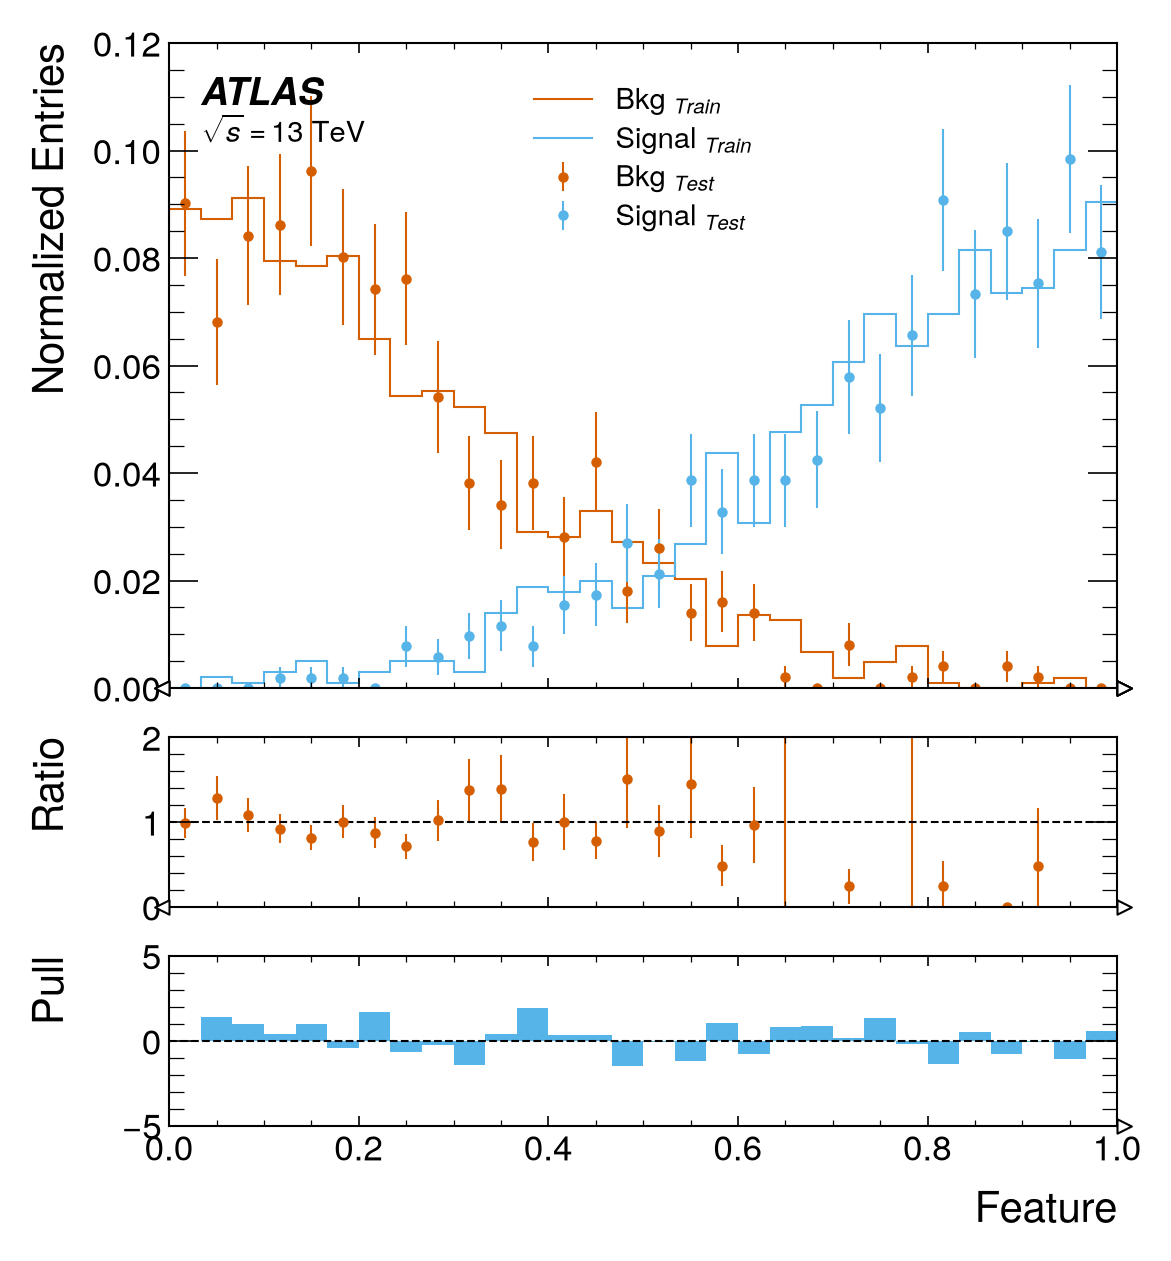
# Generate training and testing histograms for two classes
x1_train = np.random.normal(0, 0.3, 2000)
x1_test = np.random.normal(0, 0.3, 1000)
x2_train = np.random.normal(1, 0.3, 2000)
x2_test = np.random.normal(1, 0.3, 1000)
h1_train = hist.new.Regular(30, 0, 1).Weight().fill(x1_train)
h2_train = hist.new.Regular(30, 0, 1).Weight().fill(x2_train)
h1_test = hist.new.Regular(30, 0, 1).Weight().fill(x1_test)
h2_test = hist.new.Regular(30, 0, 1).Weight().fill(x2_test)

# Since we have the histogram objects, we can normalize them directly
h1_train /= h1_train.sum().value
h2_train /= h2_train.sum().value
h1_test /= h1_test.sum().value
h2_test /= h2_test.sum().value

# Using the wrapper around subplots
fig, axes = mh.subplots(nrows=3)

colors = ["C0", "C1"]
labels = ["Bkg", "Signal"]

# Plotting on the main axis
for k_hist, h in enumerate([h1_train, h2_train, h1_test, h2_test]):
 color = colors[k_hist % 2]
 label = labels[k_hist % 2]
 yerr = False if k_hist < 2 else True # To make the plot less busy

 mh.histplot(
 h,
 color=color,
 label=label + (" $_{Train}$" if k_hist <2 else " $_{Test}$"),
 ax=axes[0],
 yerr=yerr,
 histtype="step" if k_hist < 2 else "errorbar",
 )

# Plotting comparisons on the other axes
mh.comp.comparison(
 h1_train,
 h1_test,
 ax=axes[1],
 comparison="ratio",
 h1_label="Train",
 h2_label="Test",
 color=colors[0],
)

mh.comp.comparison(
 h2_train,
 h2_test,
 ax=axes[2],
 comparison="pull",
 h1_label="Train",
 h2_label="Test",
 color=colors[1],
)

for ax in axes:
 ax.set_xlim(0, 1)

axes[0].set_ylabel("Normalized Entries")
axes[0].legend()
axes[1].set_ylabel("Ratio")
axes[2].set_ylabel("Pull")
axes[-1].set_xlabel("Feature")

fig.align_ylabels() # Align y labels

mh.lhcb.label(data=True, ax=ax_main)
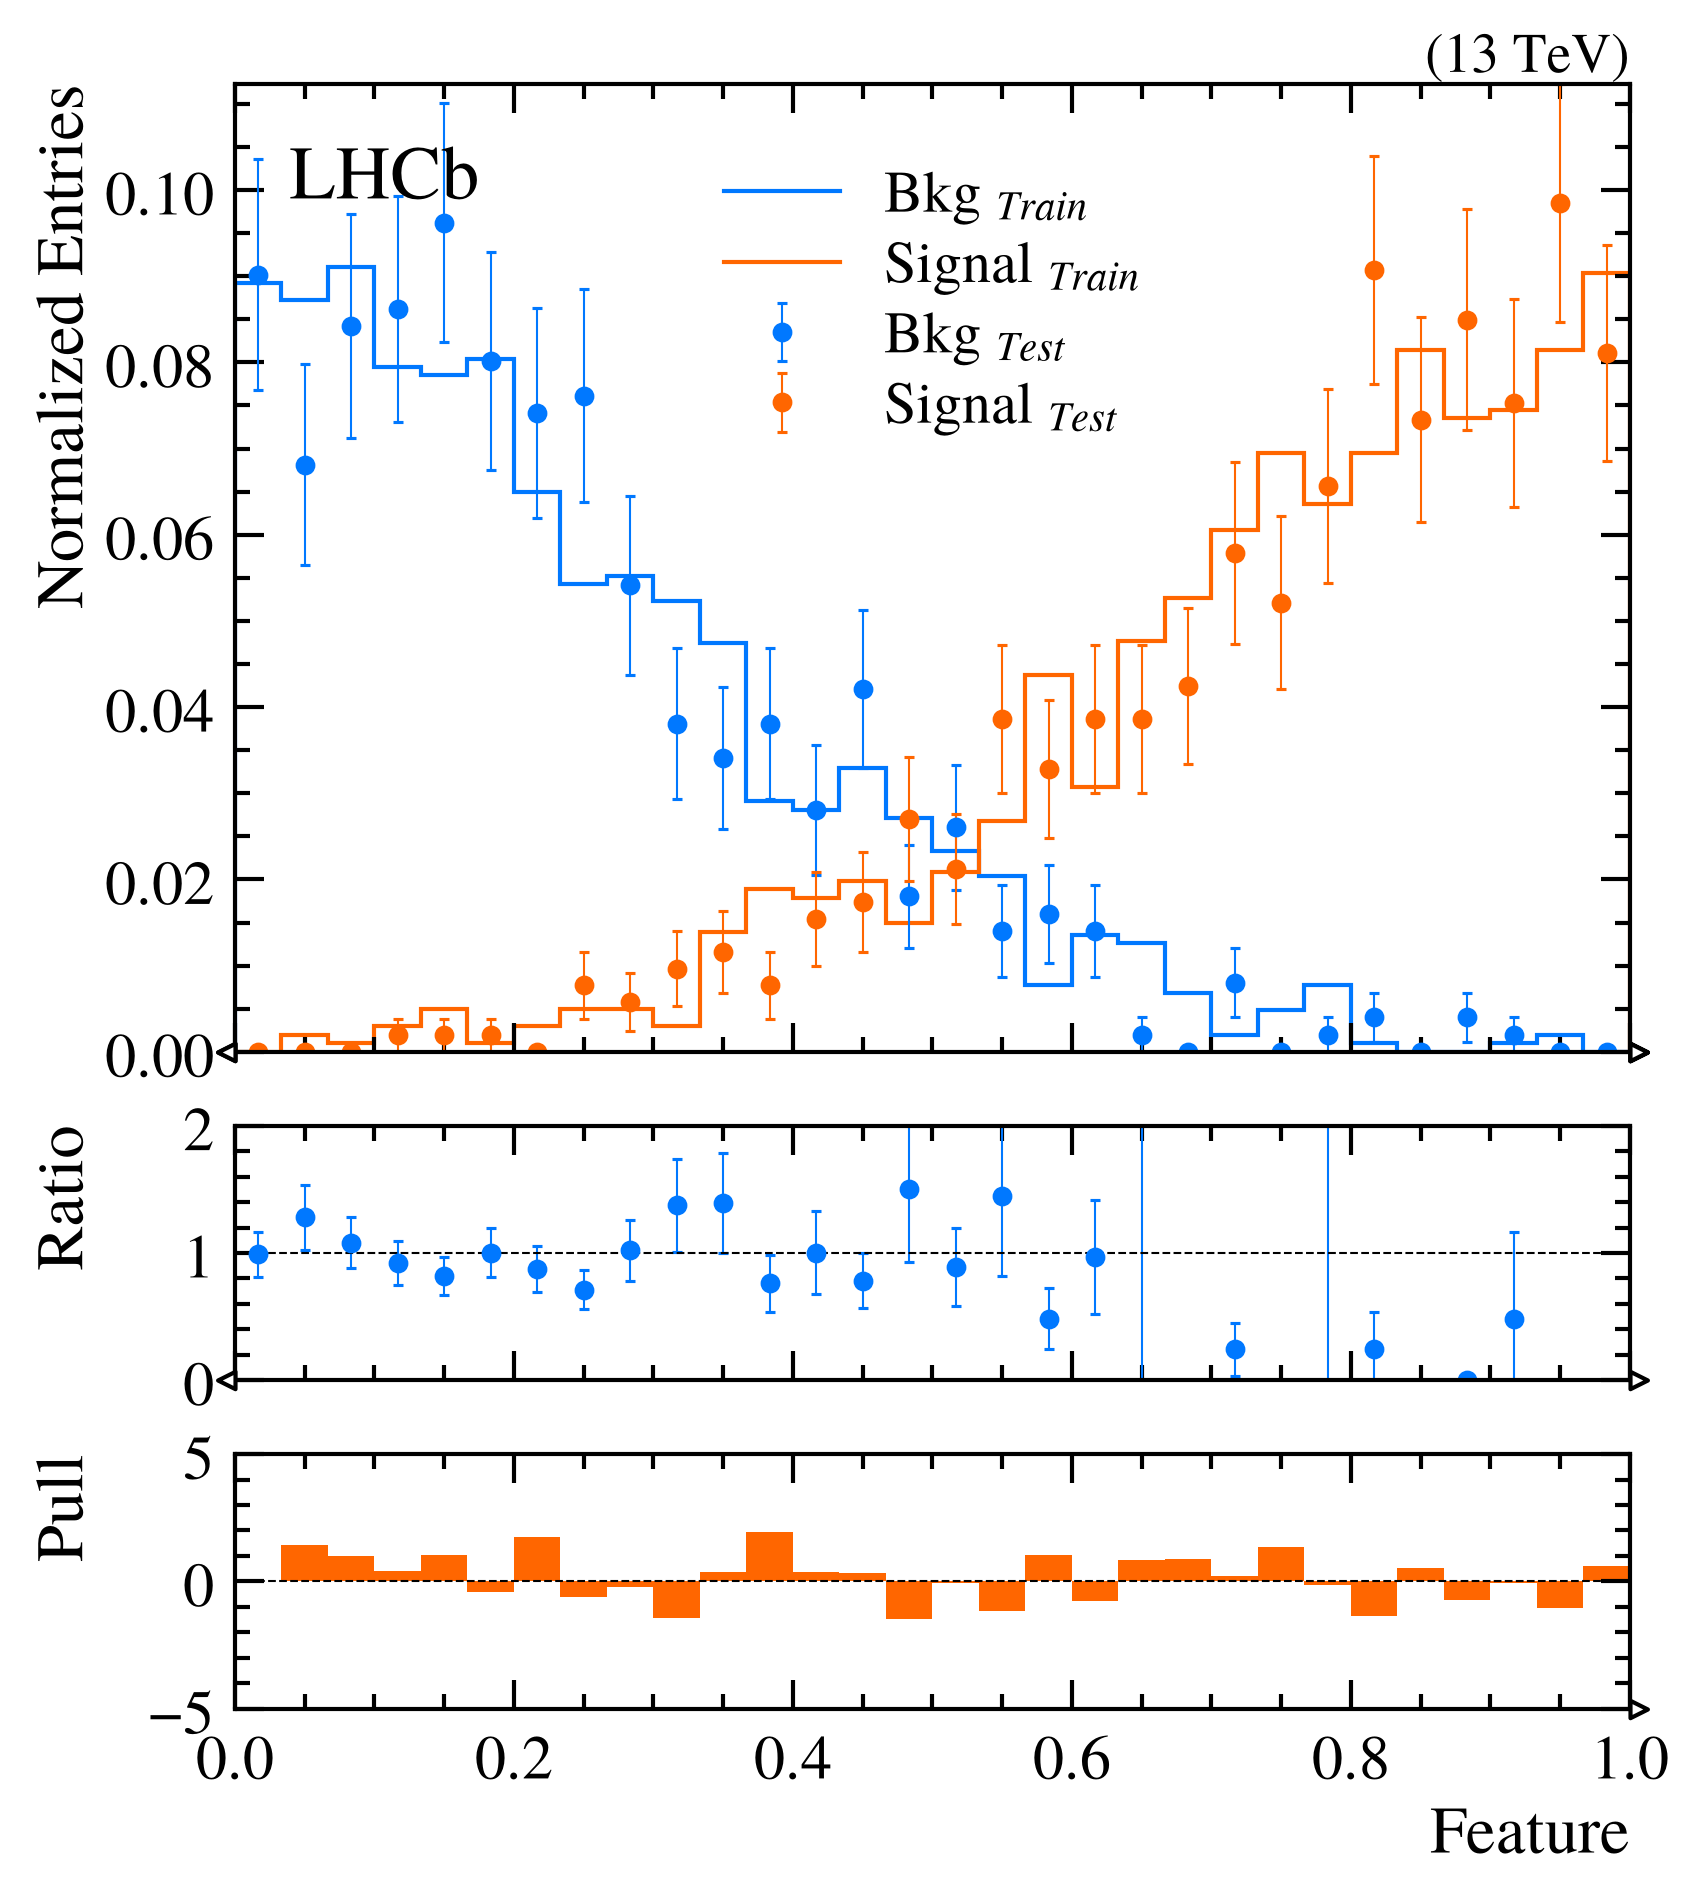
# Generate training and testing histograms for two classes
x1_train = np.random.normal(0, 0.3, 2000)
x1_test = np.random.normal(0, 0.3, 1000)
x2_train = np.random.normal(1, 0.3, 2000)
x2_test = np.random.normal(1, 0.3, 1000)
h1_train = hist.new.Regular(30, 0, 1).Weight().fill(x1_train)
h2_train = hist.new.Regular(30, 0, 1).Weight().fill(x2_train)
h1_test = hist.new.Regular(30, 0, 1).Weight().fill(x1_test)
h2_test = hist.new.Regular(30, 0, 1).Weight().fill(x2_test)

# Since we have the histogram objects, we can normalize them directly
h1_train /= h1_train.sum().value
h2_train /= h2_train.sum().value
h1_test /= h1_test.sum().value
h2_test /= h2_test.sum().value

# Using the wrapper around subplots
fig, axes = mh.subplots(nrows=3)

colors = ["C0", "C1"]
labels = ["Bkg", "Signal"]

# Plotting on the main axis
for k_hist, h in enumerate([h1_train, h2_train, h1_test, h2_test]):
 color = colors[k_hist % 2]
 label = labels[k_hist % 2]
 yerr = False if k_hist < 2 else True # To make the plot less busy

 mh.histplot(
 h,
 color=color,
 label=label + (" $_{Train}$" if k_hist <2 else " $_{Test}$"),
 ax=axes[0],
 yerr=yerr,
 histtype="step" if k_hist < 2 else "errorbar",
 )

# Plotting comparisons on the other axes
mh.comp.comparison(
 h1_train,
 h1_test,
 ax=axes[1],
 comparison="ratio",
 h1_label="Train",
 h2_label="Test",
 color=colors[0],
)

mh.comp.comparison(
 h2_train,
 h2_test,
 ax=axes[2],
 comparison="pull",
 h1_label="Train",
 h2_label="Test",
 color=colors[1],
)

for ax in axes:
 ax.set_xlim(0, 1)

axes[0].set_ylabel("Normalized Entries")
axes[0].legend()
axes[1].set_ylabel("Ratio")
axes[2].set_ylabel("Pull")
axes[-1].set_xlabel("Feature")

fig.align_ylabels() # Align y labels

mh.alice.label(data=True, ax=ax_main)
mh.mpl_magic(soft_fail=True)
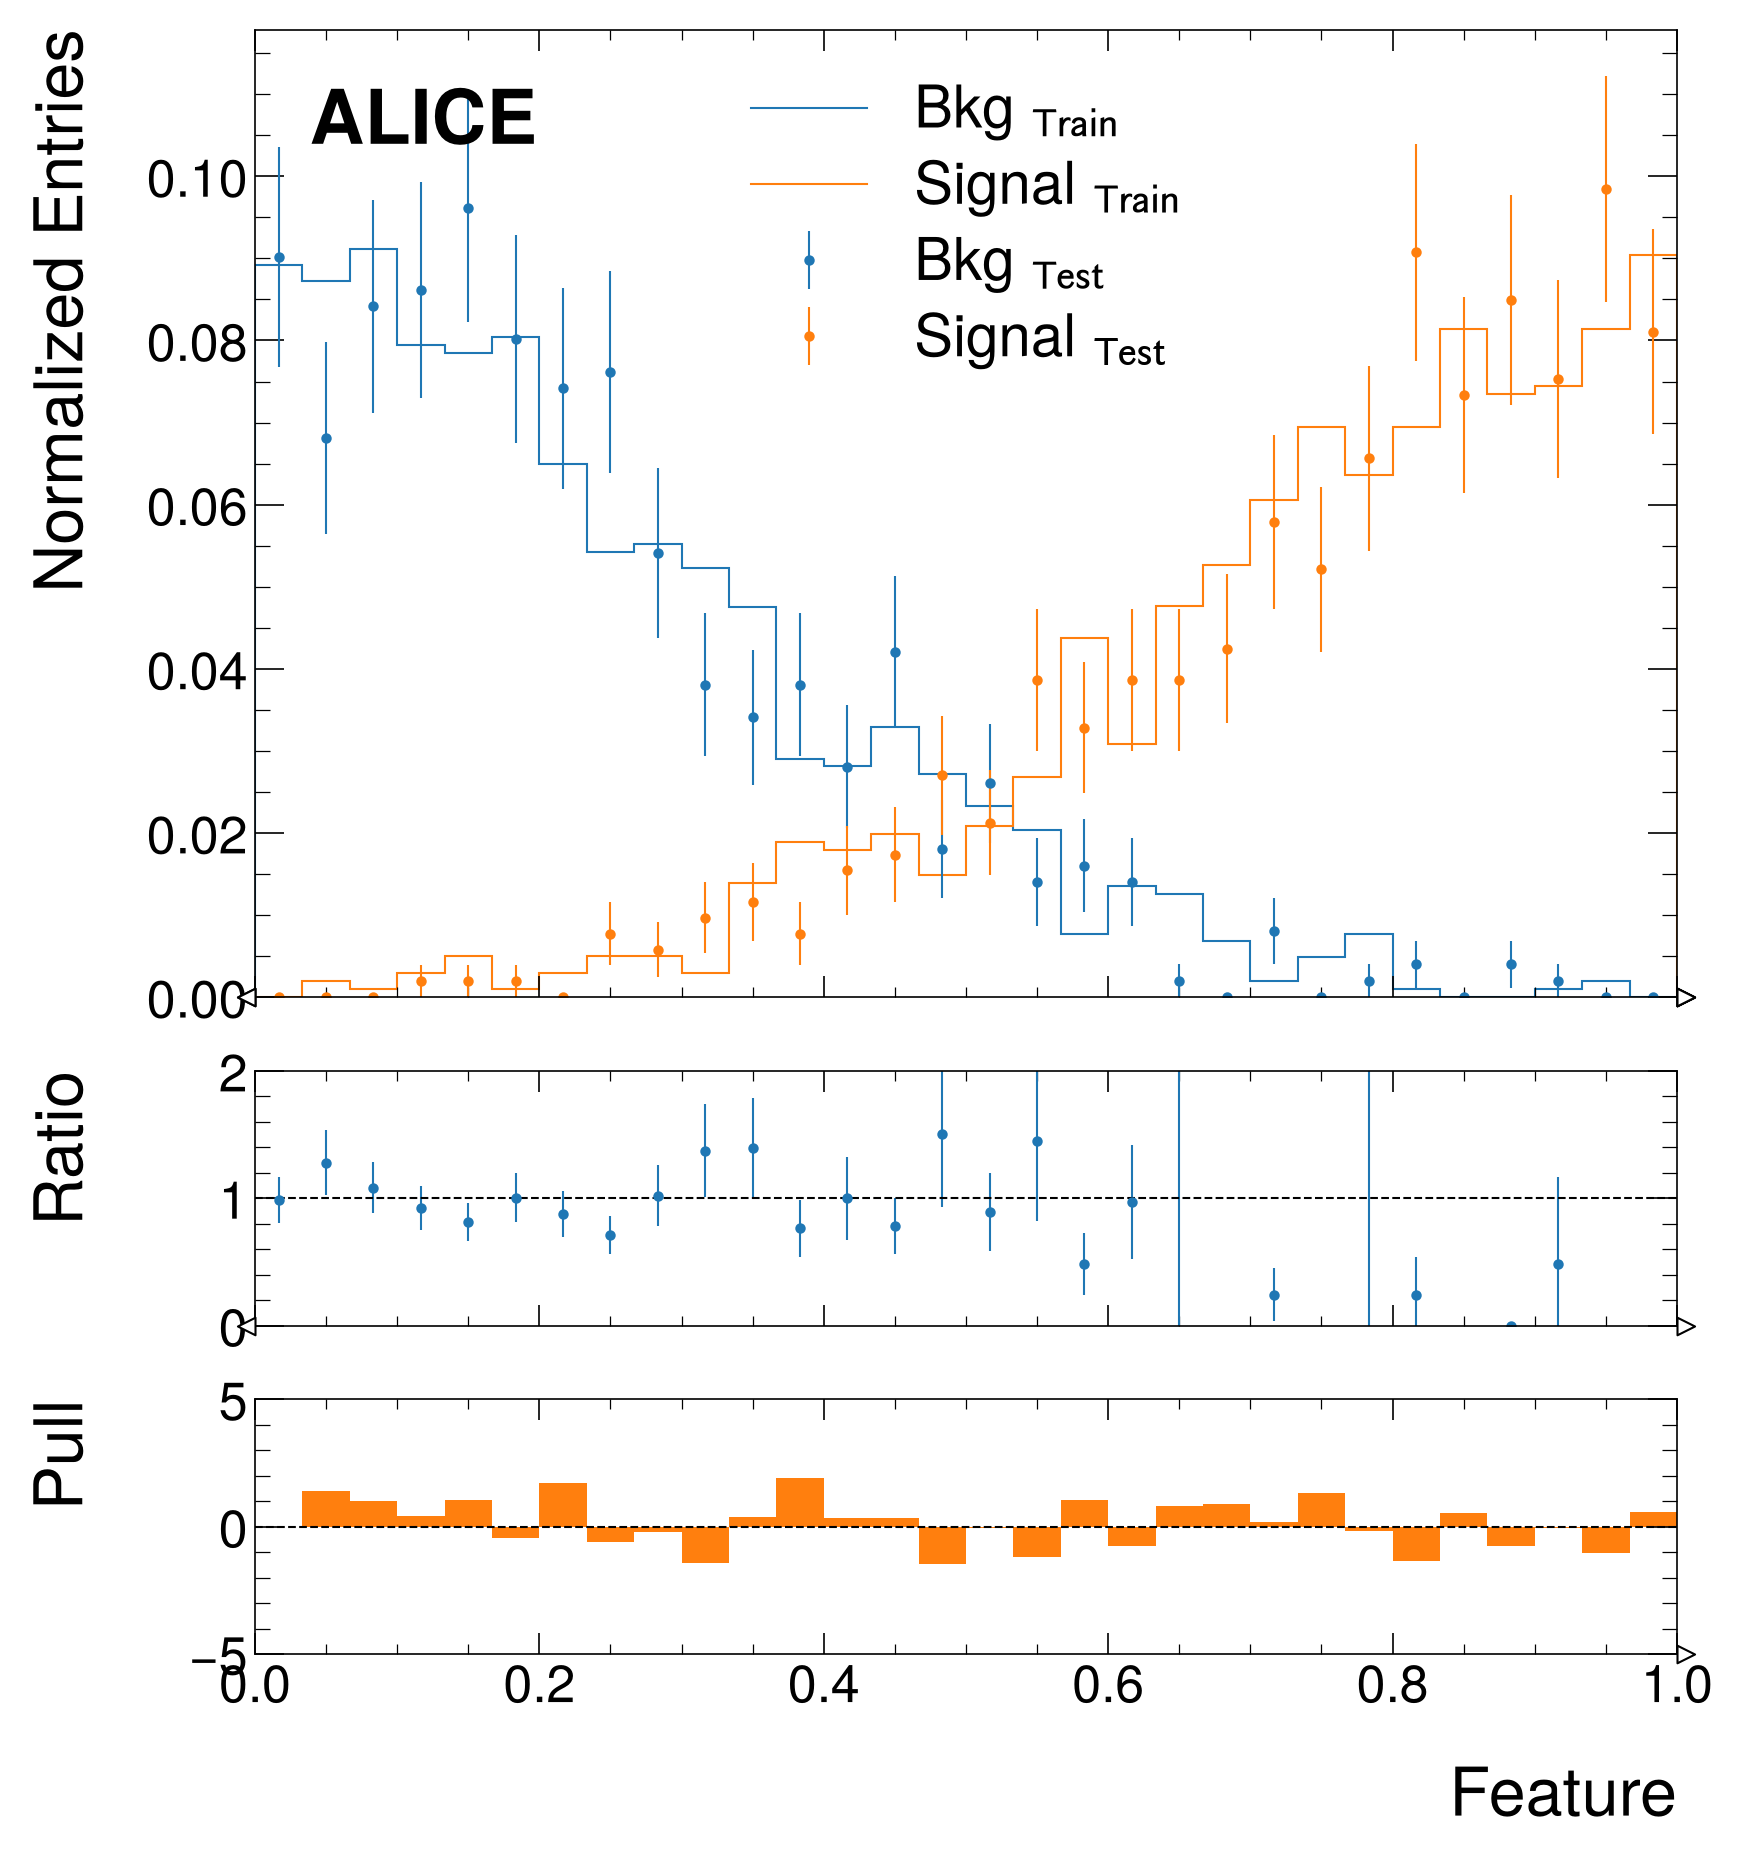
# Generate training and testing histograms for two classes
x1_train = np.random.normal(0, 0.3, 2000)
x1_test = np.random.normal(0, 0.3, 1000)
x2_train = np.random.normal(1, 0.3, 2000)
x2_test = np.random.normal(1, 0.3, 1000)
h1_train = hist.new.Regular(30, 0, 1).Weight().fill(x1_train)
h2_train = hist.new.Regular(30, 0, 1).Weight().fill(x2_train)
h1_test = hist.new.Regular(30, 0, 1).Weight().fill(x1_test)
h2_test = hist.new.Regular(30, 0, 1).Weight().fill(x2_test)

# Since we have the histogram objects, we can normalize them directly
h1_train /= h1_train.sum().value
h2_train /= h2_train.sum().value
h1_test /= h1_test.sum().value
h2_test /= h2_test.sum().value

# Using the wrapper around subplots
fig, axes = mh.subplots(nrows=3)

colors = ["C0", "C1"]
labels = ["Bkg", "Signal"]

# Plotting on the main axis
for k_hist, h in enumerate([h1_train, h2_train, h1_test, h2_test]):
 color = colors[k_hist % 2]
 label = labels[k_hist % 2]
 yerr = False if k_hist < 2 else True # To make the plot less busy

 mh.histplot(
 h,
 color=color,
 label=label + (" $_{Train}$" if k_hist <2 else " $_{Test}$"),
 ax=axes[0],
 yerr=yerr,
 histtype="step" if k_hist < 2 else "errorbar",
 )

# Plotting comparisons on the other axes
mh.comp.comparison(
 h1_train,
 h1_test,
 ax=axes[1],
 comparison="ratio",
 h1_label="Train",
 h2_label="Test",
 color=colors[0],
)

mh.comp.comparison(
 h2_train,
 h2_test,
 ax=axes[2],
 comparison="pull",
 h1_label="Train",
 h2_label="Test",
 color=colors[1],
)

for ax in axes:
 ax.set_xlim(0, 1)

axes[0].set_ylabel("Normalized Entries")
axes[0].legend()
axes[1].set_ylabel("Ratio")
axes[2].set_ylabel("Pull")
axes[-1].set_xlabel("Feature")

fig.align_ylabels() # Align y labels

mh.dune.label(data=True, ax=ax_main)