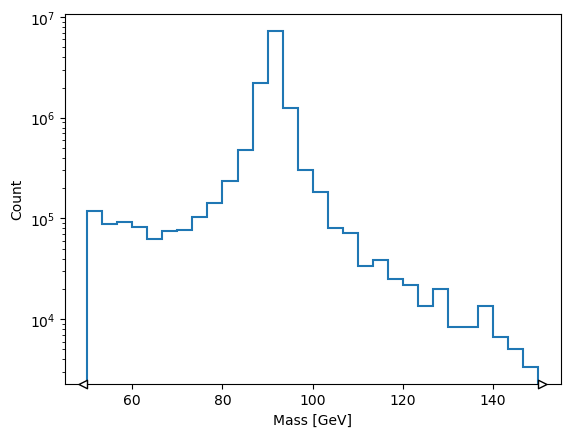
Z peak example
We will plot a invariant mass distribution from a LHE input file.
First, some basic imports.
import hist

import pylhe
# Use an example LHE file from package scikit-hep-testdata
from skhep_testdata import data_path

lhe_file = data_path("pylhe-drell-yan-ll-lhe.gz")
Prepare a histogram to calculate the invariant mass of two particles.
mass_hist = hist.Hist.new.Reg(30, 50, 150).Int64()
Use the generator provided by pylhe to read the events.
events = pylhe.to_awkward(pylhe.LHEFile.fromfile(lhe_file, with_attributes=True).events)
mass_hist.fill(
    (events.particles.vector[:, -1] + events.particles.vector[:, -2]).mass,
    weight=events.eventinfo.weight,
)
Regular(30, 50, 150, label='Axis 0')
Int64() Σ=13189080.0 (16780000.0 with flow)
Int64() Σ=13189080.0 (16780000.0 with flow)
artists = mass_hist.plot1d()
ax = artists[0].stairs.axes
ax.set_yscale("log")
ax.set_xlabel("Mass [GeV]")
ax.set_ylabel("Count");
pylhe also has helpful graph representation of events so you can view what the LHE events you are studying look like.
events = pylhe.LHEFile.fromfile(lhe_file).events
this_event = next(events)
this_event

this_event = next(events)
this_event

You can also render these graphs into a PDF file.
this_event.graph.render(filename="z0-event", format="pdf", cleanup=True)
'z0-event.pdf'
print(this_event)
LHEEvent(eventinfo=LHEEventInfo(nparticles=5, pid=1, weight=1678.21, scale=91.67326, aqed=0.007546771, aqcd=0.129885), particles=[LHEParticle(id=2, status=-1, mother1=0, mother2=0, color1=501, color2=0, px=0.0, py=0.0, pz=225.28790807, e=225.28790807, m=0.0, lifetime=0.0, spin=-1.0), LHEParticle(id=-2, status=-1, mother1=0, mother2=0, color1=0, color2=501, px=-0.0, py=-0.0, pz=-9.3258299877, e=9.3258299877, m=0.0, lifetime=0.0, spin=1.0), LHEParticle(id=23, status=2, mother1=1, mother2=2, color1=0, color2=0, px=0.0, py=0.0, pz=215.96207808, e=234.61373806, m=91.673261728, lifetime=0.0, spin=0.0), LHEParticle(id=-13, status=1, mother1=3, mother2=3, color1=0, color2=0, px=-32.117860394, py=-4.61084611, pz=25.124142411, e=41.037048993, m=0.0, lifetime=0.0, spin=1.0), LHEParticle(id=13, status=1, mother1=3, mother2=3, color1=0, color2=0, px=32.117860394, py=4.61084611, pz=190.83793567, e=193.57668907, m=0.0, lifetime=0.0, spin=-1.0)], weights={'1': 1479.7373, '2': 1375.9668, '3': 1375.9668, '4': 1159.6394, '5': 1479.7373, '6': 1678.21, '7': 1580.9763, '8': 1580.9763, '9': 1375.9668, '10': 1678.21, '11': 1862.8616, '12': 1772.5791, '13': 1772.5791, '14': 1580.9763, '15': 1862.8616, '16': 1479.7373, '17': 1375.9668, '18': 1375.9668, '19': 1159.6394, '20': 1479.7373, '21': 1580.9763, '22': 1580.9763, '23': 1375.9668, '24': 1678.21, '25': 1862.8616, '26': 1772.5791, '27': 1772.5791, '28': 1580.9763, '29': 1862.8616, '30': 1479.7373, '31': 1375.9668, '32': 1375.9668, '33': 1159.6394, '34': 1479.7373, '35': 1678.21, '36': 1580.9763, '37': 1580.9763, '38': 1375.9668, '39': 1678.21, '40': 1862.8616, '41': 1772.5791, '42': 1772.5791, '43': 1580.9763, '44': 1862.8616, '45': 1678.21, '46': 1650.5391, '47': 1596.6108, '48': 1677.2701, '49': 1664.1707, '50': 1623.4566, '51': 1701.9117, '52': 1567.4475, '53': 1723.5693, '54': 1679.283, '55': 1692.3323, '56': 1739.0786, '57': 1646.7857, '58': 1738.8782, '59': 1665.3197, '60': 1713.4374, '61': 1787.4925, '62': 1729.5074, '63': 1678.1383, '64': 1713.7739, '65': 1636.833, '66': 1756.8244, '67': 1658.8736, '68': 1508.3516, '69': 1607.0216, '70': 1659.5849, '71': 1759.4656, '72': 1768.1309, '73': 1730.5205, '74': 1599.1613, '75': 1596.3959, '76': 1757.1922, '77': 1714.7748, '78': 1752.6111, '79': 1718.5473, '80': 1740.6068, '81': 1657.5406, '82': 1740.616, '83': 1587.8548, '84': 1633.4682, '85': 1639.284, '86': 1619.1189, '87': 1697.7026, '88': 1671.7682, '89': 1622.8405, '90': 1686.5946, '91': 1645.4314, '92': 1734.4132, '93': 1603.2781, '94': 1650.747, '95': 1665.4721, '96': 1625.8657, '97': 1706.5981, '98': 1688.3326, '99': 1788.8981, '100': 1800.2926, '101': 1550.2967, '102': 1589.8092, '103': 1583.5438, '104': 1664.015, '105': 1688.933, '106': 1765.4683, '107': 1712.81, '108': 1775.7611, '109': 1758.0019, '110': 1750.6678, '111': 1739.9736, '112': 1743.3282, '113': 1709.8484, '114': 1746.282, '115': 1698.7584, '116': 1659.9069, '117': 1644.1628, '118': 1622.464, '119': 1687.8609, '120': 1667.3198, '121': 1740.9397, '122': 1735.9414, '123': 1759.6464, '124': 1576.6669, '125': 1548.3232, '126': 1655.0804, '127': 1648.8183, '128': 1691.3894, '129': 1636.0688, '130': 1623.1379, '131': 1634.8874, '132': 1594.3627, '133': 1604.5374, '134': 1668.7288, '135': 1672.8018, '136': 1680.6901, '137': 1712.8673, '138': 1670.7171, '139': 1544.2689, '140': 1667.5483, '141': 1638.2448, '142': 1817.0021, '143': 1730.888, '144': 1750.7165, '145': 1681.3896}, scales={}, attributes={}, optional=[], _graph=<graphviz.graphs.Digraph object at 0x7fd7b7f879d0>)